Tailings Dam Monitoring with InSAR & AI
Tailings Dam Monitoring: How Advanced Satellite Intelligence Is Transforming Tailings Dam Safety Tailings dams are among the most critical—and high-risk—structures
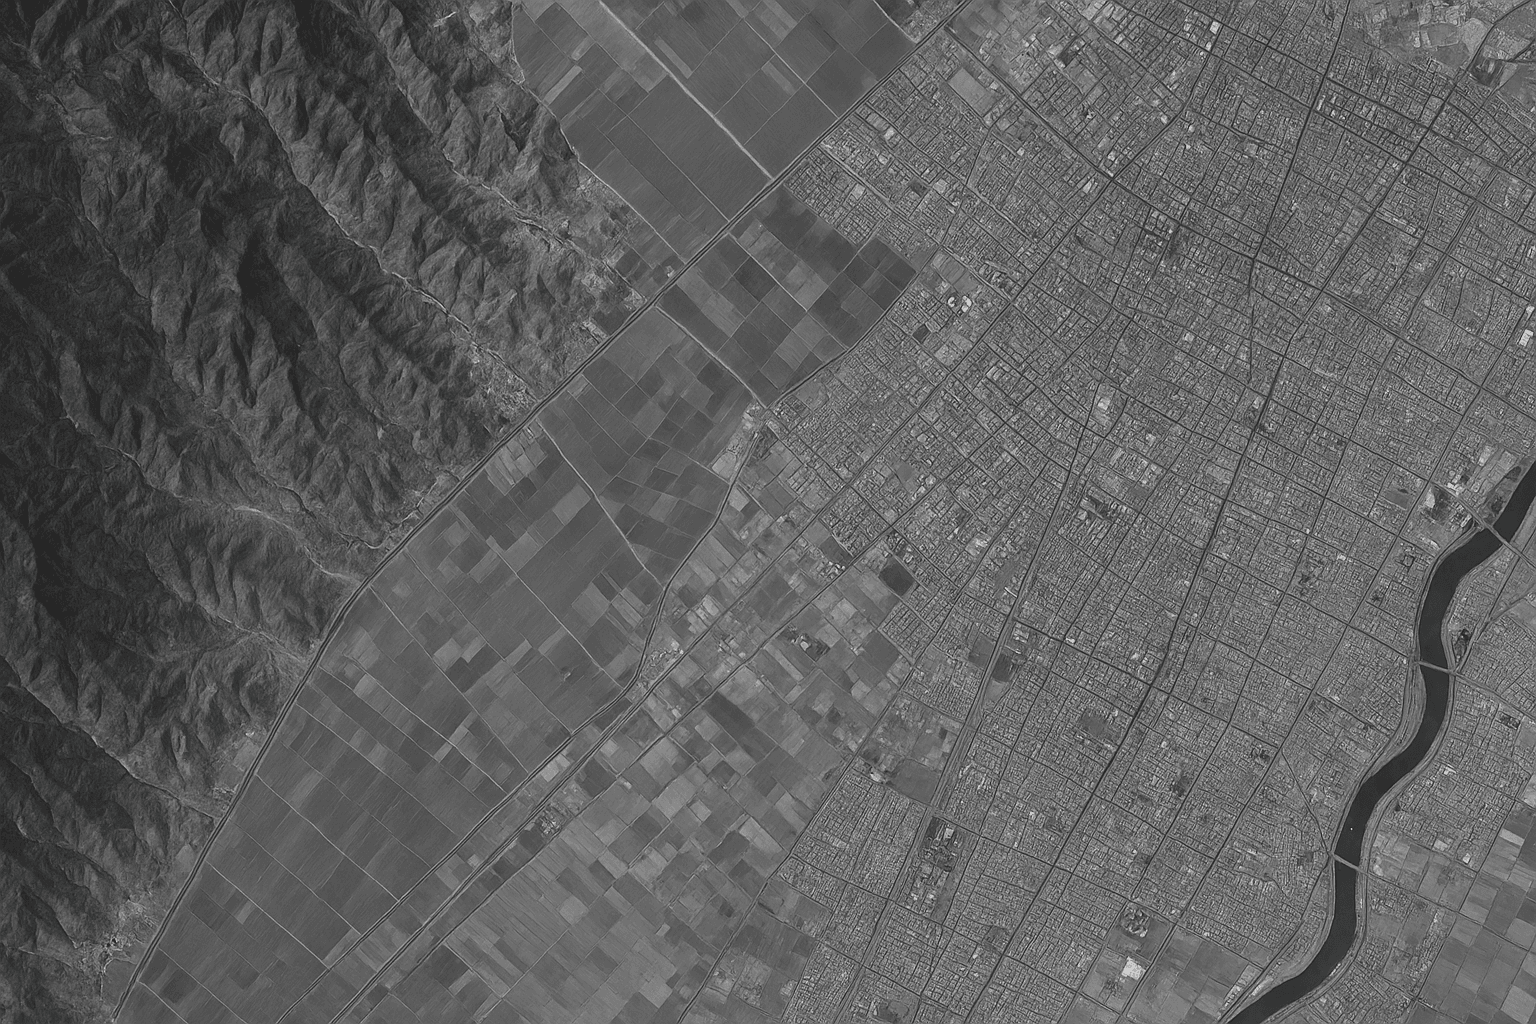
Panchromatic imaging is a powerful technique in satellite Earth observation that delivers high-resolution black-and-white visuals by capturing data in one wide spectral band. A panchromatic image records light intensity across a broad range of visible wavelengths, combining what would typically be separate red, green, and blue data into one highly detailed grayscale image. This results in outstanding spatial clarity that helps detect fine surface patterns or changes on the ground.
While a panchromatic image does not include specific spectral color data, its strength lies in sharpness. The finer detail in panchromatic images supports precise analysis, especially in applications like infrastructure inspection, change detection, urban planning, and mapping tasks where spatial clarity matters more than color.
Several modern Earth observation satellites, also used for multispectral imagery, are equipped to deliver panchromatic imaging with impressive spatial resolutions:
Superview Neo-1: offers 0.3m per pixel resolution.
Superview-2: captures data at 0.4m/px.
Superview-1: delivers 0.5m/px imagery.
GF-7: offers 0.65m/px detail.
GF-2: provides 0.8m/px clarity.
GF-6: delivers imagery at 2m/px.
Each panchromatic image collects more solar energy in each pixel by capturing the total intensity from red, green, and blue ranges together. This concentration of light makes the pixels brighter and sharper, but without the color information found in multispectral data. That’s why panchromatic images appear in greyscale — the tradeoff for spatial resolution is color separation.
Through panchromatic imaging, XRTech Group empowers clients to access more detailed surface observations, especially when combined with Pansharpened Satellite Imagery. This synergy provides enhanced clarity with retained spectral richness, a key advantage in today’s data-driven monitoring environments.
The fundamental difference between panchromatic imaging and multispectral imagery lies in their spectral coverage and the resulting resolution:
Panchromatic images provide high spatial detail in a single wide grayscale band.
Multispectral imaging delivers rich spectral (color) data across specific, narrower bands, although typically at a lower spatial resolution.
Despite their differences, these two image types are often combined using a process called panchromatic sharpening or pansharpening. This technique merges the fine spatial resolution of the panchromatic image with the spectral color information from a lower-resolution multispectral image. The outcome is a pansharpened satellite imagery product—visually enhanced and highly detailed, retaining both sharpness and accurate color representation.
This enhanced image supports better visual interpretation, fine feature detection, and improved analysis, making it useful for critical decision-making in various sectors.
Because panchromatic sensors collect light across a wide spectral band, they offer higher spatial resolution—producing super-sharp black-and-white images ideal for identifying fine details.
Spectral Characteristics:
Typical spectral ranges include:450–700 nm, 450–890 nm, 0.45–0.90 μm, 450–800 nm, or 0.45–0.902 μm (such as in ZY-1 02D satellite imagery).
Resolution:
Panchromatic resolution can be as sharp as 0.3 meters per pixel.
Superview Neo-1: 0.3m/px
Superview-1: 0.5m/px
Superview-2: 0.4m/px
Applications:
Ideal for urban planning, infrastructure mapping, object identification, base map generation, and historical change detection.
Extensively used in disaster monitoring and energy infrastructure analysis due to its fine spatial accuracy.
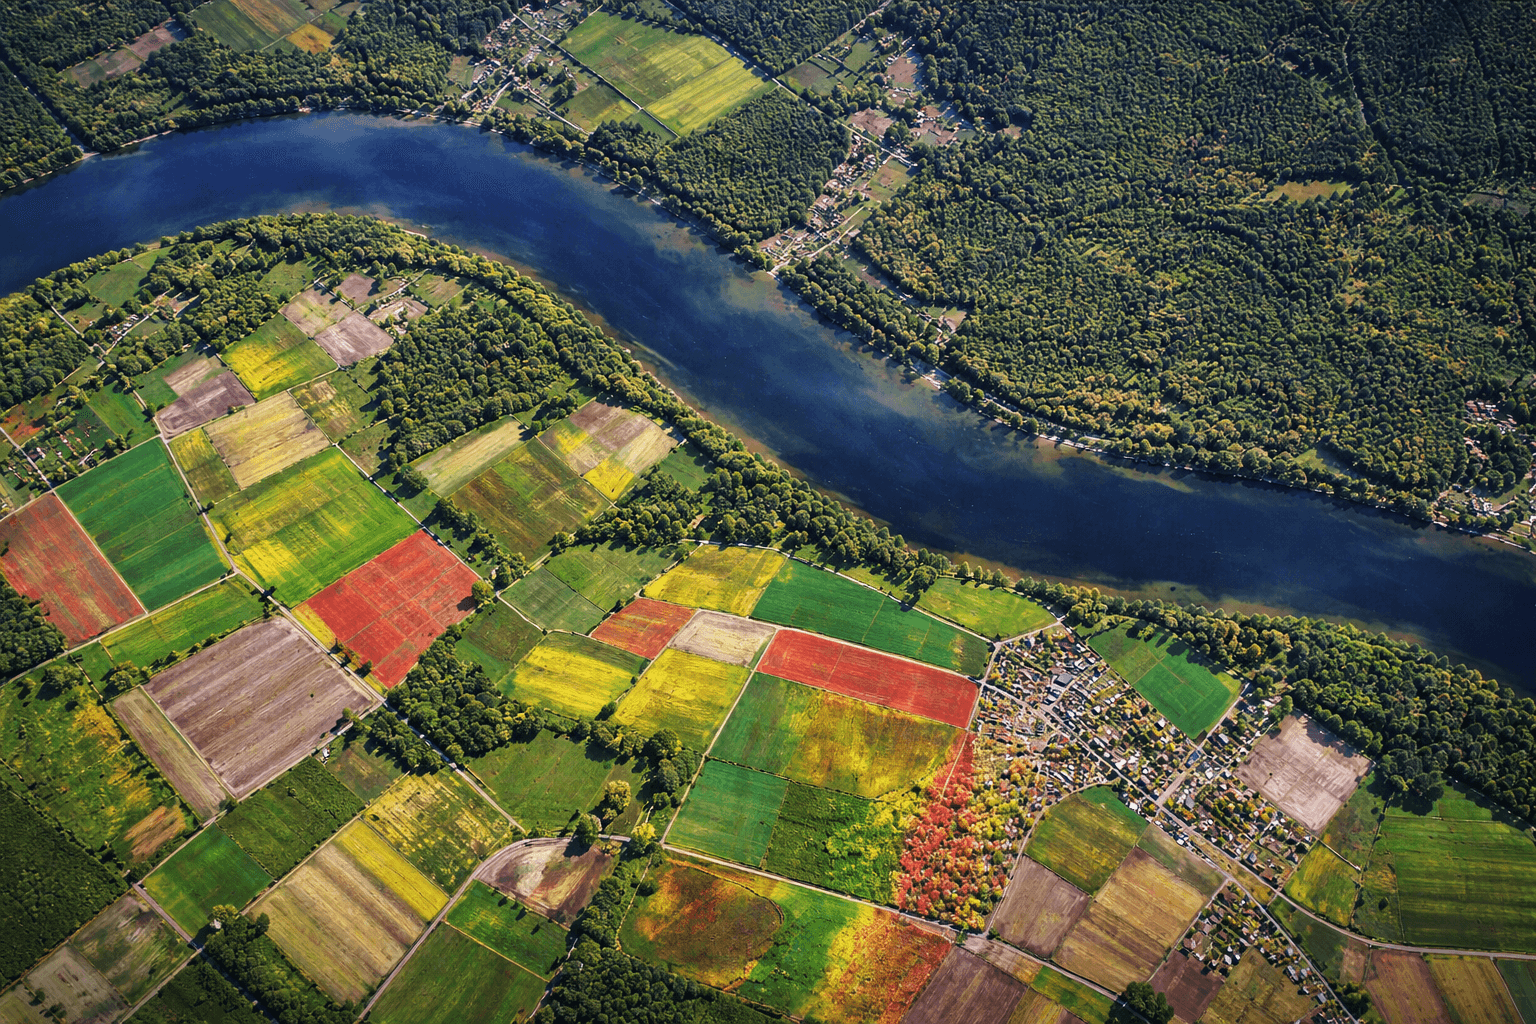
In contrast, multispectral imagery captures data across several distinct, narrower spectral bands. This provides color and spectral information, including light frequencies not visible to the human eye—making it valuable for land cover classification, agriculture, vegetation health, and environmental monitoring.
Spectral Characteristics:
Common bands include Red, Green, Blue (RGB), and Near-Infrared (NIR).
Some advanced satellites like Superview-2 offer additional bands like Purple, Yellow, Red Edge, NIR1, and NIR2.
Mid-Wave Infrared (MWIR) may also be captured in extended multispectral systems.
Resolution:
Multispectral resolution is usually lower than panchromatic.
For example:
Superview Neo-1: Multispectral at 1.2m, while panchromatic is 0.3m.
Panchromatic imagery and Synthetic Aperture Radar (SAR) are two powerful but fundamentally different satellite imaging technologies. They serve different purposes, use different parts of the electromagnetic spectrum, and are best suited for different types of analysis.
| Feature | Panchromatic Imagery | SAR Imagery |
|---|---|---|
| Type of Sensor | Optical (uses visible light) | Active radar (microwaves) |
| Spectral Range | 450–900 nm (visible spectrum, grayscale) | 1 mm to 1 m wavelength (microwave spectrum) |
| Resolution | Very high spatial resolution (e.g., 0.3 m with SuperView Neo-1) | High spatial resolution but depends on radar frequency and mode (e.g., GF-3 SAR, LT-1 SAR) |
| Image Output | Black-and-white grayscale image showing surface detail | Radar backscatter images; visualizes texture, moisture, and structure |
| Weather Independence | Affected by clouds, rain, and night | All-weather, day and night capability |
| Light Source | Requires sunlight | Does not need sunlight – generates its own signal |
| Best For | Visual detail, mapping, urban planning, base maps, infrastructure inspection | Flood mapping, soil moisture, surface deformation, maritime surveillance, and disaster assessment |
| Surface Penetration | Surface only; cannot penetrate vegetation or terrain | Can penetrate clouds, vegetation, snow, and even ground to some extent |
| Spectral Info | Limited to a broad grayscale band | Provides structural, dielectric, and moisture-related information |
| Applications | City planning, object detection, land use monitoring | Geology, agriculture, hydrology, disaster management, defense, ship tracking, and terrain analysis |
| Notable Satellites | SuperView-1, SuperView-2, ZY-1 02D (Panchromatic) | GF-3 SAR, LT-1 SAR, Capella Space, Sentinel-1 (SAR) |
Choose Panchromatic imagery if you need high-resolution visual data in daylight and clear weather—for example, for urban infrastructure analysis, visual inspections, or mapping.
Choose SAR imagery when you need consistent data regardless of weather or lighting conditions, or when you’re analyzing moisture, topography, or disaster-prone areas.
Tip: At XRTech Group, both Panchromatic and SAR satellite images are available across multiple satellites. Our experts help clients choose the right type based on project needs—whether it’s daily revisit for precision agriculture, flood detection, or change monitoring in dense urban zones.
Both panchromatic imagery and SAR imagery appear black and white at first glance, but for very different reasons. While they share a grayscale appearance, the data they capture and how they are interpreted are fundamentally different.
Panchromatic images are created using a single broad band in the visible spectrum (usually 450–900 nm). They capture light in a wide range and combine it into a single channel, producing a high-resolution black and white image.
The brightness in a panchromatic image corresponds to how much light is reflected by objects.
Brighter areas often represent concrete, roads, or dry land, while darker areas can represent vegetation or water.
Panchromatic sensors are passive—they rely on sunlight to illuminate the Earth’s surface.
SAR imagery is created using microwave radar waves that are sent by the satellite and reflected back from Earth’s surface.
The grayscale output shows backscatter intensity, not light.
Bright areas in SAR images represent surfaces that strongly reflect radar signals (like metal roofs or rough terrain).
Dark areas may represent water, smooth surfaces, or radar-absorbent materials.
SAR is active sensing—it does not depend on sunlight and works day or night, even through cloud cover or rain.
Even though both types of images are black and white:
Panchromatic imagery is based on optical brightness (reflected sunlight).
SAR imagery is based on electromagnetic backscatter (radar interaction with objects).
Panchromatic images are widely used in satellite imaging because they provide high-resolution grayscale data from a broad wavelength range. A panchromatic band can be used to significantly enhance the spatial resolution of multispectral images through a technique called panchromatic sharpening or pansharpening. This method fuses the high-resolution panchromatic image with lower-resolution color bands, resulting in a detailed and clear color image.
While this process improves image clarity, it can sometimes introduce spectral distortion, which may affect the accuracy of object classification in analysis. Despite this limitation, the value of panchromatic imaging is evident in various fields.
Because of their fine detail and clarity, panchromatic images are used in:
1. Urban Planning and Smart City Development
Panchromatic satellite images help city planners analyze layouts, assess road networks, and identify optimal zones for construction or infrastructure upgrades.
2. Disaster Monitoring and Emergency Response
During events such as earthquakes, floods, or landslides, panchromatic imagery allows for quick visual assessment of affected areas and supports rapid decision-making.
3. Monitoring Energy Infrastructure
High-resolution panchromatic data supports inspection of pipelines, powerlines, and renewable energy sites like solar farms, helping identify damage or unauthorized access.
4. Object Identification and Security Monitoring
These images enable visual identification of buildings, vehicles, or structural changes with precision, supporting surveillance and security applications.
5. Base Map Creation
Panchromatic images are often used to build accurate base maps that serve as foundational layers for geographic information systems (GIS), especially in urban or industrial areas.
6. Historical Change Detection
Comparing panchromatic images over time helps track changes in land use, development patterns, or environmental shifts.
At XRTech Group, we provide access to panchromatic satellite images from top satellites, optimized for both clarity and analytical value. Whether you’re enhancing multispectral data through pansharpened satellite imagery or performing detailed mapping, our expert team ensures you receive the best data for your specific goals.
Panchromatic sharpening, also known as pansharpening, is a widely used technique in remote sensing. It is designed to enhance the spatial resolution of multispectral images by fusing them with high-resolution panchromatic imagery. This process helps generate sharper, more detailed images without significantly compromising the color (spectral) information.
Pansharpening involves merging a low-resolution multispectral image with a high-resolution panchromatic image that covers the same geographic area. The result is a high-resolution color image that combines the spatial detail of the panchromatic band with the spectral data from the multispectral bands.
Panchromatic imagery is a single-band grayscale image that captures a broad range of visible wavelengths. Because of its wide spectral sensitivity and high spatial resolution, it is ideal for sharpening multispectral data. These sharp, black-and-white images are capable of highlighting fine features such as:
Road networks and building edges in urban planning
Utility lines and pipelines in energy infrastructure monitoring
Damage assessment in disaster response mapping
Satellites capable of panchromatic sharpening offer resolutions as fine as 0.3 meters per pixel, making them valuable for applications that require precise visual analysis.
At XRTech Group, we provide access to panchromatic imaging and advanced pansharpened satellite imagery, helping professionals across industries make better decisions using high-resolution, fused satellite data.
Enhancing multispectral imagery using panchromatic bands is known as pansharpening. This technique improves the spatial resolution of color composites while maintaining their spectral qualities. Below are the most widely used sharpening methods in remote sensing:
HSV (Hue, Saturation, Value) Sharpening is a basic yet effective method. It works by replacing the low-resolution value layer in an HSV image with a higher-resolution panchromatic band. The hue and saturation remain unchanged, so the image retains its original colors while gaining sharper spatial details. This method is especially useful in quick visual applications.
Gram-Schmidt sharpening is a more accurate and widely accepted method, particularly in GIS applications. It simulates a panchromatic image from multispectral bands and then fuses it with the actual high-resolution panchromatic data. This allows for better spectral integrity and more realistic color rendering.
The Brovey Transform is based on spectral normalization and is commonly used with false-color imagery. It adjusts the intensity of each multispectral band relative to the panchromatic band, enhancing visual contrast. The method works best when the panchromatic band closely aligns with the visible spectrum.
Pansharpening offers multiple advantages for industries that rely on high-resolution satellite imagery. By merging multispectral data with high-detail panchromatic images, it creates a sharper and more insightful view of the Earth’s surface. Here are the key benefits:
Enhanced Visual Clarity
Pansharpened images offer high spatial resolution, making it easier to identify small structures, road networks, and field boundaries. This is critical in fields like urban development or asset inspection.
Improved Image Analysis
Combining spatial detail with spectral richness allows better landscape interpretation. Users can differentiate between vegetation types, land cover, and even subtle surface changes.
Smarter Decision-Making
High-resolution, color-rich images support accurate decision-making in urban planning, infrastructure monitoring, agriculture, and environmental assessment.
Optimized Agricultural Insights
Farmers and agronomists can assess crop health more precisely using pansharpened data. This supports better irrigation planning, fertilizer application, and pest control.
Efficient Data Integration
XRTech Group delivers pansharpened images in formats like GeoTIFF, SHP, and DWG, allowing easy use in GIS and CAD software for advanced mapping and analysis.
Storage and Transmission Efficiency
Panchromatic sharpening reduces the need to transmit large volumes of raw multispectral data. For example, SuperView-1 imagery—after sharpening—can increase from 2GB to over 15GB per scene, but only when needed. This flexibility supports bandwidth management and satellite storage efficiency.
With XRTech Group’s pansharpening services, clients benefit from enhanced resolution, accurate spectral data, and fully compatible file formats tailored for professional analysis and decision-making.
Panchromatic and pansharpened satellite imagery give you the best of both worlds — sharp details and rich color. Panchromatic images offer high-resolution black-and-white data that show fine ground features. When these are combined with multispectral images through pansharpening, the result is detailed, color-enhanced visuals perfect for analysis, planning, and decision-making.
From urban mapping to agriculture, construction monitoring, and disaster response, pansharpened imagery gives professionals the visual clarity and accuracy they need. XRTech Group delivers high-resolution panchromatic and multispectral satellite images tailored for GIS, CAD, and analysis workflows. If you need clear, sharp satellite imagery that saves time and supports smarter choices, panchromatic sharpening is the way forward.
Panchromatic imagery is a black-and-white image taken by a satellite sensor that captures a wide range of visible light. It has high spatial resolution, so it shows fine ground details clearly.
Pansharpening is a technique that combines high-resolution panchromatic images with lower-resolution multispectral images to create sharp, color-rich images.
Panchromatic images are naturally black and white because they only capture brightness, not color. Multispectral images are low-resolution by default and need pansharpening to show detailed colors.
Pansharpened images combine color information with high detail, making it easier to analyze land use, crops, construction, or urban areas with greater accuracy.
Panchromatic imagery shows more detail, but it lacks color. Multispectral imagery shows color but less detail. Together, they provide the best result when fused through pansharpening.
Popular techniques include HSV Sharpening, Gram-Schmidt Transformation, and Brovey Transformation. Each method keeps the color while improving sharpness.
High-resolution panchromatic imagery from satellites like SuperView or GF-2 can reach up to 0.3m per pixel, ideal for detailed inspection and planning.
Yes. XRTech Group provides pansharpened images in formats like GeoTIFF, SHP, or DWG that work well in GIS and CAD platforms.
It is used in urban planning, agriculture, construction monitoring, energy inspection, environmental mapping, and disaster response.
XRTech Group offers accurate, high-resolution panchromatic and multispectral imagery that’s processed and delivered in user-ready formats, ensuring better decision-making across industries.
Tailings Dam Monitoring: How Advanced Satellite Intelligence Is Transforming Tailings Dam Safety Tailings dams are among the most critical—and high-risk—structures
From Visible Light to Spectral Intelligence in Modern Satellite Remote Sensing Satellite imaging has moved beyond photography. For decades, Earth