Tailings Dam Monitoring with InSAR & AI
Tailings Dam Monitoring: How Advanced Satellite Intelligence Is Transforming Tailings Dam Safety Tailings dams are among the most critical—and high-risk—structures
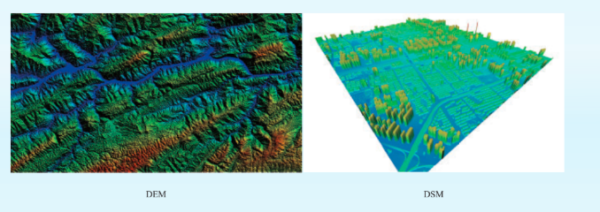
Have you ever wondered how we map the Earth’s surface with such incredible detail? How can we measure mountains, rivers, forests, peaks, natural habitats, valleys, and even urban skylines and human-made infrastructure so accurately? The answer lies in Digital Elevation Models (DEM), Digital Surface Models (DSM), and Digital Terrain Models (DTM). These tools are essential in satellite imagery and geospatial analysis, helping us visualize and understand the Earth’s surface.
With technology advancing rapidly, these elevation models are now used in everyday applications. From urban planning and environmental conservation to disaster management, you can identify regions at high risk of sea-level rise and detect areas where vegetation is spreading, and gaming, their impact is far-reaching. But what exactly are these models? How do they differ, and why are they important?
In this guide, we’ll explore these terms in depth and explain how they work. By the end of this article, you’ll have a clear understanding of DEM, DSM, and DTM, their applications, and how they are shaping industries worldwide.
Let’s embark on this journey to uncover the science behind satellite imagery, and how these models transform raw data into meaningful insights. Whether you’re a student, professional, or just curious, this guide is here to make complex topics simple and interesting!
Now, let’s dive deeper into the world of digital elevation models and discover why they are such a game-changer.
A Digital Elevation Model (DEM) is a specialized map that shows the elevation or height of the Earth’s surface. Think of it as a 3D representation of the land, helping us understand how high or low different areas are. These models are created using raster grids, where each tiny square or “cell” represents the elevation of a specific spot on the Earth’s surface. DEMs are referenced to a vertical datum, which is the baseline scientists use to measure elevation.
For most applications, the term DEM is used in a general sense. It can include both bare-earth models (without trees, buildings, or other objects) and surface models that include everything on the ground. When DEMs have a high spatial resolution (with smaller grid cells), they provide more detailed information. If you need to study or model landscapes with a lot of fine details, choosing a DEM with small grid spacing is essential.
When it comes to mapping the Earth’s surface, Digital Elevation Models (DEMs) play a key role. DEMs help represent elevation data in a structured way. They can be categorized into Digital Surface Models (DSMs) and Digital Terrain Models (DTMs). Both serve unique purposes, and understanding their differences is important to choose the right one for your needs. Let’s explore these types in detail.
DSMs capture everything visible on the Earth’s surface, including buildings, trees, and other structures. This makes them ideal for applications such as urban planning, forestry, and landscape analysis. Because DSMs include all surface features, they’re often used in:
On the other hand, DTMs focus solely on the bare Earth, removing surface features like trees and structures. They provide a clearer picture of the land’s natural topography, making them crucial for:
Another method to represent elevation data is through Triangulated Irregular Networks (TINs). Unlike DEMs, which use a grid system of rows and columns, TINs rely on a vector-based format. They place elevation points at critical locations and connect them with triangles, creating a mesh-like structure.
Despite their precision, TINs are less popular than grid-based DEMs because of their complexity and storage requirements.
With advancements in technology, elevation point clouds are becoming a widely used alternative to DEMs. These datasets are a collection of millions of individual elevation points, often captured using LiDAR (Light Detection and Ranging). LiDAR has transformed how elevation data is gathered, offering unparalleled accuracy and detail.
Additionally, stereo images can now be processed to derive point clouds, making the technology more accessible. This approach ensures all critical elevation details are preserved while offering high storage efficiency.
Despite the advantages of TINs and elevation point clouds, DEMs remain the most popular choice for elevation data. Here’s why:
For these reasons, DEMs continue to dominate applications ranging from satellite imagery analysis to topographic mapping.
A Digital Surface Model (DSM) is a representation of the Earth’s surface that includes all features on top of it, whether natural or man-made. These features could be anything elevated above the ground, such as vegetation, buildings, or other structures. Unlike models that show only the bare Earth, DSMs display a reflective surface of everything that stands above it.
In simple terms, a DSM captures the Earth’s surface as it is, complete with trees, houses, and any objects rising above the land.
Thanks to their detailed representation of both natural and artificial structures, DSMs are crucial in many industries. Let’s explore some of their most important uses:
In rapidly growing cities, DSMs help visualize how new developments will integrate into existing infrastructure. For example:
In aviation, DSMs are used to ensure safe navigation and landing. Specifically:
During emergencies like floods or earthquakes, DSMs provide valuable data to assess damage and plan recovery. For example:
For forestry and agriculture, DSMs help track vegetation growth and monitor changes over time. This is particularly useful for:
DSMs enhance navigation, especially in challenging terrains like mountainous regions or densely populated cities. They provide highly detailed elevation data, which improves route planning and GPS accuracy.
From video games to architectural models, DSMs are vital for creating realistic 3D environments. This is especially important in industries like:
Governments, businesses, and researchers use DSMs to make informed decisions in a variety of fields, including transportation, real estate, and energy infrastructure.
Digital Surface Models are essential because they:
DSMs are typically created using advanced technologies like:
These tools ensure that DSMs are reliable, detailed, and suitable for various applications.
Digital Terrain Models (DTMs) are essential tools in mapping and geographic data analysis. They are 3D representations of the Earth’s surface, created to show the bare-earth terrain. This means DTMs exclude surface objects such as buildings, trees, and other man-made or natural structures.
While DTMs and Digital Elevation Models (DEMs) are closely related, the distinction between them lies in the level of detail and purpose. A DEM represents the surface elevation, including all objects on the ground, whereas a DTM refines this by removing these objects to focus solely on the Earth’s geodesic surface.
For example:
In some regions or fields, people use DTM to describe vector data that include specific natural features such as ridges and breaklines. However, both interpretations emphasize the terrain’s height, represented through X, Y, and Z coordinates.
The differences between DTMs and DEMs become more pronounced in urban areas. For instance:
Regardless of these subtle distinctions, DTMs are vital for applications in engineering, urban planning, flood risk assessment, and more.
The creation of Digital Terrain Models involves advanced technologies and precise methodologies. These include:
LiDAR (Light Detection and Ranging)
Stereophotogrammetry
SAR (Synthetic Aperture Radar)
Ground Surveying
Digitized Contours
From DSMs (Digital Surface Models)
DTMs are crucial for many fields:
Bare-Earth Representation
3D Data Representation
High Accuracy
Scalable Detail
Urban regions like Mumbai or Dubai present unique challenges due to dense infrastructure. Here’s how DTMs make a difference:
By accurately representing the natural surface, DTMs help in making informed decisions that balance urban development and environmental sustainability.
Digital Elevation Models (DEMs) and Digital Terrain Models (DTMs) are essential tools in modern mapping and geographic studies. But their quality and accuracy are determined by several key factors. Understanding these factors is crucial when working with these models, as they impact how the data is used and interpreted. Let’s explore these elements in detail.
Vertical Resolution
Vertical resolution refers to how accurately elevation is measured. Higher vertical resolution means better precision, which is especially important for projects requiring fine detail, such as urban planning or construction.
Terrain Roughness
The quality of DEM/DTMs depends on the natural features of the landscape. Rugged terrains with steep slopes are more challenging to model than flat areas, which may affect the accuracy.
Sampling Density and Spatial Resolution
Terrain Analysis Algorithm
Algorithms analyze the landscape to create DEMs and DTMs. Advanced algorithms deliver higher accuracy, especially in complex terrain.
Interpolation Methods
When creating DEMs, interpolation fills gaps in data. The type of interpolation method used can affect the model’s smoothness and accuracy.
Reference 3D Products and Quality Masks
High-quality reference data, including masks for coastlines, snow, clouds, and water bodies, ensures the DEM/DTM is reliable. These masks eliminate errors caused by temporary or obscured features.
DEMs are widely used in various fields to solve real-world problems. Their versatility makes them valuable in both scientific and practical applications. Here are some of the most common uses:
DEMs help plan and manage infrastructure, such as roads, bridges, and urban developments. They provide critical elevation data needed for design and construction.
DEMs are essential for analyzing water flow patterns, predicting flooding, and managing water resources effectively.
Urban planners rely on DEMs to design sustainable cities, assess land suitability, and manage zoning regulations.
DEMs are used to model:
With DEMs, you can create realistic 3D models of landscapes. These models are used in video games, virtual reality, and architectural visualization.
Scientists use DEMs for terrain corrections in gravimetry and physical geodesy, improving the accuracy of their measurements.
DEMs support research in physical geography and geomorphology by helping analyze landforms, slopes, and other terrain features.
While these terms are often used interchangeably, DEM, DSM, and DTM have distinct meanings. Let’s break them down.
A DSM captures the topmost surface of the earth, including natural and man-made features.
A DEM is a broad term that includes both DSMs and DTMs. It represents elevation data but doesn’t always specify whether it’s bare earth or includes features.
A DTM represents the bare-earth surface. It removes all objects, such as trees and buildings, to focus solely on the terrain.
When working with DEMs, DSMs, or DTMs, the quality of your data is critical. Poor-quality elevation models can lead to:
On the other hand, high-quality DEMs ensure:
If you’re looking to find Digital Elevation Models (DEMs), you’re in luck! There are many places where you can access DEM data from all over the world, ranging from free satellite data to highly detailed LiDAR sources. These datasets provide essential information about the Earth’s surface, which is useful in fields like geography, urban planning, agriculture, and environmental studies. Let’s take a look at where you can find DEMs, their unique features, and why you should choose them for your projects.
USGS Earth Explorer is a popular platform for obtaining DEMs. It offers global coverage, which means you can access elevation data from almost any part of the world. The site provides a wealth of data that includes SRTM (Shuttle Radar Topography Mission), LiDAR, and other elevation datasets.
Why choose USGS Earth Explorer?
How to use it?
The Copernicus Open Access Hub is another excellent resource for DEMs, especially for those who need data on Europe and global-scale elevations. This platform is part of the European Space Agency’s Copernicus Program, which provides a wide range of Earth observation data, including Sentinel satellites, which deliver DEMs.
Why choose Copernicus?
How to use it?
NASA’s SRTM (Shuttle Radar Topography Mission) data is one of the most widely used sources for DEMs. It covers nearly the entire Earth and provides elevation data with a 30-meter resolution (for most parts of the world), although some regions have a resolution of up to 90 meters.
Why choose NASA’s SRTM?
How to use it?
OpenTopography is a platform designed to provide access to LiDAR data and DEMs. It is a highly specialized resource for those who need high-precision elevation models, especially in urban and environmental studies.
Why choose OpenTopography?
How to use it?
The ASTER (Advanced Spaceborne Thermal Emission and Reflection Radiometer) project provides another excellent source of DEMs. It offers global coverage at a resolution of 30 meters, similar to SRTM, but with slightly different data sources and methods.
Why choose NASA’s ASTER?
How to use it?
For high-resolution DEMs, DigitalGlobe is a fantastic option. Known for its commercial satellite imagery, DigitalGlobe offers high-quality DEMs that are used in urban planning, disaster management, and many other fields.
Why choose DigitalGlobe?
How to use it?
If you’re seeking cutting-edge, high-precision DEMs for professional and commercial applications, XRTech Group is an excellent option. XRTech Group is known for providing innovative solutions in satellite imagery, 3D modeling, and elevation data. Their services cater to a wide range of industries, including urban planning, construction, and environmental monitoring.
Why choose XRTech Group?
Check out – Our Satellite Imagery Solution
How to use it?
When it comes to digital elevation data, Digital Elevation Models (DEMs) are essential tools used for mapping and analyzing terrain. These files contain detailed information on the elevation of Earth’s surface, and understanding how to work with these files is critical for various industries, including urban planning, environmental monitoring, and natural resource management.
With the vast amount of elevation data available online today, you may wonder about the best format for DEMs and how to open them properly. Well, DEM files are typically stored in various formats, and knowing which one to use depends on your needs and the software you’re using.
DEMs are usually stored in either vector or raster formats. In vector format, elevation is represented by individual points, while in raster format, elevation data is embedded in a grid of pixels.
Here are some common formats for DEMs:
.CSV (Comma Separated Values): A simple format that stores data in rows and columns. Each row typically represents a point, and the columns can contain elevation values and coordinates.
.TIF (Tagged Image File Format): This format is commonly used for raster DEMs. GeoTIFF is a type of TIFF that allows location information to be embedded, making it a very useful format for spatial data.
.FLT (Floating Point): This is another common format for storing raster-based DEMs. It allows for precise elevation data but may require specialized software to read.
.DEM (Digital Elevation Model): A dedicated file format for DEMs, often used in GIS (Geographic Information System) applications. This format is versatile and widely supported in various mapping software tools.
Now, if you’ve chosen a DEM file that works for your project, the next step is knowing how to open it and analyze it. DEMs require specialized software because the data isn’t directly viewable in standard web browsers.
To work with DEMs, you’ll need a Geographic Information System (GIS) or other specialized software. These tools help you visualize, analyze, and manipulate elevation data. Here are some of the most popular GIS tools that can handle DEMs:
ArcGIS: This is one of the most commonly used GIS tools in the industry. ArcGIS offers powerful features for exploring and analyzing DEMs, such as creating elevation layers and performing spatial analysis. It also provides a helpful guide for beginners and advanced users alike.
QGIS 3: QGIS is a free, open-source GIS software that’s widely loved for its ease of use and versatility. With its 3D layer view, it allows you to visualize DEMs in three dimensions, which can be very useful for terrain analysis. You can also explore tutorials that show you how to use QGIS 3 effectively.
QGIS 2: For those who prefer a lighter version of QGIS, QGIS 2 offers plenty of functionalities for working with DEMs. It’s especially helpful for automating map production and data analysis.
gVSIG: Another open-source GIS software, gVSIG is known for its ease of use and is especially effective when working with CAD tools and mobile applications for DEMs.
GRASS GIS: GRASS GIS is a powerful and free tool with a vast selection of over 350 vector and raster manipulation tools. It’s suitable for advanced users who need to perform complex analyses on DEMs.
Once you have your DEM file and the appropriate software, the next step is visualizing the data. There are several ways to do this, and the visualization method you choose depends on the purpose of your analysis. Visualizing DEMs can help you better understand the terrain, elevation changes, and landforms.
Let’s explore some DEMs visualization techniques:
If you’re using QGIS 3.0, you can take advantage of its 3D layer view, which enables you to view DEMs in three dimensions. This is particularly useful for urban planning, environmental studies, and geological surveys. The 3D visualization makes it easier to interpret elevation data and analyze the landscape’s features.
Tutorial 1: Learn how to visualize DEMs in 3D with QGIS 3.0 by following this comprehensive guide.
Tutorial 2: Here’s a comparison of visualizing DEMs using QGIS 3.0 and ArcGIS Pro, providing a great resource for those interested in comparing the two tools.
Another popular way of visualizing DEMs is through relief shading or contour maps. Relief shading helps you see the shape of the terrain, giving you a sense of depth and elevation. Contour maps, on the other hand, use lines to represent areas with the same elevation. Both techniques are valuable for understanding landforms and are commonly used in geological studies and landscape mapping.
When mapping landforms, particularly in earth sciences, curvature visualization is one of the most effective methods. This approach helps produce unbiased results by providing a clear view of the terrain’s curvature without any lighting bias. It’s highly recommended when mapping subtle landforms, such as valleys or small hills.
For those who are comfortable with coding, Python can also be used for DEM visualization. Using packages like GDAL and Matplotlib, you can plot elevation contours from raster DEMs. This is a fantastic option for more advanced users who wish to create custom visualizations and work with large datasets.
While DEMs provide valuable elevation data, there are some challenges to consider when visualizing them. As mentioned earlier, DEMs can sometimes contain errors, such as undefined areas, poorly defined coastlines, or inaccurate water bodies. These issues may arise because DEMs are typically derived from raw data and may need further processing or cleaning to ensure accuracy.
For example:
The process of creating and analyzing a DEM involves several essential components. Let’s break these down:
Data Acquisition
Data Modeling
Data Management
Application Development
The uses of DEMs are vast, spanning across multiple sectors. Here are some of the general uses of DEMs:
Slope Analysis
Aspect Analysis
Delineating Drainage Networks
Identifying Geological Structures
Viewshed Analysis
3D Simulations
Change Analysis
Orthorectification
Contour Mapping
The key to building a Digital Elevation Model (DEM) is having accurate elevation data (Z) that is defined spatially, usually by X and Y coordinates.
This elevation data is typically referenced against an arbitrary datum, which is often the mean sea level. For accurate DEM creation, it’s crucial that:
Various data acquisition methods (such as satellite imagery, LiDAR, and radar) determine the accuracy and quality of the DEM. Each method has its own advantages and limitations.
For instance, satellite imagery offers the advantage of continuous monitoring, with consistent metadata like the orbit file and angle of incidence. This ensures high accuracy and consistency in acquiring elevation data for DEMs.
Satellite data is one of the most common methods used to capture elevation data for DEMs. There are two main ways that satellites collect data:
Optical Imagery for Stereoscopic Analysis
Radar Information for Interferometric Analysis
The accuracy of a DEM is crucial for its application. One common way to measure accuracy is by calculating the Root Mean Square Error (RMSE) of elevation data by comparing DEM points to reference points.
However, accuracy goes beyond just vertical elevation. Several factors influence the overall accuracy of a DEM, such as:
For instance, manual methods such as DGPS are prone to sampling bias, whereas satellite methods like LiDAR offer high precision and reduce bias.
Several factors can affect the accuracy of a DEM:
Atmospheric and Ionospheric Influence
Temporal Decorrelation
Coregistration Errors
Phase Errors and Signal Decorrelation
“Shadow” Effects
When working with Digital Elevation Models (DEMs), it is crucial to understand the different types of resolutions that can affect the quality and suitability of the data for a specific project or application. These resolutions include spatial resolution, vertical resolution, and temporal resolution. Each resolution plays a vital role in determining the accuracy and detail of the elevation data, which is used in various applications like flood modeling, landscape analysis, and construction planning.
Spatial resolution refers to the distance between individual sample points in the elevation data. This resolution defines how much detail is captured in a DEM and can vary based on the method used to obtain the data.
When choosing a DEM for your project, the spatial resolution is one of the first factors to consider. Higher resolution data is ideal for projects requiring intricate details, such as city planning or flood modeling. However, keep in mind that higher spatial resolution data can also be more data-heavy and computationally demanding.
Vertical resolution, or vertical accuracy, is one of the most crucial aspects of a DEM. It defines the height difference between the modeled elevation (or the DEM’s elevation data) and the actual ground-truthed elevation (the true elevation on the earth’s surface). In simpler terms, vertical resolution tells you how accurately the model represents the true height of the land.
Different providers of DEMs may also have varying definitions of what constitutes vertical resolution. Therefore, it is important to understand the specifics of the DEM data you are working with, especially if you plan to use it for precise tasks like flood mapping or structural engineering.
Temporal resolution refers to how recent the elevation data used to generate a DEM is. For example, if you are analyzing a location that has undergone significant changes in recent months, it is important to use a DEM with a high temporal resolution, meaning the data was acquired recently.
For instance, a DSM (Digital Surface Model), which includes data about the ground and everything above it (like trees or buildings), is particularly useful when analyzing something that changes frequently, like vegetation growth or new construction.
When working with DEMs, you might encounter errors in the form of sinks or peaks. These errors can affect the accuracy of your analysis, especially in hydrology or terrain modeling.
What is a Sink? A sink is an area where the elevation data is lower than its surrounding areas. It is essentially a depression or pit in the terrain. Some sinks are natural, particularly in regions with glacial landscapes, but many are due to errors in the DEM creation process.
What is a Peak? A peak, also known as a spike, is the opposite of a sink. It is an area where the elevation is higher than its surrounding cells. These are often natural features, such as mountain peaks, but can also result from errors in DEM data processing.
The presence of sinks and peaks in a DEM can lead to incorrect flow direction calculations in hydrological modeling. For instance, sinks can create problems when modeling water flow, as they might incorrectly suggest that water would flow into a depression rather than follow the natural terrain slope.
To ensure accurate results in your DEM analysis, it’s essential to remove or fill sinks and peaks. This process is critical for applications that rely on flow direction analysis, such as flood prediction and watershed modeling.
Creating a depressionless DEM means that all sinks are removed or filled, allowing the model to accurately simulate water flow and other environmental processes. Many GIS software tools offer features for identifying and correcting sinks and peaks, ensuring that your DEM data is as accurate as possible.
One of the most important applications of DEMs is in hydrology, especially for modeling flood risk and understanding water movement across landscapes. Flood inundation models use DEM data to simulate how water will spread during a flood, providing vital information for emergency preparedness and disaster management.
Flood Inundation Mapping: This process helps predict the extent of floodwaters in an area, which is crucial for informing local authorities and residents about flood risks. DEMs help model the depth and spatial extent of floods, which can be vital for disaster response and mitigation strategies.
Urban Planning and Development: DEMs are also essential for urban development projects. They allow city planners to evaluate the terrain and ensure that buildings, roads, and other infrastructure are constructed in suitable locations, minimizing flood risk and ensuring environmental sustainability.
As the world faces the effects of climate change, DEMs are becoming increasingly important for understanding the impact of rising sea levels. By modeling the landscape and predicting how floodwaters will spread, DEMs can help governments and communities plan for the future and protect vulnerable areas.
Digital Orthographic Maps (DOM), also known as Orthoimages, are powerful tools in the world of geospatial data. These images are georeferenced and corrected to eliminate terrain distortions, which can cause pixel offsets in the original product. Essentially, an orthoimage provides a true-to-scale, undistorted view of the Earth’s surface, making it an essential tool for accurate mapping and analysis.
At XRTech Group, we provide high-resolution orthoimages with a resolution of 50 cm and 8m CE90 or better. This level of accuracy ensures that our orthoimages are reliable for extracting important features such as buildings, roads, and other objects. These maps also serve as basemaps for various applications, including monitoring changes over time.
Orthoimages are crucial for a wide range of industries, from urban planning to emergency management. At XRTech Group, we create Digital Elevation Models (DEM) using orthoimages that help project planners, emergency operation managers, and logistics managers to plan and optimize field operations. These maps ensure that the best terrain conditions and accessibility are considered when planning project objectives.
With high-quality DEM data, our digital elevation models can be used to support engineering designs, construction activities, mining projects, land development, geological surveys, and more. By using this data, professionals can make better decisions and ensure that operations are executed efficiently.
The use of DEM data is widespread across several industries, offering multiple applications. Here’s a breakdown of some areas where Digital Elevation Models (DEM) are particularly valuable:
Construction and Engineering Designs: By utilizing DEM data, planners can assess the terrain for building projects, ensuring that the land is suitable for construction and that designs fit well with the landscape.
Mining Projects: DEM data is used for planning mining operations by evaluating the topography and determining the best routes for equipment and transport. It also helps with monitoring environmental changes over time.
Land Development: Developers rely on DEM data to study elevation and terrain conditions, ensuring that their projects are set on solid, accessible ground. This helps with proper planning for roads, utilities, and other infrastructure.
Environmental Monitoring: DEM data supports environmental analysis by helping to study factors like water flow, soil erosion, and land degradation. It is vital for monitoring and mitigating environmental impacts of various projects.
Geological Surveys: With accurate elevation models, geologists can analyze the Earth’s surface for faults, landforms, and other geological features. DEM data aids in making informed decisions for exploration and hazard assessment.
There are several ways to create DEM data, especially in remote regions where ground surveys are challenging. Stereo satellite maps are often used in these areas to generate DEM models through automatic DSM extraction or photogrammetric techniques. These methods help produce accurate Digital Surface Models (DSM) or Digital Terrain Models (DTM), depending on the specific project requirements.
By using DEM data, engineers and project managers can simulate and plan field operations in a computer environment. This makes it easier to visualize the best routes and understand potential obstacles before any physical work begins. In cases where no pre-existing DEM data is available, these techniques offer a way to generate the necessary topographic data.
The resolution of DEM data is critical for determining its accuracy and usability. At XRTech Group, we offer DEM data at various resolutions, which makes it adaptable for different project needs. For example, higher-resolution DEM data is ideal for urban areas where detailed information about buildings and infrastructure is required, while lower-resolution models may be sufficient for broader, less-detailed applications in remote regions.
For optimal results, DEM data should match the project specifications and objectives. Whether it’s for urban planning, environmental monitoring, or construction, the right resolution ensures that the data provides the level of detail needed for accurate decision-making.
At XRTech Group, we pride ourselves on delivering accurate and high-quality DEM data for all types of projects. Whether you’re working on urban development, environmental monitoring, or mining exploration, our Digital Elevation Models can support your planning, design, and operational needs.
Our high-resolution orthoimages and DEM data come with the latest updates and technology, ensuring that you receive the most accurate and reliable data available. We also offer photogrammetric techniques and stereo satellite maps for generating DEM models in remote areas, making it easier to access hard-to-reach locations.
We understand the importance of accurate data in decision-making, which is why our services are designed to provide you with the clarity and precision you need. From engineering designs to geological surveys, we provide Digital Elevation Models (DEM) that ensure your projects are set up for success.
Contact us Now to Get More Details – WhatsApp
Tailings Dam Monitoring: How Advanced Satellite Intelligence Is Transforming Tailings Dam Safety Tailings dams are among the most critical—and high-risk—structures
From Visible Light to Spectral Intelligence in Modern Satellite Remote Sensing Satellite imaging has moved beyond photography. For decades, Earth