Tailings Dam Monitoring with InSAR & AI
Tailings Dam Monitoring: How Advanced Satellite Intelligence Is Transforming Tailings Dam Safety Tailings dams are among the most critical—and high-risk—structures
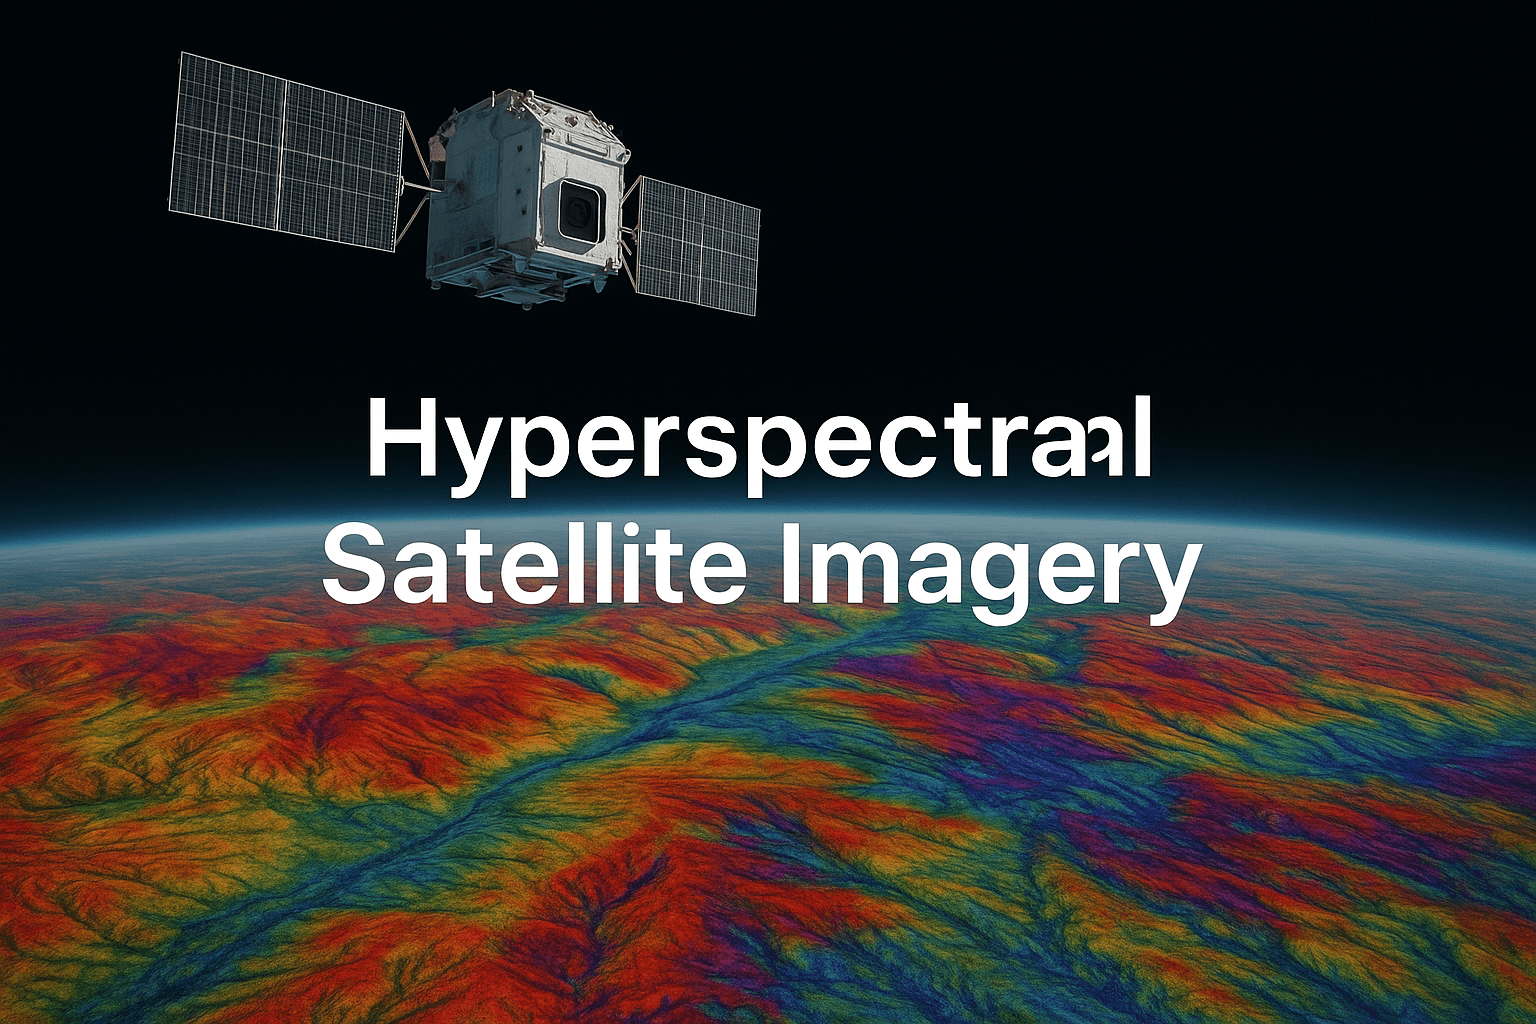
Hyperspectral imaging satellites are transforming how we observe Earth by capturing highly detailed spectral data across hundreds of narrow wavelength bands.
This advanced image technology moves far beyond traditional imaging methods like multispectral imaging, which only detect a few wide bands. Instead, hyperspectral satellites break light into many fine spectral slices, often less than 10 nanometers wide.
This unlocks a clearer view of the Earth’s surface, enabling the detection of materials based on their unique light reflection patterns, what scientists call spectral signatures.
These patterns tell us exactly what something is made of. Whether it’s a mineral deposit, a crop type, or a pollutant, each one reflects and absorbs light differently.
Satellite hyperspectral imaging captures these differences, helping us see what can’t be seen by the human eye or standard cameras. And because these satellites operate in both visible and infrared wavelengths, they give a complete spectral fingerprint of whatever they observe.
Unlike basic color imagery, which captures three bands (red, green, blue), hyperspectral image data can include over a hundred, even up to a thousand bands.
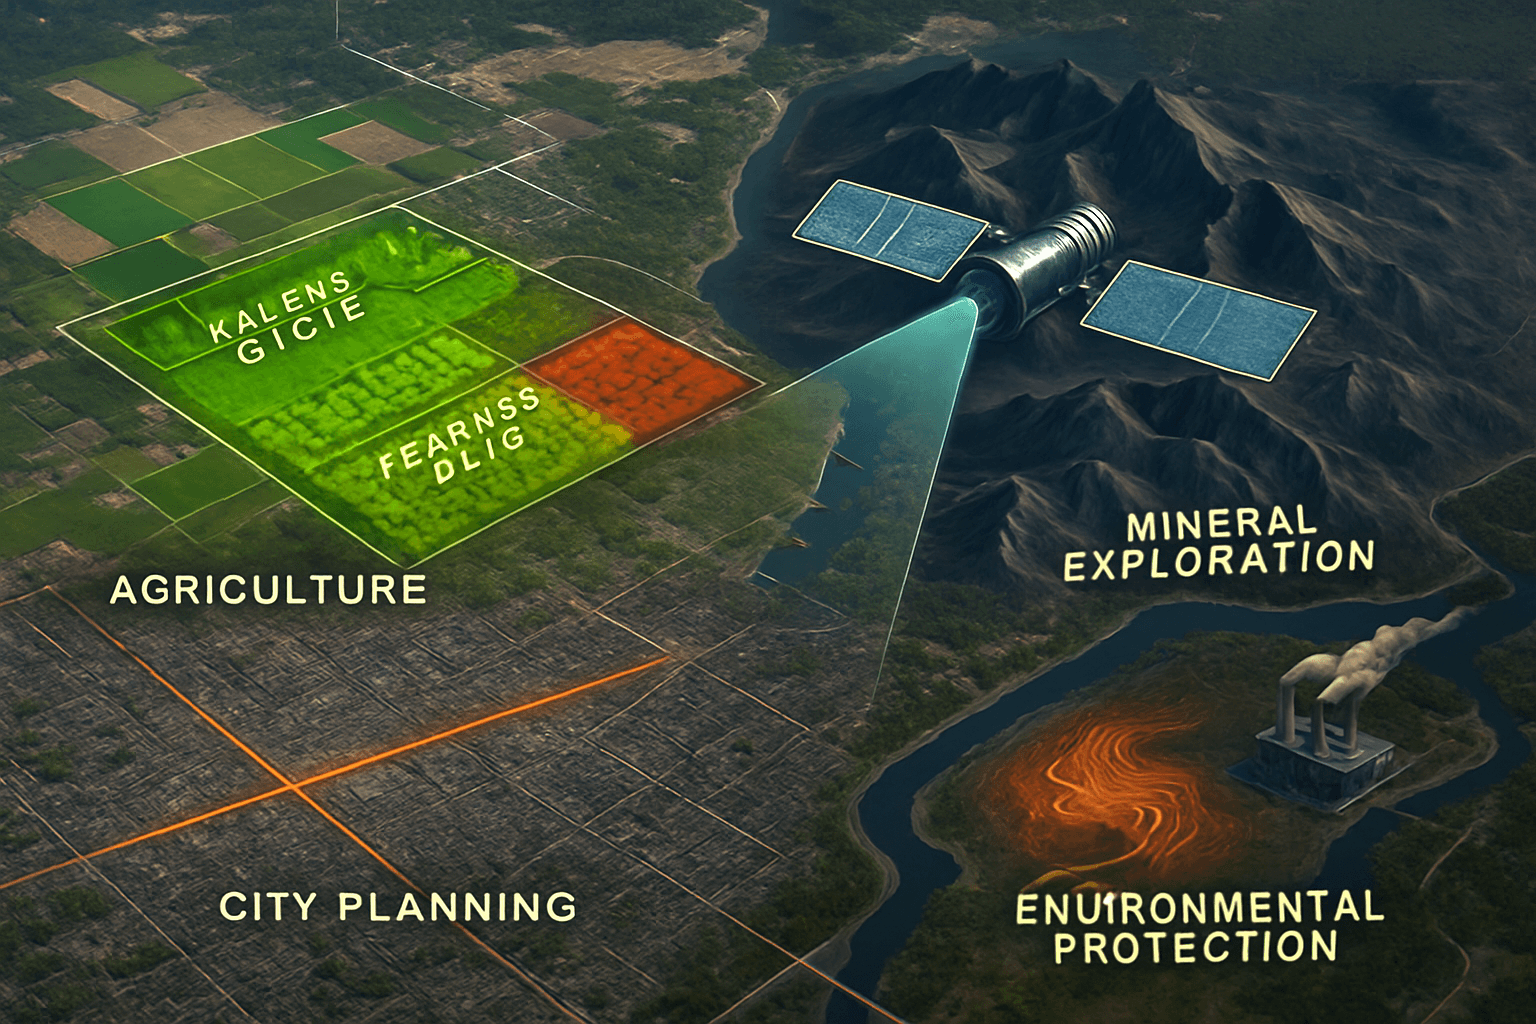
This allows XRTech Group’s imaging systems to detect the smallest chemical variations in soil, water, vegetation, and man-made materials. From outer space, hyperspectral satellites analyze surfaces with stunning precision, opening up new possibilities in resource mapping, agriculture, urban planning, defense, and environmental monitoring.
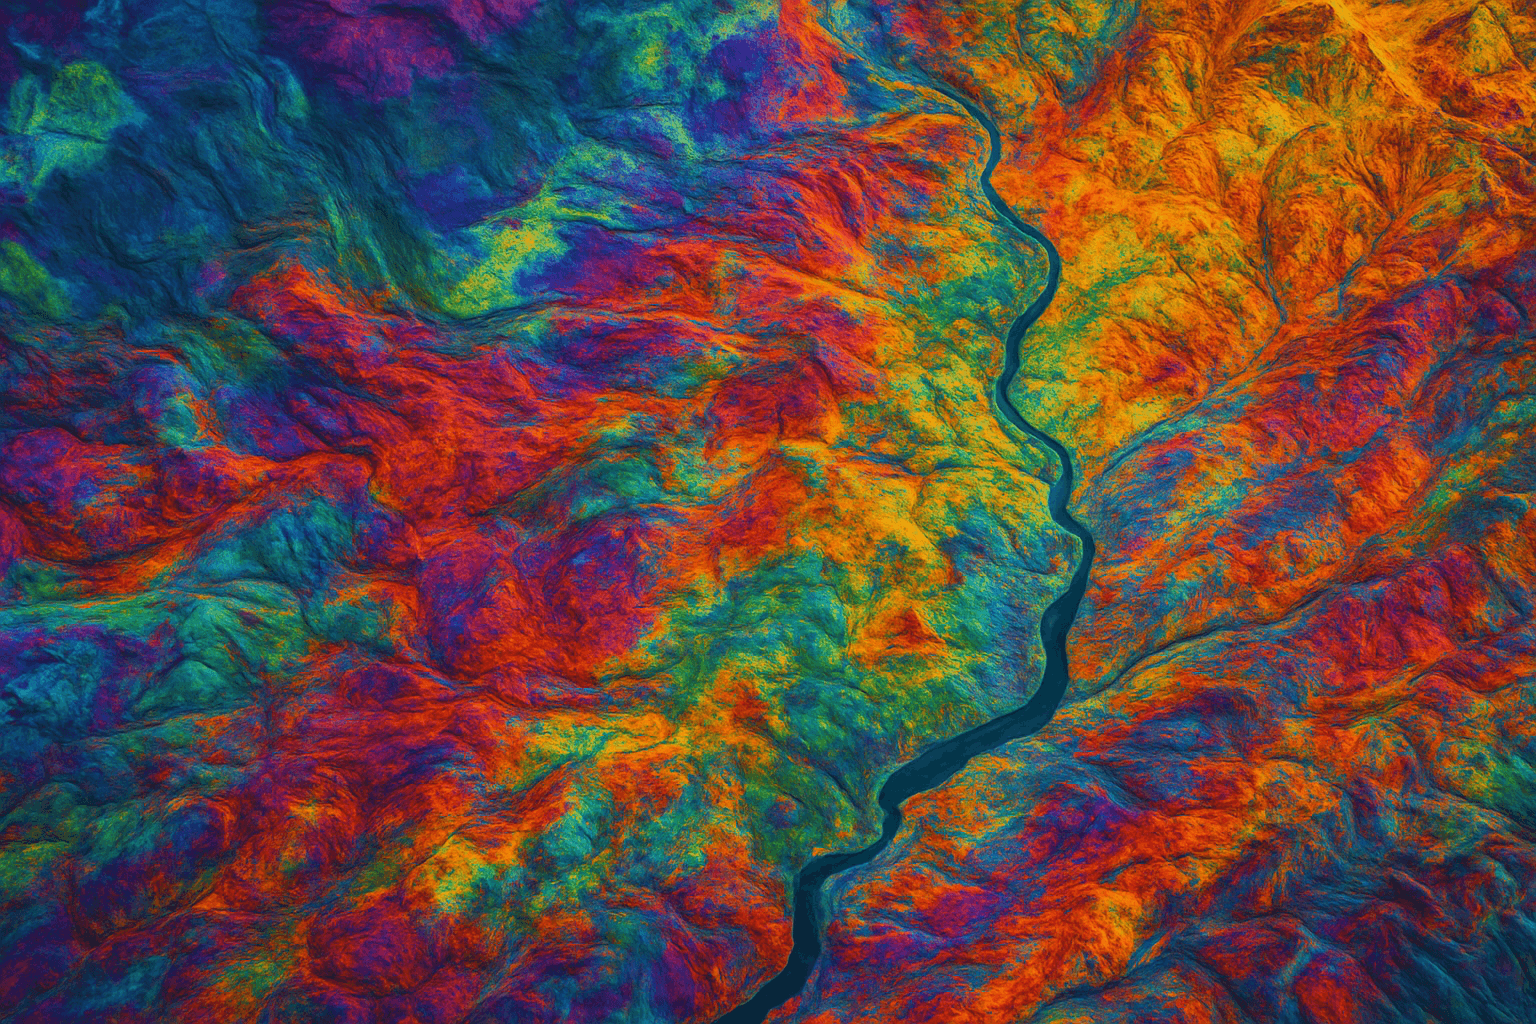
The strength of hyperspectral satellite imagery lies in its ability to extract detailed information from every pixel in an image. Each pixel isn’t just a color—it’s a full light spectrum.
That means every object, no matter how small or similar it looks to something else, can be analyzed based on its exact composition. This is not just about seeing, it’s about understanding.
Let’s consider mining. Instead of sending ground teams to search for minerals, hyperspectral imaging satellites detect the precise spectral fingerprint of each mineral from orbit. This makes exploration faster, safer, and more cost-effective.
The same applies to agriculture, these satellites can determine crop stress, nutrient levels, or disease before any visible sign appears, just by analyzing reflected light.
And in climate or pollution studies, satellite hyperspectral imaging identifies contaminants or gases invisible to the naked eye.
XRTech Group utilizes this capability to support governments and industries that require precise monitoring of environmental changes, water bodies, and even forest health.
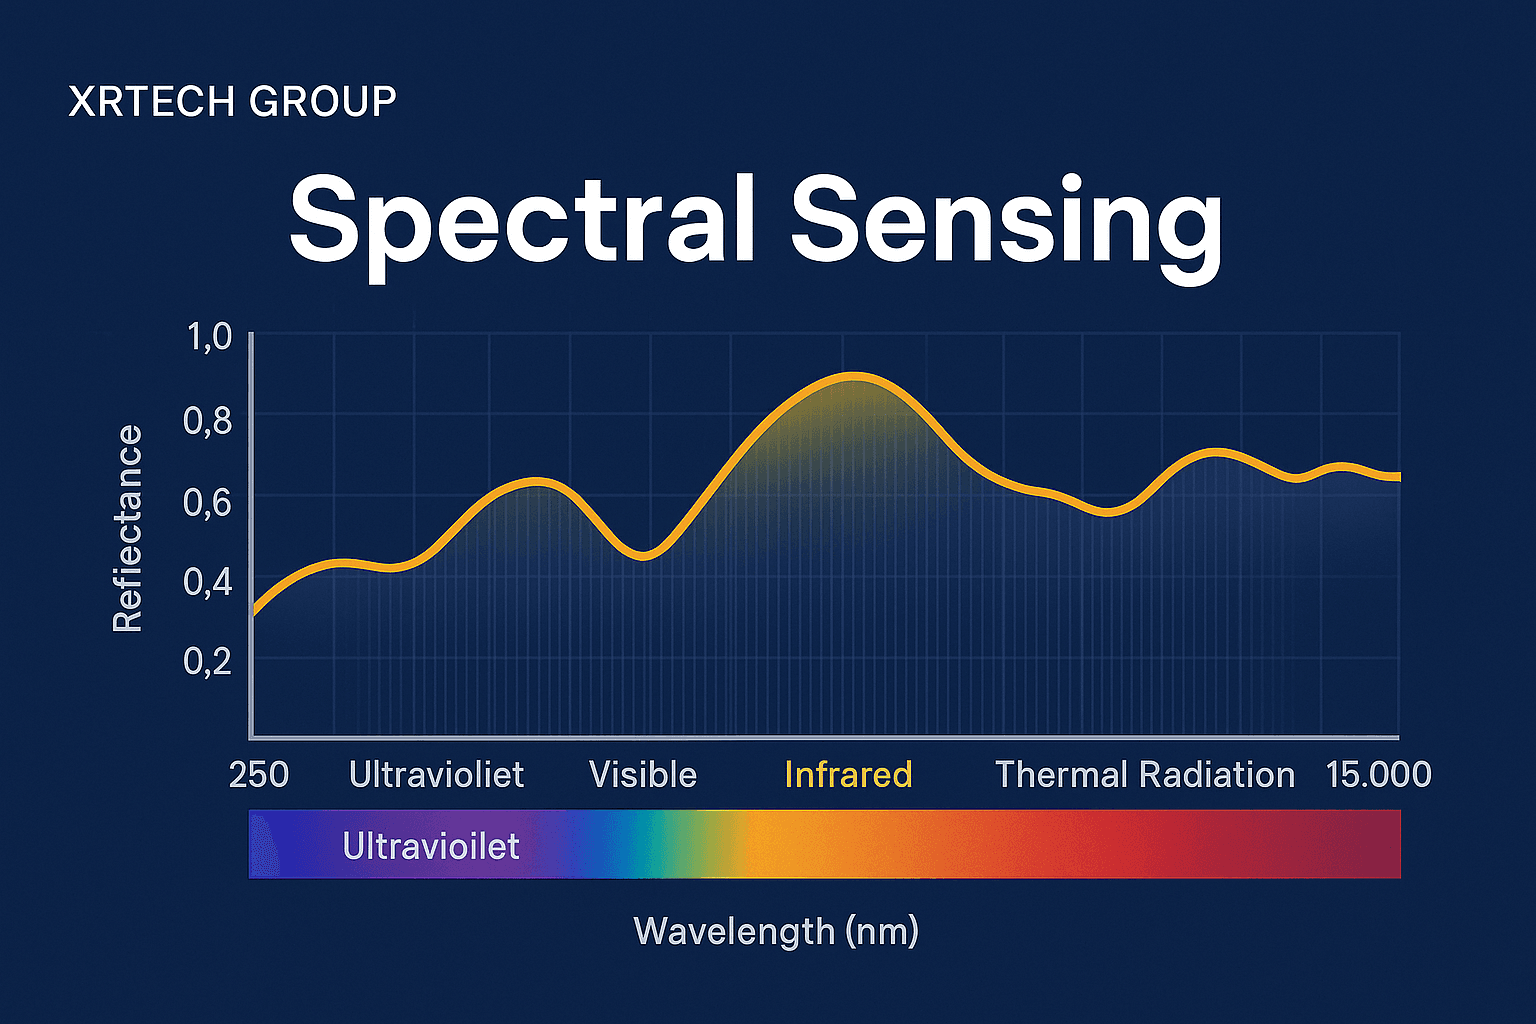
When light reflects off any object—trees, rocks, buildings, or clouds—it interacts differently depending on its material. These interactions take place across the electromagnetic spectrum, which includes not only visible light but also ultraviolet, infrared, and thermal radiation.
While most cameras and sensors pick up just a small slice of this spectrum, hyperspectral satellites record a continuous range of narrow spectral bands, typically from 250 nm to 15,000 nm.
This detailed spectral resolution allows XRTech’s systems to separate subtle differences between objects with similar colors. For example, two green leaves may look the same to the eye, but hyperspectral satellite imagery can tell if one is healthy and the other is nutrient-deficient, based on how each reflects near-infrared light.
The use of this technology is called spectral sensing, and it combines imaging with spectroscopy—the science of light interaction with matter.
With this, XRTech’s hyperspectral satellites don’t just capture pictures; we deliver material insights from every surface they see.
The role of hyperspectral satellites has expanded beyond research. These systems are now key to several industries. In agriculture, they help avoid crop failures by identifying plant diseases early. In mineral exploration, they locate rare earth elements or precious metals from space, making discovery faster and more efficient.
Textiles, paints, cars, and even rooftops all carry distinct spectral fingerprints. XRTech Group’s advanced satellite hyperspectral imaging platforms can detect and classify these materials accurately from orbit. This level of precision enables cities to plan better, companies to inspect infrastructure remotely, and environmentalists to monitor pollution sources in real time.
Every object on Earth, from a leaf to a leak in an oil pipe, has a unique spectral signature. Hyperspectral imaging satellites identify these with ease. XRTech Group is proud to be part of this future, delivering clarity, accuracy, and reliability for professionals across energy, agriculture, defense, and environmental protection.
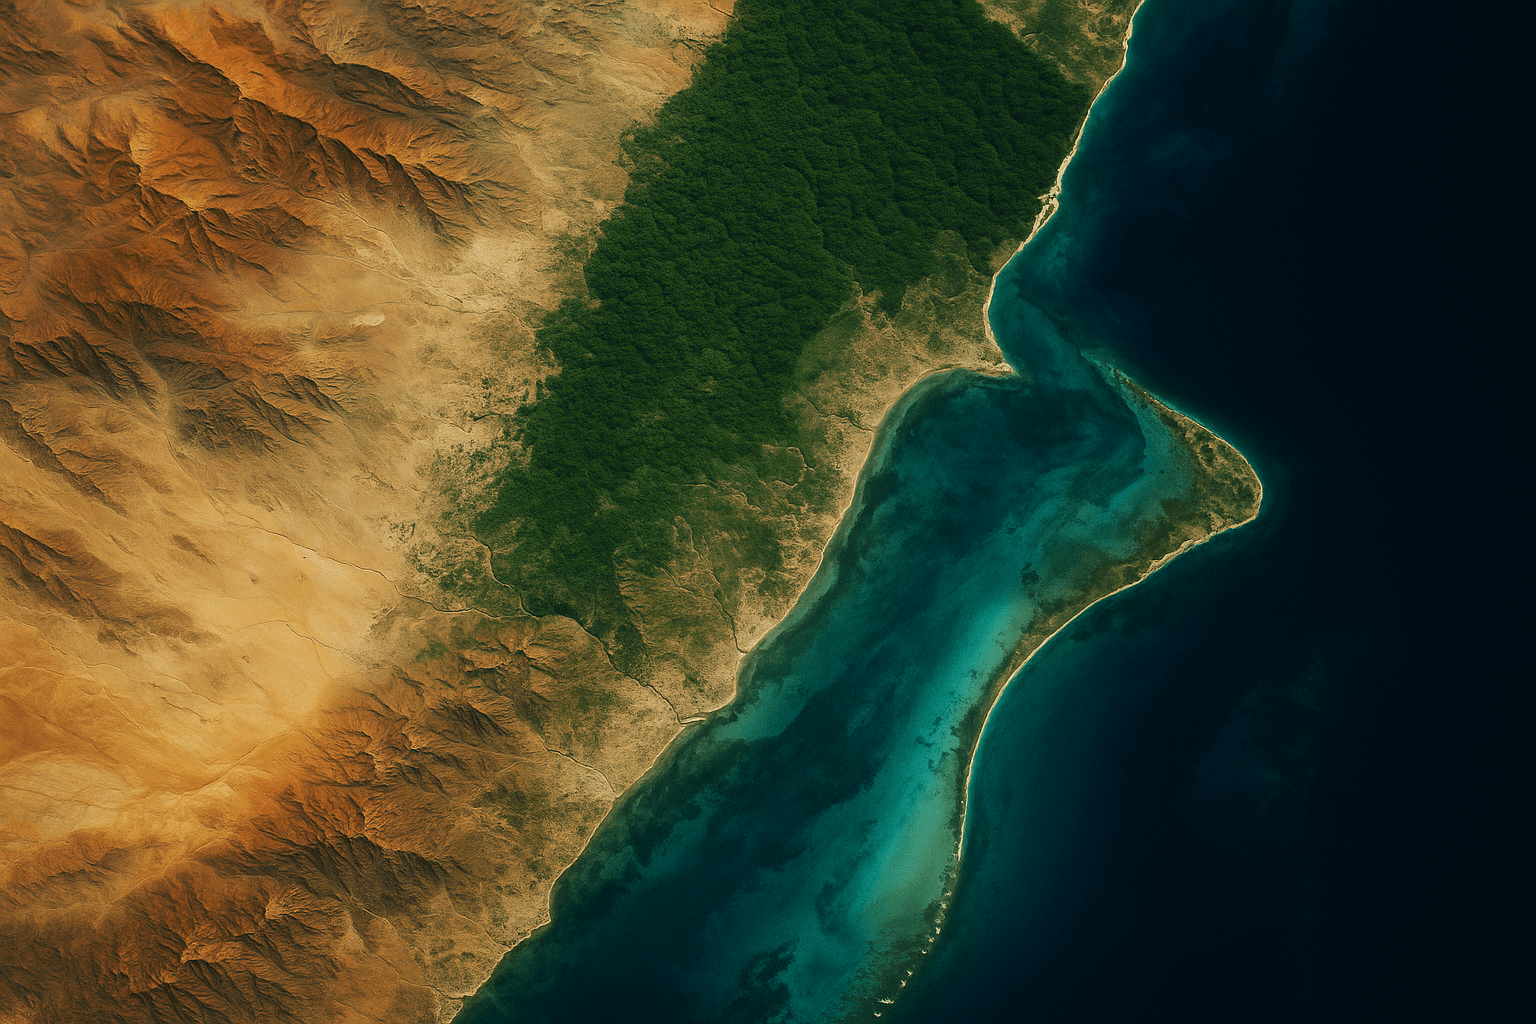
Hyperspectral imaging satellites are not just observing Earth’s surface, they are helping professionals understand its chemical and geological composition with remarkable detail. These systems are especially effective in mapping minerals, monitoring vegetation, studying water quality, and analyzing coastal ecosystems. Unlike conventional imagery that focuses on spatial detail, satellite hyperspectral imaging offers spectral detail, revealing what materials are made of rather than just what they look like.
The power of hyperspectral satellite imagery lies in its ability to detect how light reflects off different surfaces across narrow and continuous wavelength bands. Each material, be it rock, plant, or water—has a unique spectral response. These responses, also known as spectral signatures, enable accurate identification of substances from orbit, without physical contact. This makes hyperspectral satellites particularly useful in sensitive or hard-to-reach regions, such as deep forests, remote deserts, coral reefs, or environmentally protected zones.
For example, certain wavelengths in the near-infrared (NIR) or short-wave infrared (SWIR) range can indicate crop health or detect rock types. By focusing on selected parts of the electromagnetic spectrum, hyperspectral image data offers insights into things like soil moisture, vegetation stress, mineral presence, and water clarity. This data is widely used in agriculture, mining, marine research, and even in disaster risk reduction.
Each portion of the electromagnetic spectrum provides unique insights depending on the surface material being analyzed. Hyperspectral imaging satellites tune into these ranges to gather precise data. Here’s a breakdown of key spectral regions and their optimal uses:
| Spectral Region | Wavelength Range (nm) | Applications |
|---|---|---|
| Thermal Infrared (TIR) | 8000 – 15000 | Detects surface temperatures on land and water, geothermal activity, and heat emissions. |
| Infrared (IR) | 6000 – 7000 | Used for tracking water vapor, measuring soil moisture, and observing forest fires or thermal hotspots. |
| Mid-Wave Infrared (MIR) | 3000 – 5000 | Supports volcanic monitoring, sea surface temperature mapping, and mineral detection. |
| Short-Wave Infrared (SWIR) | 1100 – 3000 | Helps study vegetation structure, identify rock types, and monitor cloud dynamics. |
| Near-Infrared (NIR) | 700 – 1100 | Measures plant health, soil condition, and certain minerals. |
| Visible Spectrum | 400 – 700 | Captures true-color imagery and supports coral reef analysis, land classification, and ocean color mapping. |
| Ultraviolet (UV) | 100 – 400 | Useful in identifying pollutants, ozone levels, and sensitive coral habitats. |
Satellite hyperspectral imaging often selects specific spectral zones based on the task at hand. For example, a project focusing on vegetation health would prioritize NIR and SWIR bands, while mineral exploration might focus more on MIR and longer infrared wavelengths.
In mining and mineral exploration, hyperspectral satellites provide a valuable edge by remotely identifying mineral zones, alteration areas, and potential deposits. These insights are based on subtle spectral features that reveal the presence and condition of key minerals.
Here’s how different wavelengths help identify valuable minerals and materials:
| Wavelength (nm) | Target Mineral or Element | Significance |
|---|---|---|
| 400 – 780 | Zinc, Nickel | Indicates base metal mineralization zones. |
| 592 | Magnetite | Signals presence of iron-rich zones. |
| 674 – 800 | Goethite, Neodymium | Detects nutrient-rich areas in grasslands. |
| 400 – 1200 | Hematite, Jarosite, Limonite | Maps iron oxides and alteration areas. |
| 400 – 1100 | Manganese, Nickel Oxides | Helps distinguish between oxidation states. |
| 800 – 1000 | Olivine | Tracks olivine in volcanic and mafic rocks. |
| 1000 – 1200 | Ferrous Iron (Fe²⁺) | Key for mapping ferrous content in soils. |
| 1480 – 1485 | Aleonite | Indicator of copper-bearing mineral zones. |
| 1550 – 1750 | Carbonates (e.g., Calcite, Dolomite) | Maps carbonate-hosted rocks and alteration minerals. |
| 2100 – 2400 | Clays, Sulfates, Silicates | Identifies key alteration minerals in mining zones. |
Hyperspectral satellite imagery brings mineral mapping to a higher level by delivering precise geochemical data from orbit. This helps geologists detect early-stage deposits, analyze mineral zoning, and minimize unnecessary exploration costs. From gold to copper to rare earth elements, the insights provided by hyperspectral image cubes save time, reduce risk, and support sustainable resource extraction.
Hyperspectral imaging satellites also assist in identifying hydrothermal alterations—a critical step in locating mineral-rich areas. Spectral bands in the 1300–2500 nm range are particularly useful for this purpose. These bands detect hydration features, sulfates, and aluminum hydroxide-bearing minerals associated with hydrothermal systems.
Here are examples of key wavelengths and their geological value:
1470 – 1820 nm: Detects sulfates like alunite, useful in hydrothermal mapping.
2160 – 2240 nm: Identifies pyrophyllite, linked to alteration zones in gold exploration.
2150 – 2220 nm: Highlights kaolinite and muscovite, indicators of aluminium-bearing minerals.
2240 – 2300 nm: Detects jarosite and iron hydroxides, critical in acidic environments.
2300 – 2390 nm: Useful for magnesium-rich mineral mapping such as talc and Mg-hydroxides.
2320 – 2350 nm: Targets carbonate rocks like dolomite and calcite.
By observing how each band reacts with the Earth’s surface, hyperspectral satellite imagery reveals vital information about the chemical environment and geological evolution of a site. XRTech Group uses this approach to empower smarter, faster, and cleaner exploration.
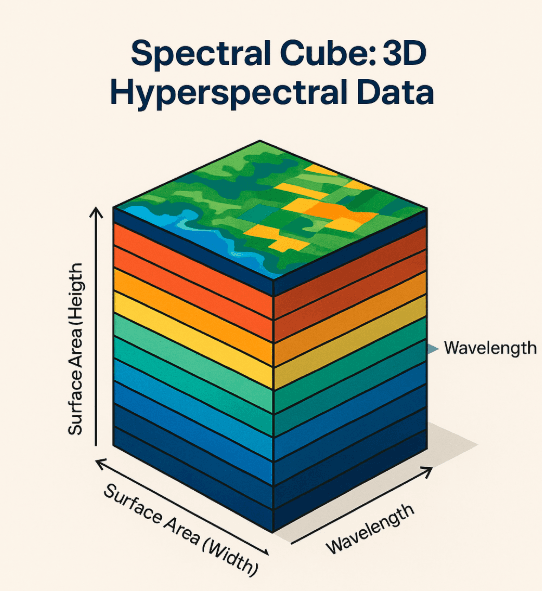
A hyperspectral image is not just a flat picture—it’s a cube. Each layer of this cube corresponds to a specific wavelength. Two dimensions represent the surface area (width and height), and the third dimension stacks hundreds of spectral bands, making it a 3D data set.
This cube-like structure, often referred to as a spectral cube, is what allows hyperspectral imaging satellites to extract information on material composition, moisture content, or vegetation type at every pixel. These cubes are created based on satellite swath widths across-track, along-track, and spectral range.
With this approach, satellite hyperspectral imaging doesn’t just take a photo—it creates a deep, data-rich profile of the scene. Every pixel tells a story, and XRTech’s hyperspectral systems are designed to read each one with unmatched accuracy.
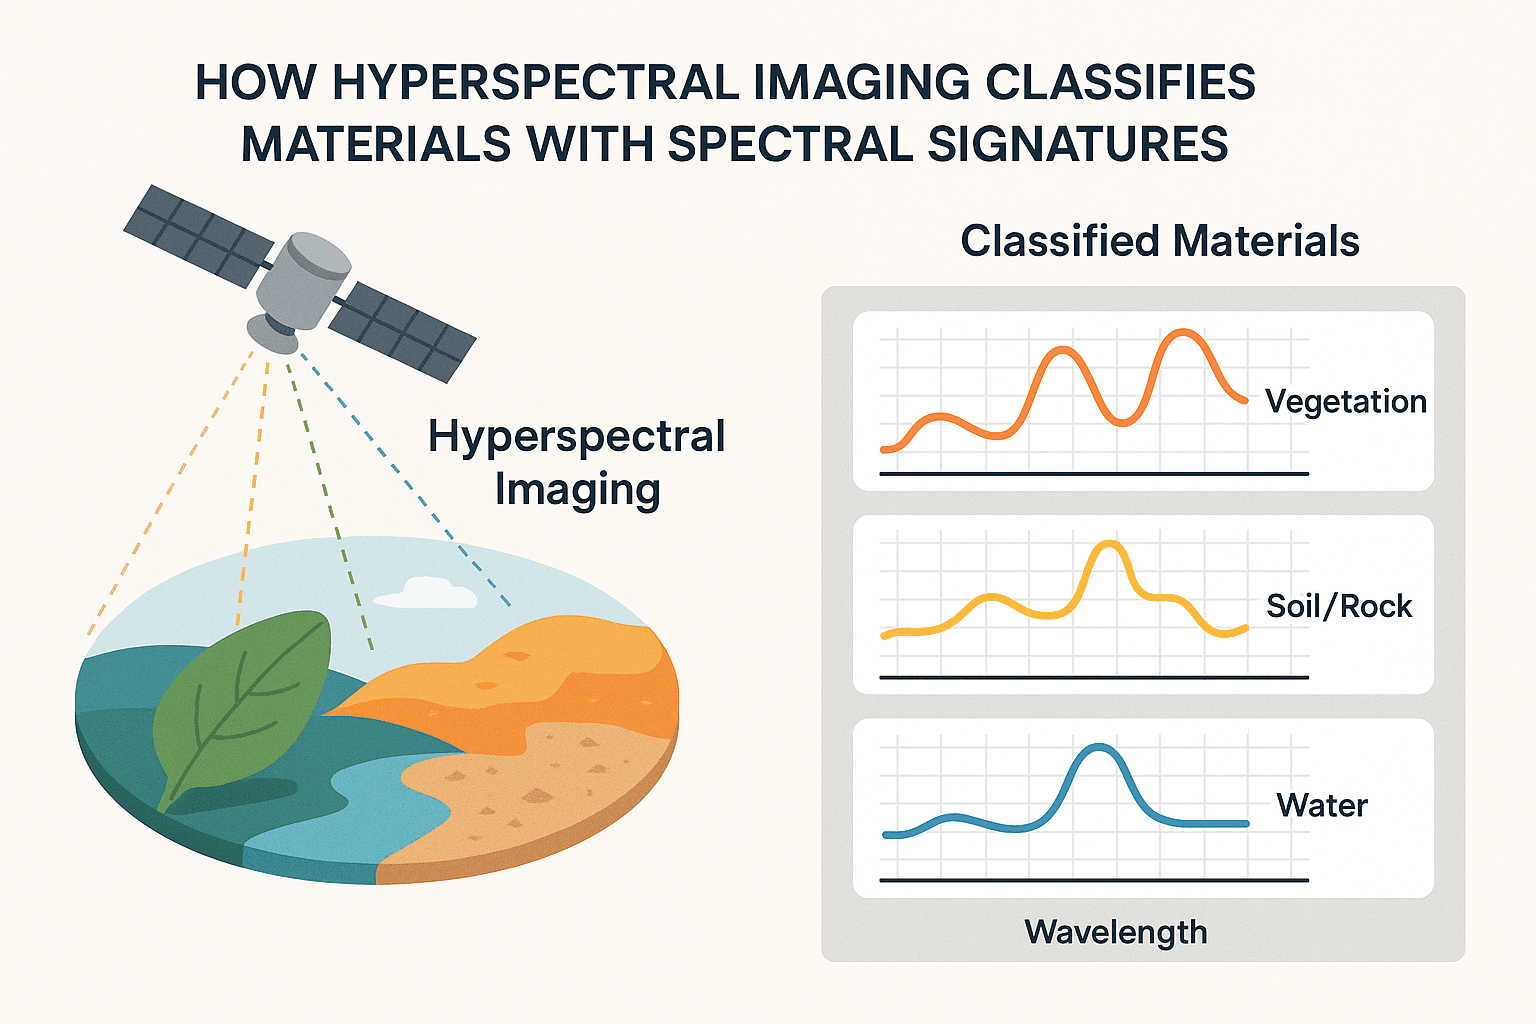
Each surface or object on Earth interacts with light in a unique way. Hyperspectral imaging satellites capture these unique interactions, known as spectral responses, across hundreds of narrow wavelengths. This information is then used to detect, identify, and classify materials based on their distinct hyperspectral image signatures.
Through the combination of digital imaging and spectroscopy, hyperspectral satellite imagery reveals both what a material is and where it is located. The spatial data shows the distribution or coverage area of the material, while the spectral data uncovers its chemical and physical properties. In this way, satellite hyperspectral imaging answers three important questions—what is present, where it is, and when it appears.
To understand the power of this method, imagine a simple photo of a green leaf. A standard RGB camera only captures three color bands—red, green, and blue—similar to a brief pamphlet. On the other hand, a hyperspectral image of the same leaf records hundreds of spectral bands, each offering detailed insights into its internal structure and health. This is more like a full reference book, providing layers of scientific information invisible to normal cameras.
One of the major strengths of hyperspectral imaging satellites lies in their ability to collect data at very high spectral and spatial resolution. This enables incredibly accurate identification and separation of materials that may look nearly identical to the naked eye. Because hyperspectral satellite imagery captures hundreds of thousands of individual spectra across a single scene, every pixel in the image becomes a source of deep material information.
This forms what’s called a hyperspectral data cube—a three-dimensional dataset containing not just position and light wavelength, but also time-based changes. In essence, this data cube provides a rich layer of information that is essential for scientific analysis, industrial inspection, and environmental monitoring.
Compared to multispectral systems that offer limited band coverage, hyperspectral satellite systems allow for much finer analysis. Subtle differences between similar materials—such as two types of minerals, or healthy vs. stressed crops—can be clearly distinguished. This leads to smarter decisions and more targeted actions in industries that depend on precision data.
In recent years, hyperspectral satellite imaging has become a trusted tool across multiple fields—ranging from scientific research and agriculture to manufacturing, mining, and defense. Its non-invasive nature, combined with the ability to reveal hidden details, makes it invaluable for remote inspections, quality control, and environmental studies.
For example, hyperspectral imaging satellites are used in agriculture to track crop health, detect pests or diseases, and assess soil conditions. Mounted on drones or collected via satellite, this data helps farmers optimize irrigation, fertilizer usage, and harvest planning. This directly improves yield and reduces waste.
In mining, hyperspectral satellite imagery identifies mineral-rich zones and alteration halos without the need for ground drilling, saving time and resources. Meanwhile, industries like food production use hyperspectral image systems to inspect ingredients and detect foreign objects in real-time, ensuring product safety and consistency.
Some additional applications include:
Environmental monitoring: Tracking land cover changes, detecting pollution, and assessing water quality with high accuracy.
Waste management: Improving recycling processes by automatically separating materials with high purity.
Quality assurance: Supporting non-destructive product inspections in pharmaceutical and food industries.
Military and defense: Locating hidden materials, detecting camouflage, and analyzing hazardous substances remotely.
Because hyperspectral satellites can detect what traditional systems cannot, this technology is helping industries reduce errors, increase output quality, and make data-driven decisions faster than ever before.
| Parameter | RGB Imaging | Multispectral Imaging | Hyperspectral Imaging Satellites |
|---|---|---|---|
| Type / Number of Bands | 3 Bands (Red, Green, Blue) | 4–15 Bands | 37–100+ Narrow Bands |
| Bandwidth (FWHM) | ~50–70 nm | ~15–35 nm | <10 nm |
| Wavelength Range | 450–700 nm (Visible Spectrum) 🔹 Blue: 450–500 nm 🔹 Green: 520–560 nm 🔹 Red: 635–700 nm | 400–1000 nm (Visible to NIR) | 400–2500 nm (Visible to SWIR) |
| Mineral Identification | Basic surface features only | Detects major rock types and surface minerals | Precisely identifies specific minerals using unique spectral signatures |
| Ore Grade Estimation | Not applicable | Suitable for rough ore estimation | High-resolution mapping for detailed ore quality assessment |
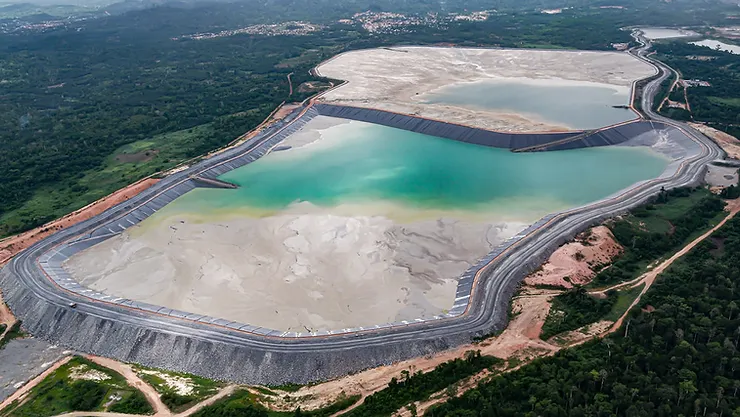
| Waste Management / Tailings | Not effective | General monitoring of large-scale changes | Tracks composition, stability, and contamination with high precision |
| Environmental Impact Assessment | Limited | Identifies major pollutants | Early detection of heavy metals, chemical leachates, and vegetation degradation |
| Land Rehabilitation Monitoring | Only visible changes | Measures basic vegetation and land cover changes | Detailed soil recovery and biodiversity assessment post-mining |
| Water Contamination Detection | Not effective | Detects surface color changes | Early detection of water pollution, chemical spills, and pH variations |
| Energy Efficiency / Resource Optimization | Not applicable | Broad view of resource allocation | Pinpoints inefficiencies in energy use and resource management |
At XRTech Group, we deliver high-resolution hyperspectral satellite imagery that transforms the way industries explore, monitor, and manage natural and built environments. Our advanced imaging solutions combine hyperspectral data from our own systems with insights from leading global satellites like GF-5B and ZY-1 02D/02E, providing unmatched clarity and depth across hundreds of spectral bands.
GF-5B and ZY-1 02D/02E are among the world’s most advanced hyperspectral imaging satellites, capturing critical environmental and industrial data at high spectral and spatial resolution.
Launched: September 7, 2021
Altitude & Orbit: 705 km, sun-synchronous
Spectral Range: 0.40–2.50 μm across 318–330 bands
Spectral Resolution: ≤5nm (VNIR), ≤10nm (SWIR)
Spatial Resolution: 30m; Swath Width: 60km
Viewing Angle: ±25° off-nadir
Applications: Ideal for atmospheric composition detection, mining, water monitoring, and climate research
Launched: 2019 (02D), 2021 (02E)
Altitude & Orbit: 778 km, sun-synchronous
Spectral Range: 0.40–2.50 μm with 76 VNIR + 90 SWIR channels
Spectral Resolution: 10nm (VNIR), 20nm (SWIR)
Spatial Resolution: 30m; Swath Width: 60km
Applications: Designed for long-term, high-frequency monitoring in land use, agriculture, urban planning, forestry, and disaster response
These satellites enhance the capabilities of XRTech’s hyperspectral imaging solutions, giving clients access to timely, precise, and context-rich data from space. Whether detecting subtle vegetation stress, identifying mineral compositions, or tracking urban sprawl, these systems provide vital inputs for decision-making.
Our satellite hyperspectral imaging technology enables businesses and governments to address complex challenges through science-backed, actionable insights:
Pinpoint mineral deposits and plan exploration more effectively by identifying hydrothermal alteration zones, iron oxides, and carbonate-host rocks with high confidence.
Track vegetation degradation, monitor protected ecosystems, and analyze habitat changes in real-time for mining, forestry, and conservation projects.
Detect early signs of chemical spills, tailings leaks, soil contamination, and water quality issues—enabling rapid response and regulatory compliance.
Support post-mining land rehabilitation with long-term monitoring of turbidity, acidity, and toxic elements across wide areas. Enable proactive site risk management.
Monitor crop health, soil nutrients, and disease outbreaks using near-infrared bands. Optimize harvest cycles and reduce chemical use for sustainable farming.
Utilize GF-5B hyperspectral data to analyze greenhouse gases, detect aerosols, and evaluate water turbidity and nutrient levels from space.
Support smart urban development, transportation planning, and early warning systems for floods, landslides, and wildfires using wide-field hyperspectral satellite coverage.
Unlike traditional imagery, which may only show what something looks like, hyperspectral data shows what something is made of. Think of it as replacing a simple photograph with a chemical fingerprint. This means:
You don’t just see “green fields”—you identify chlorophyll content, moisture levels, and plant stress.
You don’t just see “rocks”—you detect hematite, kaolinite, or carbonate minerals with confidence.
You don’t just monitor “air quality”—you measure specific gas concentrations, like CO₂ or SO₂, across industrial zones.
This detailed data leads to better exploration, faster decision-making, and reduced environmental and operational risk.
At XRTech Group, we simplify access to powerful hyperspectral satellite imagery by integrating data from global sources like GF-5B and ZY-1 02D/02E into one solution—tailored for your business.
Whether you’re in mining, environmental science, agriculture, or urban development, our hyperspectral analytics platform helps you visualize the invisible and act with certainty.
Ready to elevate your insight?
Let XRTech Group help you grow your business with real data from space—precise, proven, and future-ready. Call us Now! Or Learn More Here.
A hyperspectral imaging satellite is a type of Earth observation satellite that captures data across hundreds of narrow wavelength bands. This technology allows it to detect and classify objects based on their unique spectral signatures, offering more detail than traditional imaging systems.
Hyperspectral satellites use sensors that measure the reflected sunlight or emitted energy from the Earth’s surface across many spectral bands. This results in a hyperspectral data cube that includes spatial, spectral, and temporal information, useful for identifying materials or changes on the ground.
The main difference is the number and width of bands. Hyperspectral imaging satellites capture hundreds of very narrow bands, while multispectral satellites collect fewer and broader bands. Hyperspectral systems offer higher spectral resolution, making them ideal for material identification and precise analysis.
Hyperspectral satellites provide rich data that helps identify subtle differences in materials, vegetation, minerals, or pollution. Their high spectral and spatial resolution allows accurate monitoring of environmental changes, crop health, water quality, and land surface composition.
Hyperspectral satellite applications include environmental monitoring, precision agriculture, mineral exploration, military surveillance, forestry, water quality analysis, and disaster management. These satellites are especially useful in detecting hidden or subtle material features invisible to the naked eye.
Yes, hyperspectral satellites are widely used in precision agriculture. They help monitor crop health, soil moisture, nutrient levels, and detect early signs of disease or stress. This data supports smarter farming and better yield prediction.
Hyperspectral data is highly accurate due to its fine spectral resolution. This allows detection of specific chemical compositions and detailed material classification. However, accuracy depends on satellite calibration, atmospheric correction, and ground validation.
Industries that benefit include agriculture, mining, defense, oil & gas, waste management, and environmental science. Hyperspectral imaging satellites help these industries monitor resources, detect contamination, and optimize operations with real-time or periodic insights.
Yes, several private and government organizations now operate commercial hyperspectral satellites. These include missions from the Indian Space Research Organisation (ISRO), NASA’s EO-1 (Hyperion), and newer companies launching mini and cube satellites for specialized hyperspectral imaging.
As environmental and resource challenges grow, hyperspectral imaging satellites offer precise and scalable monitoring of Earth systems. Their data helps support sustainability, improve decision-making, and advance scientific research in areas where detailed spectral information is critical.
Tailings Dam Monitoring: How Advanced Satellite Intelligence Is Transforming Tailings Dam Safety Tailings dams are among the most critical—and high-risk—structures
From Visible Light to Spectral Intelligence in Modern Satellite Remote Sensing Satellite imaging has moved beyond photography. For decades, Earth