
Smart city intelligence from space
Satellite Imagery for Urban Planning & Infrastructure Monitoring
Sub-meter optical imagery, 3D elevation models, millimeter-level InSAR deformation tracking and AI urban analytics from 130+ satellites. Plan smarter cities, catch unauthorized construction early and protect critical infrastructure, with analysis-ready data delivered in days.
Trusted by municipal authorities, urban planners and engineering firms across the Middle East, Asia, Africa and worldwide.
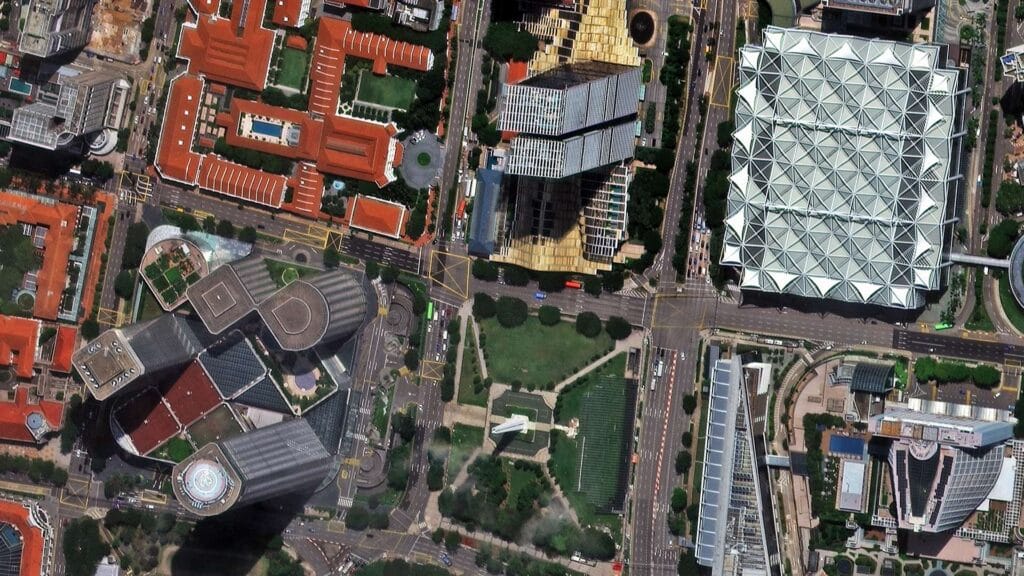
Raffles City, Singapore. SuperView Neo-1, 30 cm
Archive and fresh tasking
130+
Optical, SAR and stereo satellites
30 cm
Sub-meter optical resolution
1 to 2 mm
InSAR deformation accuracy
Under 7 days
Typical delivery, no export license delays
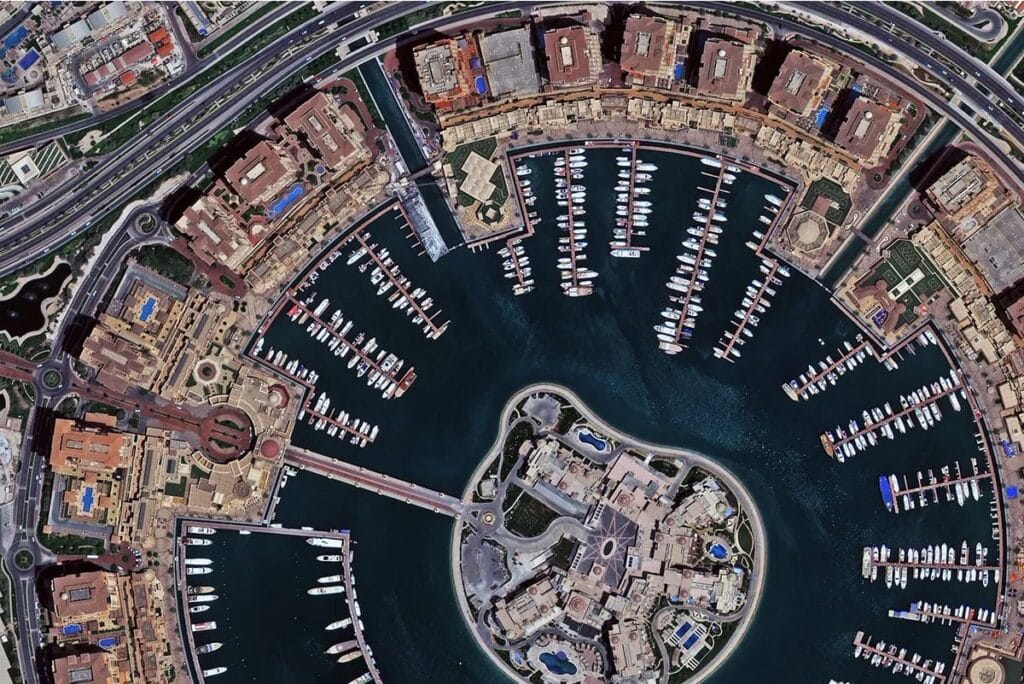
Doha, Qatar. SuperView NEO-1, 30 cm
Buildings, roads and vehicles visible
Urban insights
What is satellite imagery for urban planning?
Satellite imagery for urban planning is high-resolution Earth observation data used to map, measure and monitor cities. Planners and engineers use it to see how a city is growing, check new construction against zoning plans, measure ground movement under roads and bridges, and replace outdated aerial basemaps with fresh orthophotos. Ground surveys are slow and costly to scale; one satellite pass covers an entire metropolitan area.
Urban expansion and sprawl analysis
Land-use classification and zoning checks
Road, rail and infrastructure monitoring
Construction progress tracking
Change detection and trend analysis
Why XRTech
Why urban planners and governments trust XRTech
We deliver more than pictures from space. You get the accuracy, speed and licensing flexibility that real-world city planning and infrastructure projects need.
Vast satellite access
130+ optical, SAR and stereo satellites, so you are never tied to a single vendor's revisit schedule.
Fast data delivery
Analysis-ready imagery in under 7 days, with no U.S. export licensing delays slowing your project down.
0.3 m to 2 m resolution
Inspect individual structures, utility corridors and transport networks with sub-meter clarity.
AI-driven urban analytics
Automated building extraction, change detection and land-use segmentation turn imagery into decisions.
Flexible licensing
Archive and new tasking options with project-wide, team-friendly licensing and no hidden fees.
Seamless GIS and CAD integration
Delivered as GeoTIFF, SHP, DWG and more, in WGS84, UTM or your custom municipal projection.
Why satellite imagery matters
Key urban challenges solved by satellite remote sensing
Traditional ground surveys are slow, costly and hard to scale across expanding metropolitan boundaries. High-resolution Earth observation solves the pain points that hold city development back.
Rapid urbanization and uncontrolled sprawl
Monitor municipal expansion in near real time to enforce zoning and prevent unguided growth.
Unauthorized construction and encroachment
Spot illegal building activity, unapproved land conversion and parcel violations early through scheduled revisits.
Hidden infrastructure hazards
Detect ground subsidence and structural stress in bridges, tunnels and dense districts before failure occurs.
Outdated mapping basemaps
Replace obsolete aerial photos with sub-meter orthophotos (DOM) refreshed daily, monthly or quarterly.
Environmental impact
Track green cover, water bodies, heat islands and pollution as the city grows.
Manual survey delays
Automated, large-area mapping replaces weeks of fieldwork with data you can use in days.
Core capabilities
Urban planning use cases for satellite imagery
From master planning to structural safety, high-resolution satellite data supports every stage of urban development and infrastructure management.
01. Digital twins
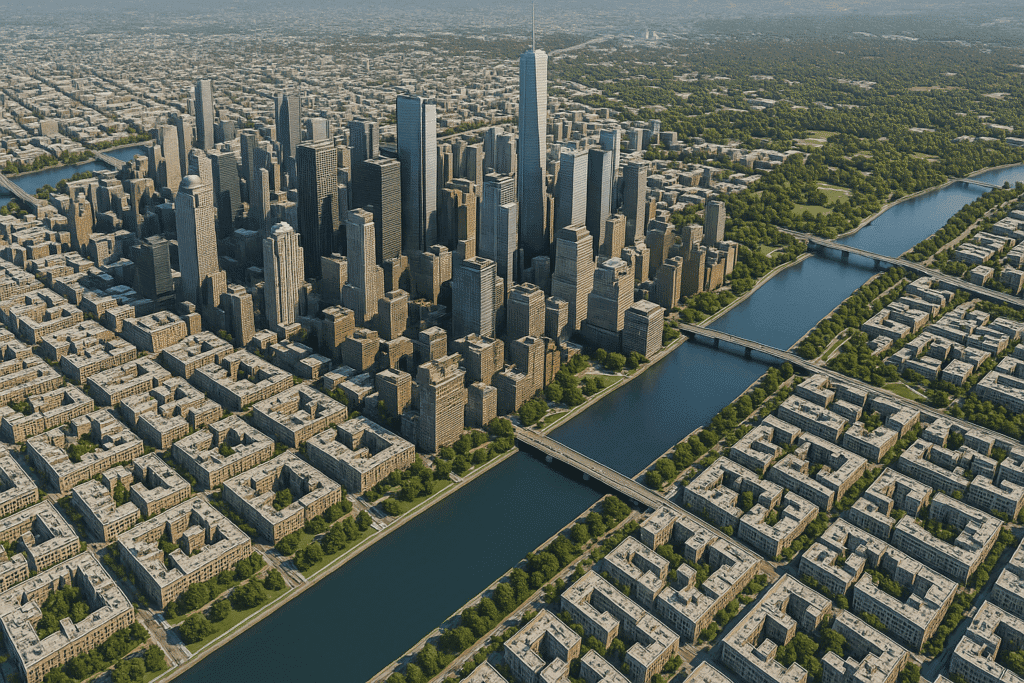
Digital twins and 3D urban mapping
Turn optical stereo imagery into 3D city models for master planning, scenario simulation and digital twin platforms.
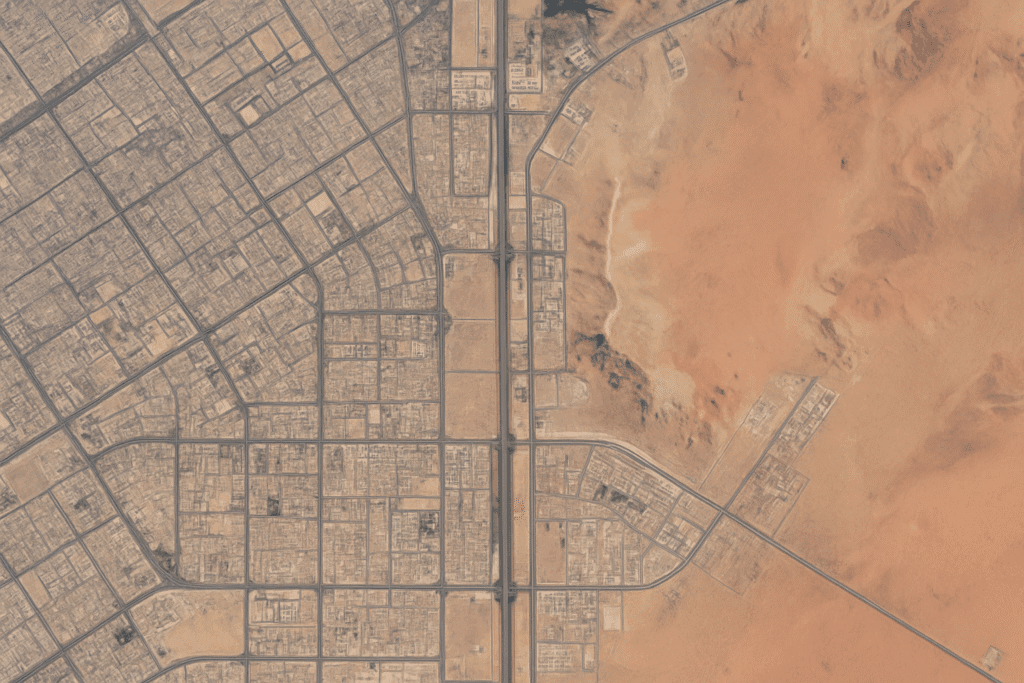
AI building contour extraction: deep learning extracts, regularizes and separates adjacent building footprints.
Building height calculation: contour pairing across stereo pairs measures roof elevations and building volumes.
Building white models: clean 3D box models with accurate heights, the base layer for smart city and smart park platforms.
02. Infrastructure safety
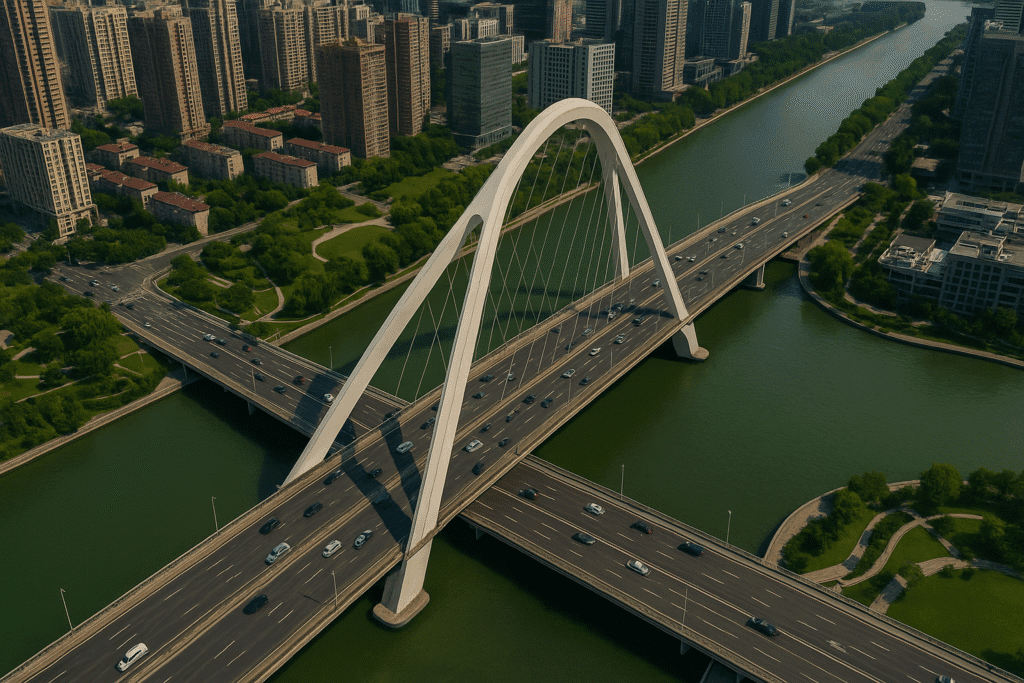
Smart infrastructure and InSAR deformation monitoring
Interferometric Synthetic Aperture Radar (InSAR) protects civil infrastructure through its whole operating life.
Millimeter-level sensitivity: measures ground and structural movement to 1 to 2 mm on bridges, highways, rail corridors and high-rise foundations.
All-weather inspections: C-band and L-band radar sees through cloud, fog, monsoon and darkness for uninterrupted oversight.
03. Growth and zoning
Urban growth, zoning and land use regulation
Keep full oversight of spatial development and land compliance across your jurisdiction.
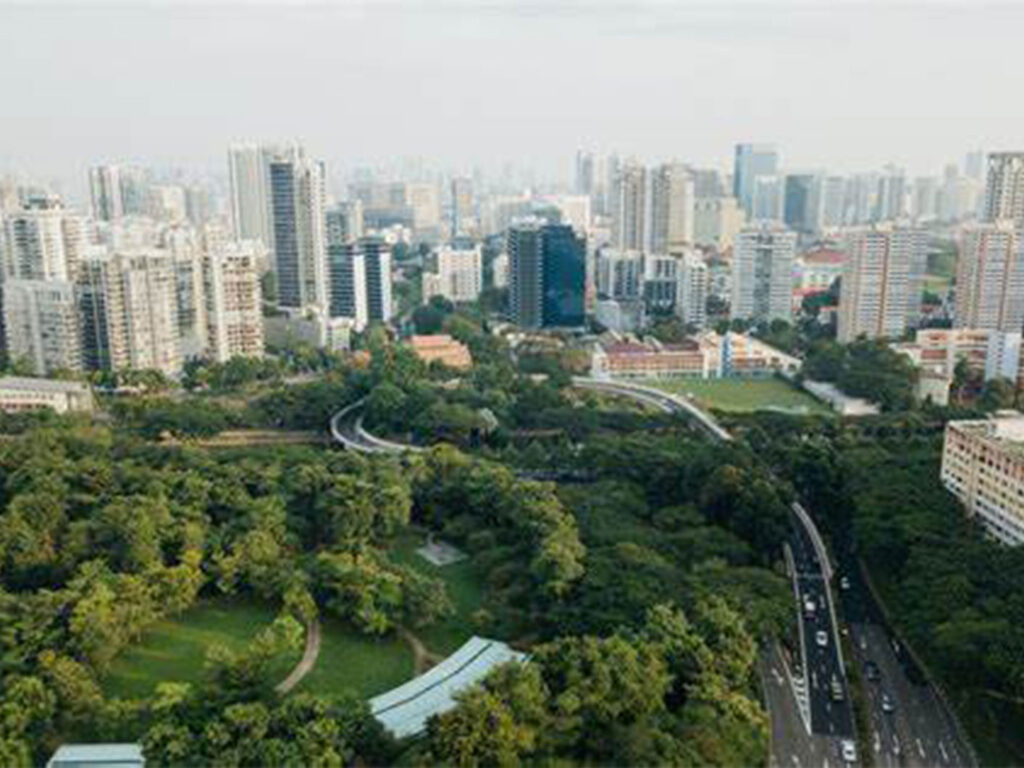
Automated change detection: AI segmentation flags encroachments, unauthorized building extensions and illegal land filling.
Master plan enforcement: compare what is actually built against your municipal “One Map” spatial planning baseline.
04. Environment
Urban environmental and micro-climate monitoring
Support sustainability goals, green infrastructure and public health compliance with measurable data.
Air and water quality: multispectral and hyperspectral imagery measures aerosol pollution, turbidity and eutrophication in city lakes and reservoirs.
Green canopy and heat islands: map park distribution, vegetation vigor (NDVI) and surface temperature hot spots.
Satellite urban intelligence matrix
Which technology fits each urban application?
Every urban module is matched to the right sensor and deliverable, so you only pay for the data your project needs.
Ask which module fits your projectApplication module
Key technology and deliverables
3D digital twins and white modeling
Optical stereo, AI building contour extraction
Smart infrastructure safety
InSAR deformation tracking, 1 to 2 mm accuracy
Land use and expansion control
Automated AI change detection and segmentation
Urban environmental quality
Multispectral air, water and heat island maps
Asset inspection and utilities
VHR optical (0.3 m) orthophotos and DOM
Construction progress tracking
Scheduled revisits and time-series change analytics
Satellite imagery portal
Search and buy city imagery in our online portal
Draw your city boundary, compare archive scenes and request new tasking in one place. Filter by date, resolution and cloud cover, then check out without the email back-and-forth.
Archive imagery back to 1999
Build historical baselines and measure how your city has changed.
Fresh tasking requests
Schedule new optical or SAR captures for live monitoring programs.
Upload KML, KMZ or SHP
Bring your municipal boundaries straight in and get instant coverage.
Search a city or draw your area of interest
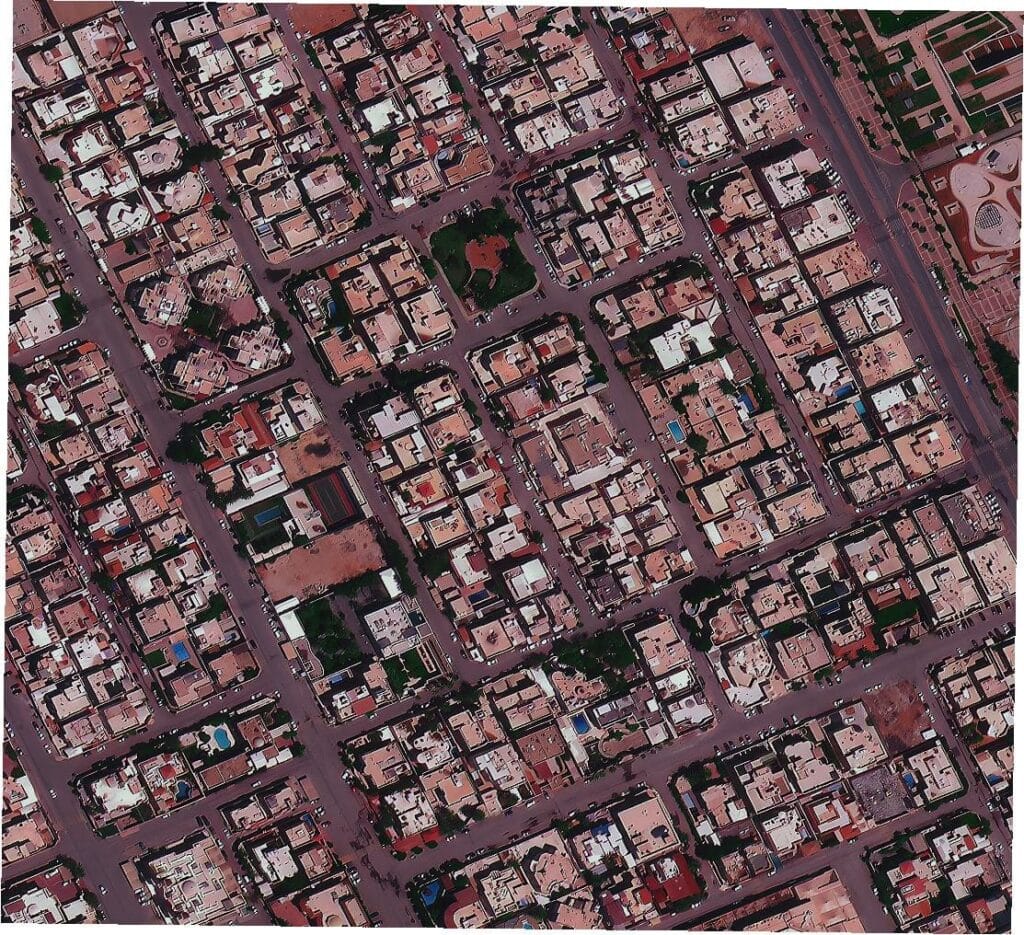
SuperView Neo-1, 30 cm
Archive, cloud 1%, 25 km² min
LT-1 L-band InSAR, 3 m
New tasking, all-weather
Technical specifications
Technical specs and satellite fleet capabilities
Our imagery and value-added products are delivered in industry-standard formats, ready to drop into your GIS, CAD and modeling workflows.
Request the full spec sheetOptical resolution
0.25 to 0.3 m (SuperView Neo-1, BJ3N), 0.42 to 0.5 m (SuperView-1/2, Beijing-3A), 0.65 to 0.8 m (GF-7, GF-2)
Radar (SAR) resolution
1 m (GF-3 C-band Spotlight), 3 m (LT-1 L-band InSAR)
Spectral bands
Panchromatic, RGB, NIR1/NIR2, plus Purple (400 to 450 nm), Yellow (590 to 630 nm) and Red Edge (690 to 770 nm)
Elevation models
DEM, DSM and DTM at 2 to 10 m grid spacing, ±3 m vertical RMSE
Orthophotos (DOM)
Orthorectified imagery at 50 cm with 8 m CE90 precision
File formats
GeoTIFF, SHP, DWG, IMG, OSGB, OBJ, 3D Tiles
Coordinate projections
WGS84, UTM or custom local municipal projections
Delivery
Secure cloud platform (1.5 h response, 1 h cloud processing) or physical HDD
Licensing
Project-wide, team-friendly and publication-friendly licensing
Value-added products
More than imagery: AI and 3D urban analytics
Custom DEM and DSM datasets, 3D building white models and AI contour extraction delivered in under 21 days.
Digital orthophoto maps
Geometrically corrected, georeferenced imagery that works as an accurate city basemap.
Surface and elevation models
Terrain and surface data for drainage design, flood modeling and engineering.
3D city and white models
Building models with accurate heights for digital twins and line-of-sight analysis.
AI building contour extraction
Automated building footprints, ready for cadastre updates and permit checks.
Land use and land cover classification
Classified maps that support zoning, green space and development strategy.
Terrain and slope analysis
Slope and aspect layers that speed up site selection and infrastructure design.
Proven success stories
How cities are using XRTech satellite imagery
Governments, planners and engineering firms rely on our data for critical urban development and infrastructure programs.
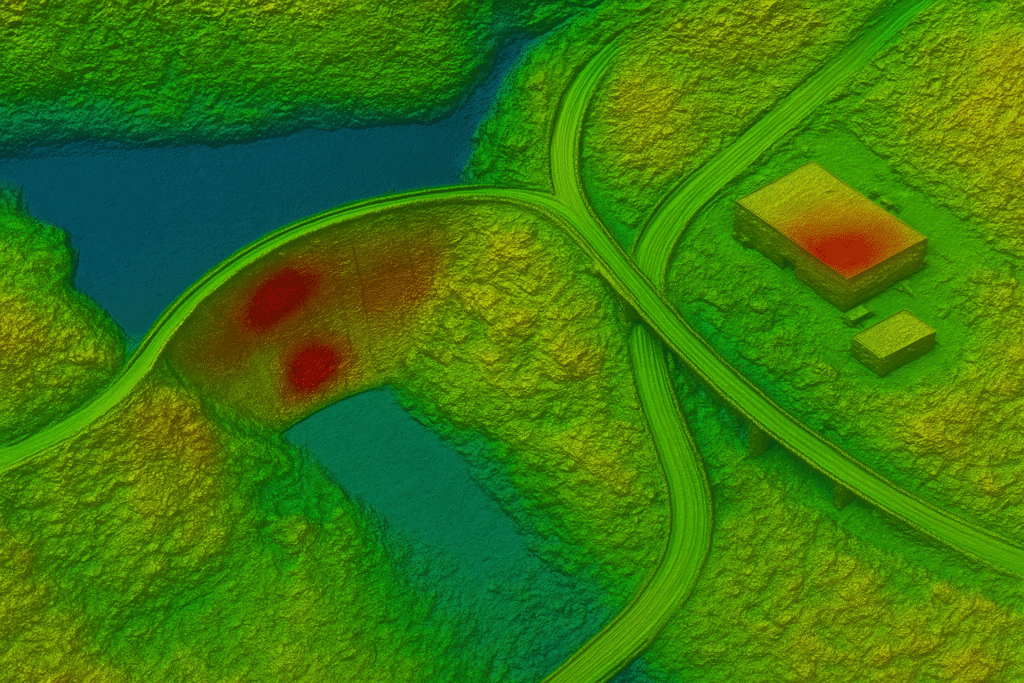
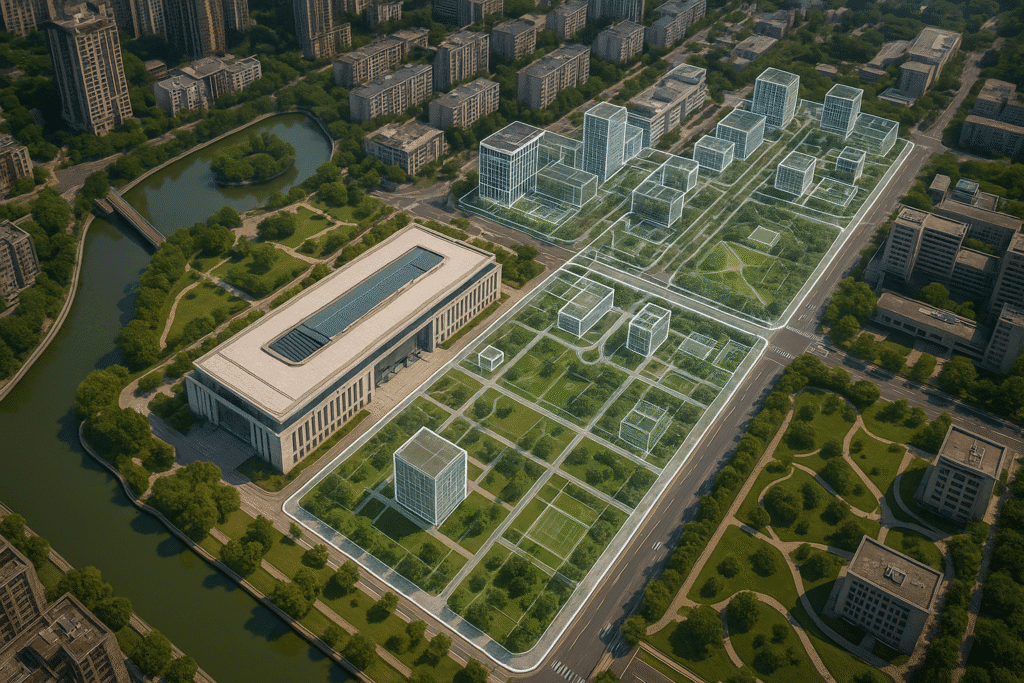
Beijing, China
Infrastructure deformation monitoring
Challenge: hidden subsidence across a vast urban transport network.
Delivered: periodic InSAR deformation tracking that identified subtle bridge and pavement subsidence for long-term structural safety.
Asia
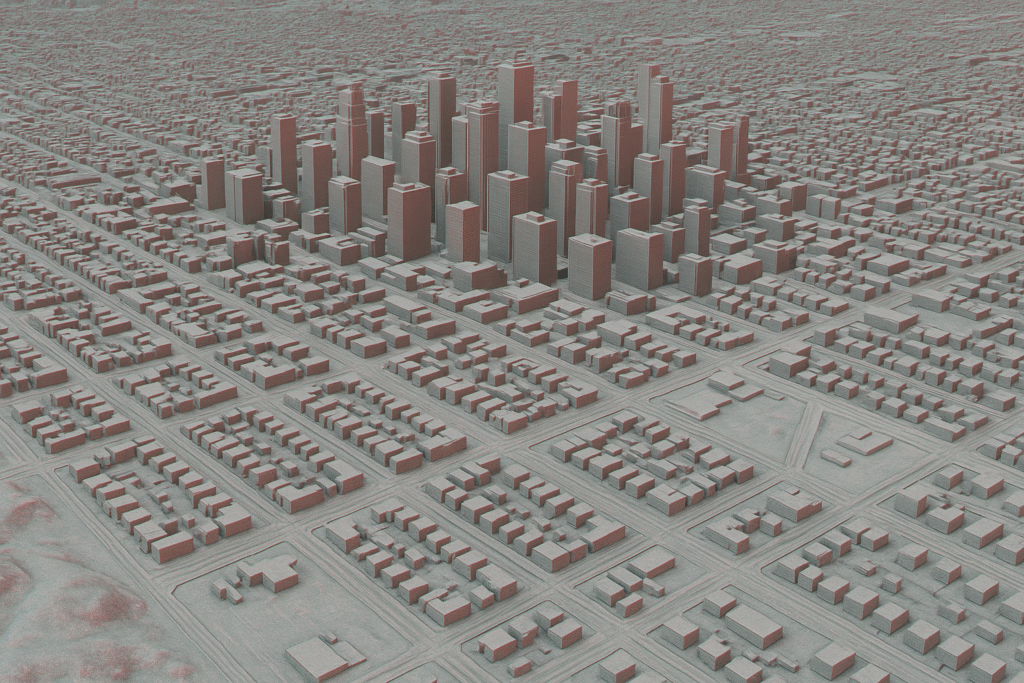
Smart city digital twins
Challenge: guide master planning and disaster resilience in fast-growing hubs.
Delivered: high-resolution 3D city models, building white models and digital twins for planning teams.
Abu Dhabi, UAE
Flood-ready master planning
Challenge: evaluate storm drainage capacity before extreme rainfall events.
Delivered: stereo-derived DEMs and 3D urban basemaps to simulate surface runoff and design flood-resilient infrastructure.
MENA region
Urban expansion control
Challenge: track growth boundaries across rapidly expanding desert cities.
Delivered: automated change detection that flags unauthorized construction and supports zoning enforcement.
What our clients say
Trusted by mapping agencies and planners
“Others said 3 weeks. XRTech delivered high-res imagery in 4 days, exactly when we needed it.”
National Mapping Lead, Africa
“We received high-resolution satellite imagery 2x faster than other major vendors.”
Infrastructure Planner, Asia
“Clear licensing, human support and fast turnaround. Finally.”
NGO Partner, MENA
Transparent pricing
Satellite imagery pricing for urban projects
Flexible pricing tailored to your project scope, with no hidden fees and no export license delays. Prices in USD per km².
Super high resolution
30 cm
Panchromatic + 4 bands
Archive (90+ days)
$20 / km²
Minimum 25 km²
New tasking
$30 / km²
Minimum 100 km²
Very high resolution
50 cm
Up to 4 or 8 bands
Archive (90+ days)
$13 / km²
Minimum 25 km²
New tasking
$20 to $22 / km²
Minimum 100 km²
High resolution
Under 1 m
Panchromatic + 4 bands
Archive (90+ days)
$5 / km²
Minimum 25 km²
New tasking
$8 to $10 / km²
Minimum 100 km²
Wide swath
2 m
Multispectral
Archive (90+ days)
$1 / km²
Flexible minimum
New tasking
$2 / km²
Flexible minimum
Stereo and tri-stereo: stereo coverage is priced at 2x mono, tri-stereo mapping at 3x mono.
Value-added products: DEM/DSM, 3D white models and AI contour extraction delivered in under 21 days.
Licensing: flexible, team-wide collaborative licensing. Band availability varies by satellite.
Archive vs tasking
Archived or fresh satellite tasking: you choose
Use archive imagery back to 1999 for fast, low-cost baselines, or task a new capture when you need current data over your exact area.
Archive imagery
Best for baselines and history
Base map creation for urban planning
Historical change analysis and infrastructure tracking
Visual identification of buildings and land features
Single-use reports and presentations
New tasking
Best for current and repeat monitoring
The dates you need are not in the archive
You need better coverage of your area of interest
Archive resolution is not sharp enough
Regular revisits for construction or zoning monitoring
Specific bands: panchromatic, NIR, red edge, purple or yellow
How to order
A simple 4-step ordering workflow
Submit your area of interest
Send your project boundary as KML, KMZ, SHP or coordinates.
Choose resolution and analytics
Pick 0.3 m to 2 m, optical or SAR, plus DEM, InSAR or AI building layers.
Archive or fresh tasking
Use archives back to 1999 for change analysis, or task new captures.
Fast delivery and integration
Get GeoTIFF, DWG or 3D files by secure cloud in under 7 days (under 21 days for full 3D DEMs).
FAQ
Satellite imagery for urban planning: frequently asked questions
Can't find your answer? Ask our geospatial team about your city or infrastructure project.
Ask an expert
What resolution is best for urban planning projects?
Very high-resolution imagery of 0.3 m to 0.5 m is recommended for most urban planning work. It shows individual buildings, road markings, utility corridors and land features clearly enough for precise planning, permit checks and zoning enforcement. 1 m to 2 m imagery is cost-effective for city-wide land use and growth monitoring.
How is satellite imagery used in urban planning?
Planners use satellite imagery to map urban expansion, classify land use, update basemaps, detect unauthorized construction, track construction progress, build 3D city models and digital twins, and monitor infrastructure such as roads, bridges and rail for ground movement.
What is InSAR and how does it monitor infrastructure?
InSAR (Interferometric Synthetic Aperture Radar) compares radar images of the same area over time to measure ground and structural movement with 1 to 2 mm accuracy. Because radar sees through cloud and darkness, it gives reliable, all-weather monitoring of bridges, highways, tunnels, dams and building foundations.
Can I use this imagery for zoning or infrastructure reports?
Yes. Imagery is delivered in industry-standard formats such as GeoTIFF, SHP and DWG, fully compatible with GIS and CAD software, and our project-wide licensing covers official documentation, reports and presentations.
How fast can I get tasking imagery delivered?
New tasking imagery is usually delivered in under 7 days, even for large or remote areas, thanks to our 130+ satellite constellation. Full 3D DEM products are delivered in under 21 days.
How much does satellite imagery for urban planning cost?
Archive imagery starts at $1 per km² for 2 m wide-swath data, $5 per km² for sub-meter imagery, $13 per km² for 50 cm and $20 per km² for 30 cm. New tasking costs more and has a 100 km² minimum. Stereo is priced at 2x mono and tri-stereo at 3x.
Do you provide orthorectified or DEM-ready imagery?
Yes. All imagery can be delivered orthorectified and analysis-ready, and we produce DEM, DSM and DTM products at 2 to 10 m grid spacing with ±3 m vertical RMSE, plus 50 cm orthophotos (DOM) with 8 m CE90 precision.
What are the licensing terms for shared team use?
Our licensing is flexible and project-wide, designed for collaborative teams, with no restrictions on internal sharing or reporting across your organization.
Ready to plan smarter
Plan the city with better intelligence
Tell us about your city or infrastructure project. Our experts will help you choose the right imagery, resolution and analytics, and send a quote fast.
x