Tailings Dam Monitoring with InSAR & AI
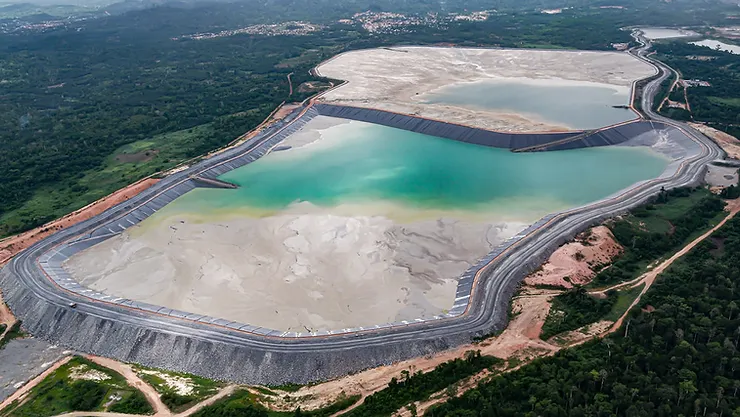
Tailings Dam Monitoring: How Advanced Satellite Intelligence Is Transforming Tailings Dam Safety Tailings dams are among the most critical—and high-risk—structures
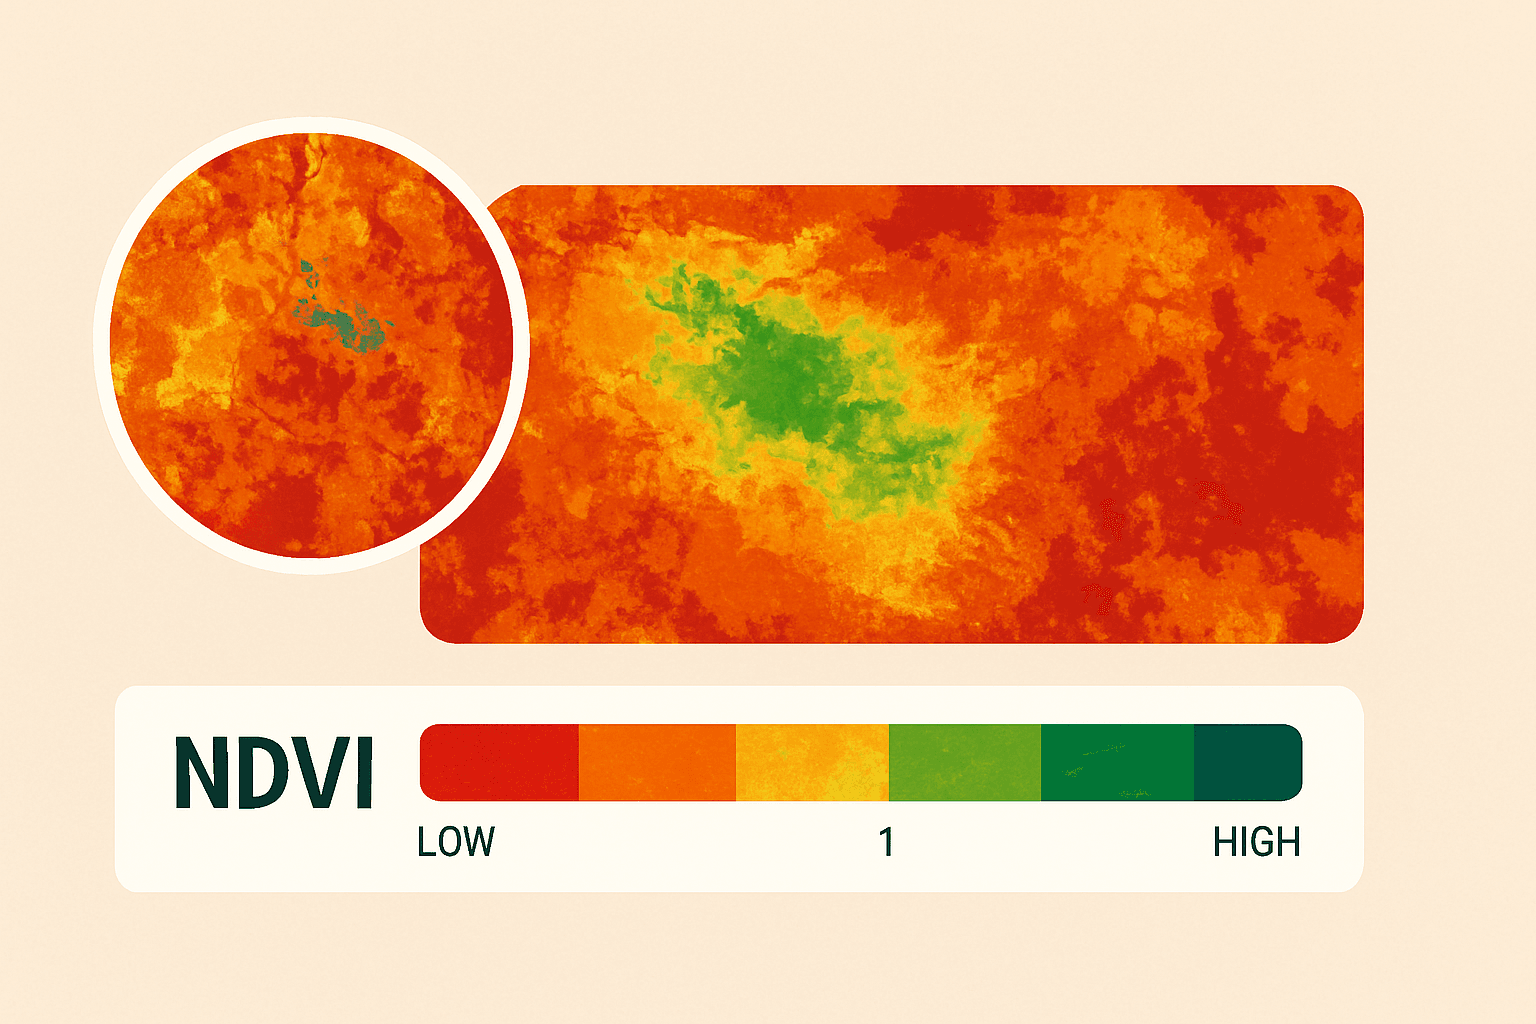
NDVI, or Normalized Difference Vegetation Index, is a trusted method to measure how green and healthy plants are in any given area.
By analyzing data from NDVI images captured through satellite or drone sensors, NDVI helps identify vegetation patterns and health across landscapes.
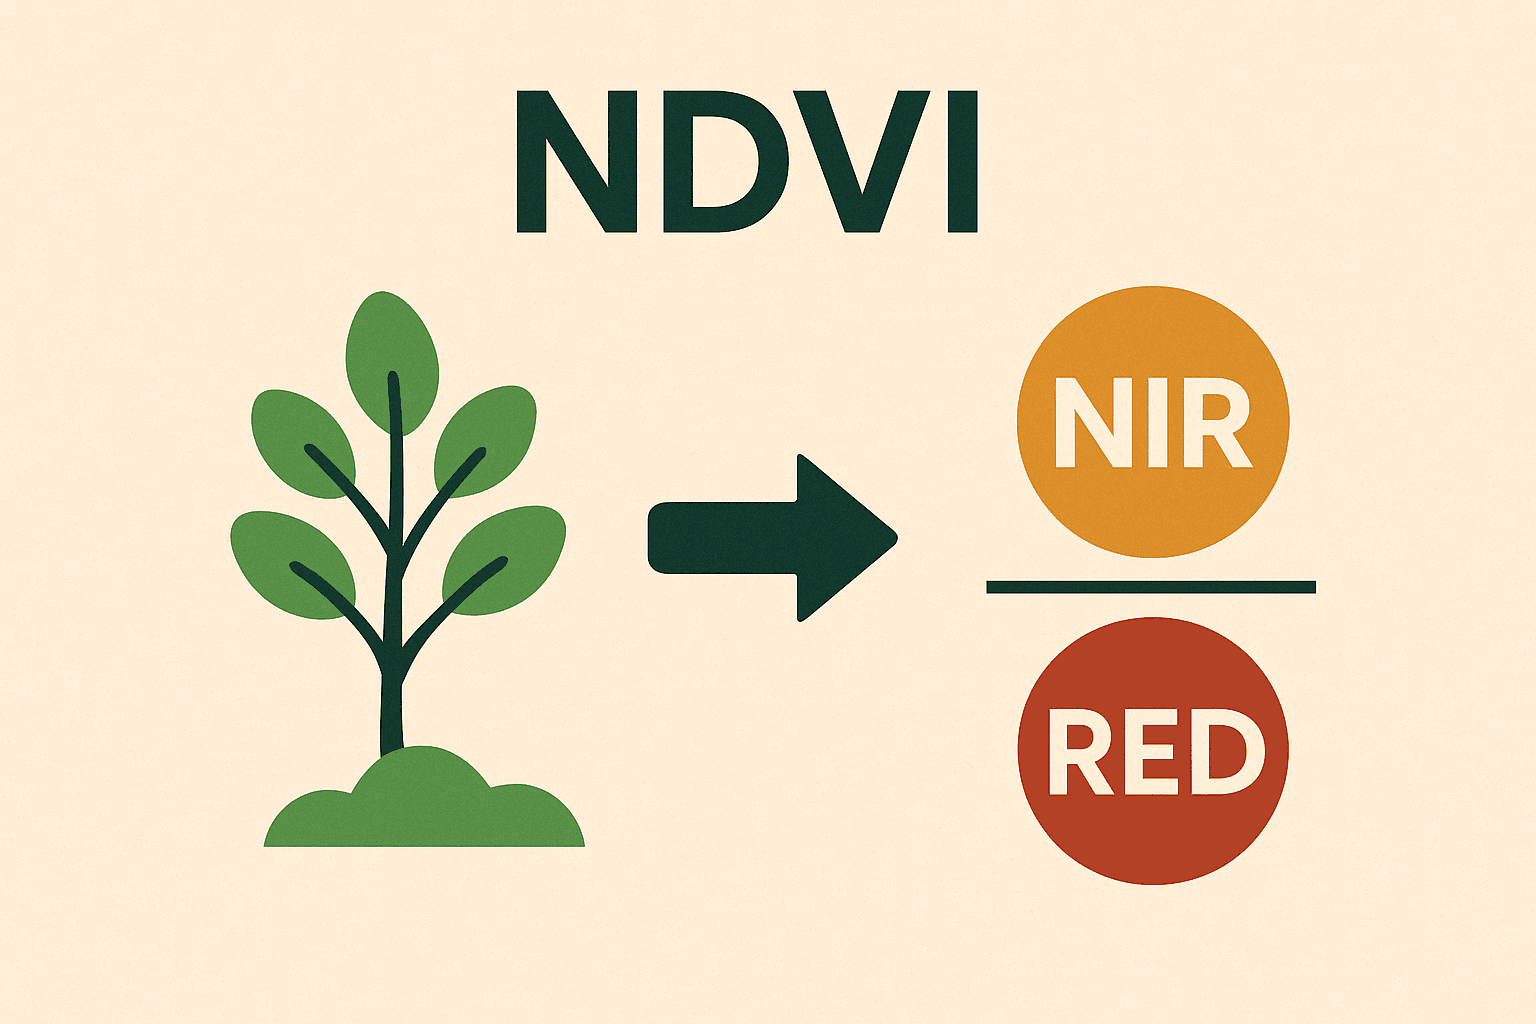
The NDVI formula uses light reflected from the Earth—specifically red and near-infrared (NIR) wavelengths—to determine how lush or barren a region is.
NDVI formula values always range between -1 and +1. A value near +1 usually indicates vibrant, dense vegetation like forests or actively growing crops.
In contrast, values closer to 0 suggest areas with little or no plant life, such as cities or rocky terrain. If the NDVI image displays values near -1, that often means the surface is water, snow, or cloud-covered, as these do not reflect light like plants do.
When interpreting an NDVI image, it’s important to understand that not every value clearly separates one type of land from another.
For example, a lightly vegetated field and a recently burned area might show similar NDVI readings. Still, the consistency of this tool across time and regions is what makes NDVI one of the most widely used indexes in remote sensing today.
With NDVI, Earth scientists, farmers, environmental researchers, and drone professionals can calculate NDVI easily and see vegetation health visually using color gradients.
This kind of information supports everything from precision agriculture to global climate research.
NDVI is not just a number—it’s a vital part of understanding how plants and landscapes behave over time. Whether tracking crop growth, mapping forests, or observing climate change, NDVI images provide actionable insights.
NDVI is sensitive to how plants reflect light, especially red and near-infrared. Healthy plants absorb more red light and reflect more NIR, producing higher NDVI values. Unhealthy or stressed vegetation, like drought-affected crops or disease-stricken leaves, reflect more red light and less NIR, which lowers the NDVI score. This makes NDVI image interpretation an early warning signal for plant health.
In modern agriculture, calculate NDVI tools have transformed the way farmers manage their land. From adjusting irrigation to targeting fertilizer use only where it’s needed, NDVI images guide decisions that improve yield and reduce waste. Farmers using this data can monitor plant stress early, improving overall crop productivity while conserving resources.
NDVI is also widely used in tracking environmental changes. Governments, conservation groups, and scientists rely on NDVI images to monitor deforestation, land degradation, and urban expansion. This long-term data supports land-use planning and conservation efforts by making invisible patterns visible.
When a natural disaster strikes or drought conditions worsen, NDVI images clearly reveal vegetation loss. Relief agencies and climate researchers can calculate NDVI to assess damage and plan recovery efforts quickly. This approach helps build better food security models and early warning systems, especially in vulnerable regions.
NDVI helps track seasonal vegetation cycles and supports studies on how global warming affects plant life. Over time, NDVI image patterns reveal shifts in growing seasons, forest health, and even carbon absorption across ecosystems. This makes NDVI an essential tool in climate science and biodiversity studies.
With the rise of drone technology and satellite access, NDVI has become more available and accurate. Whether using high-resolution drone images from a multispectral camera or satellite data spanning continents, professionals can calculate NDVI easily and apply it to both small farms and global research projects.
The NDVI formula is based on the difference between near-infrared (NIR) and red light reflectance. Plants with healthy chlorophyll reflect more NIR and absorb more red light, which is why NDVI works as an indicator of plant health.
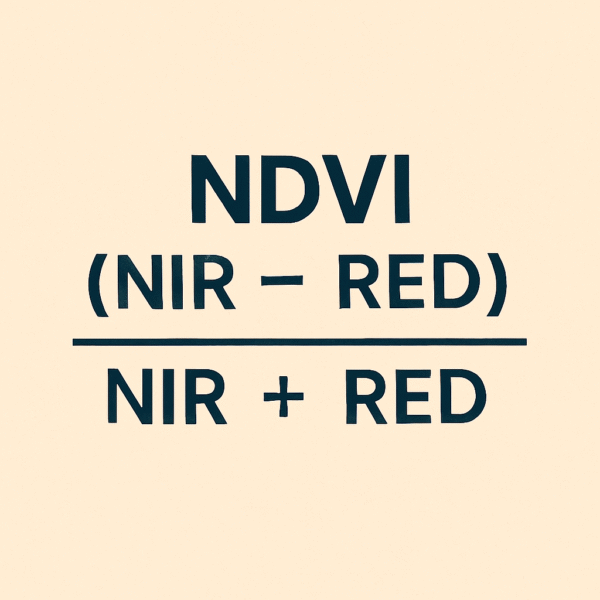
NDVI = (NIR – Red) / (NIR + Red)
This NDVI formula produces values between -1 and +1. High NDVI values suggest healthy vegetation, while values near zero or negative indicate little to no vegetation, bare ground, or water.
Our eyes see plants as green because they reflect green light and absorb red and blue light. However, healthy vegetation also strongly reflects near-infrared light, which we can’t see. This makes NDVI a powerful tool, especially when paired with NDVI images captured from satellites or drones.
XRTech Group uses satellite sensors with both Red and NIR bands to create detailed NDVI images. Some satellites used by XRTech Group include Superview Neo series, Superview-1, Superview-2, GF-7, GF-2, GF-6, GF-1, ZY-3, and ZY-1 02D, which provides Blue, Green, Red, and NIR bands. These sensors help generate clear and accurate NDVI data.
As an example, if the red reflectance is low and the NIR reflectance is high, the result is a high NDVI value—this means the area has healthy plants. If both values are low or the red is higher than NIR, the result is a low or negative NDVI value, showing less or no vegetation.
To track changes in vegetation over time using NDVI, it’s important to perform atmospheric correction. This helps remove interference from the atmosphere, making the results more accurate.
Using this standardized NDVI formula, experts can calculate NDVI easily and get consistent results across different times and areas.
Use the NDVI calculator below to easily calculate NDVI using your data. Just enter the reflectance values for near-infrared (NIR) and red bands from your image or sensor.
This tool helps determine the Normalized Difference Vegetation Index (NDVI), showing how healthy the vegetation is in a given NDVI image.
Simply input the NIR and red reflectance values to get your NDVI result using the standard NDVI formula used by professionals and researchers.
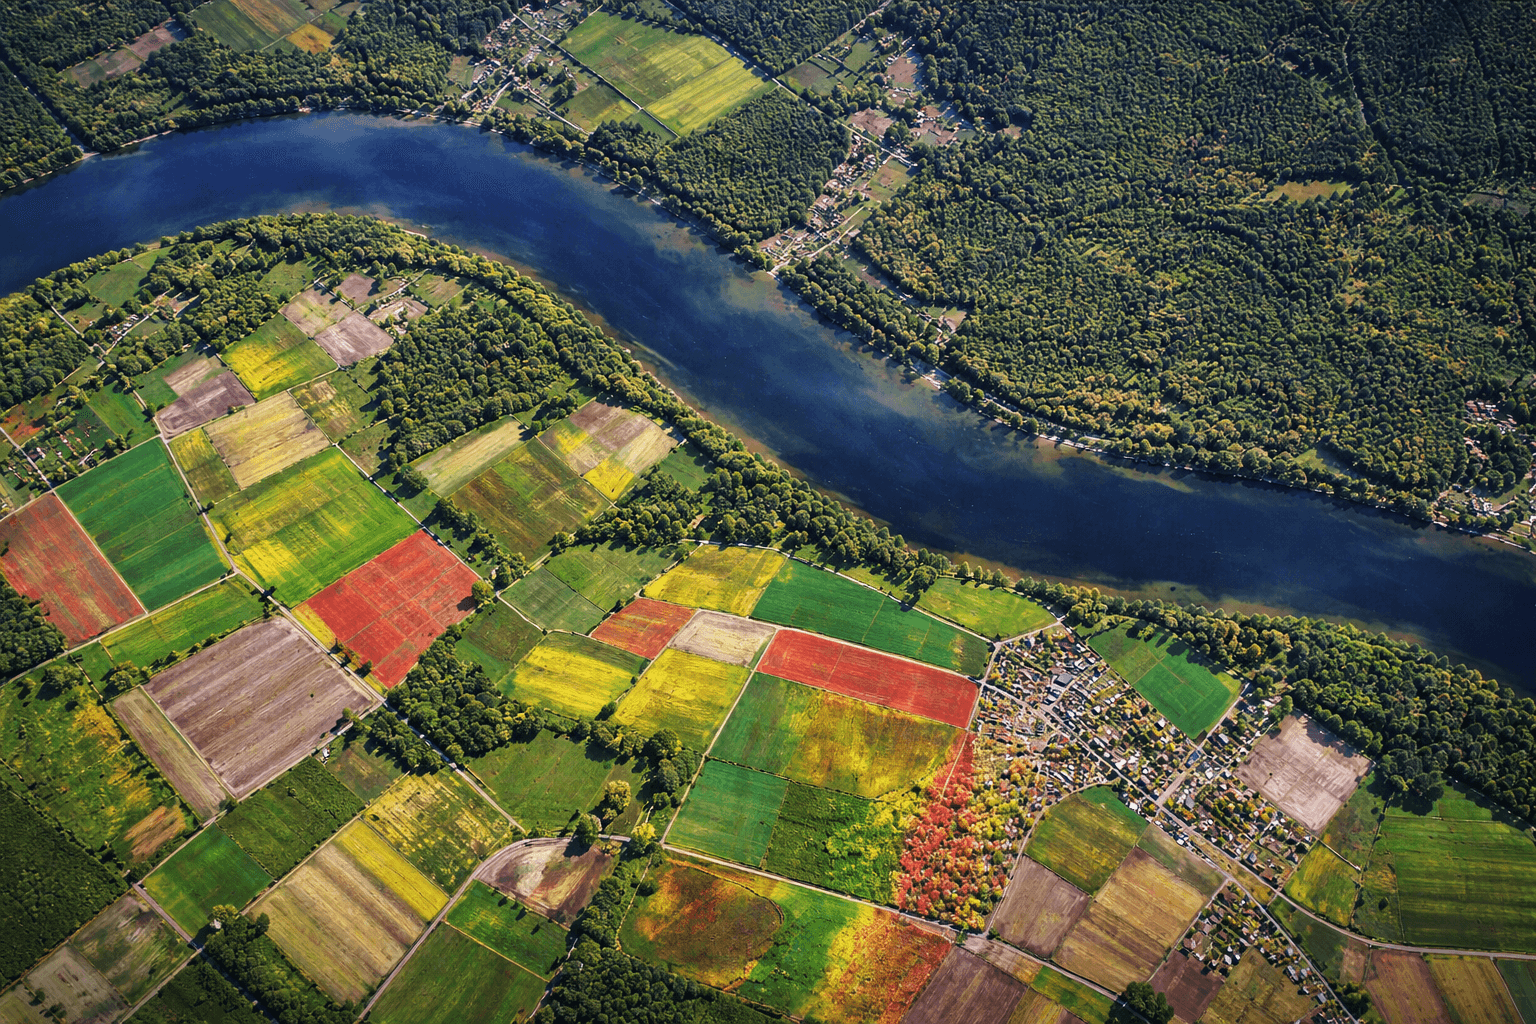
A practical way to understand what is NDVI is to see how it’s applied in real-world agriculture, especially in fields using center pivot irrigation.
These systems rotate around a central point, creating circular patterns of crops that are clearly visible from satellite imagery.
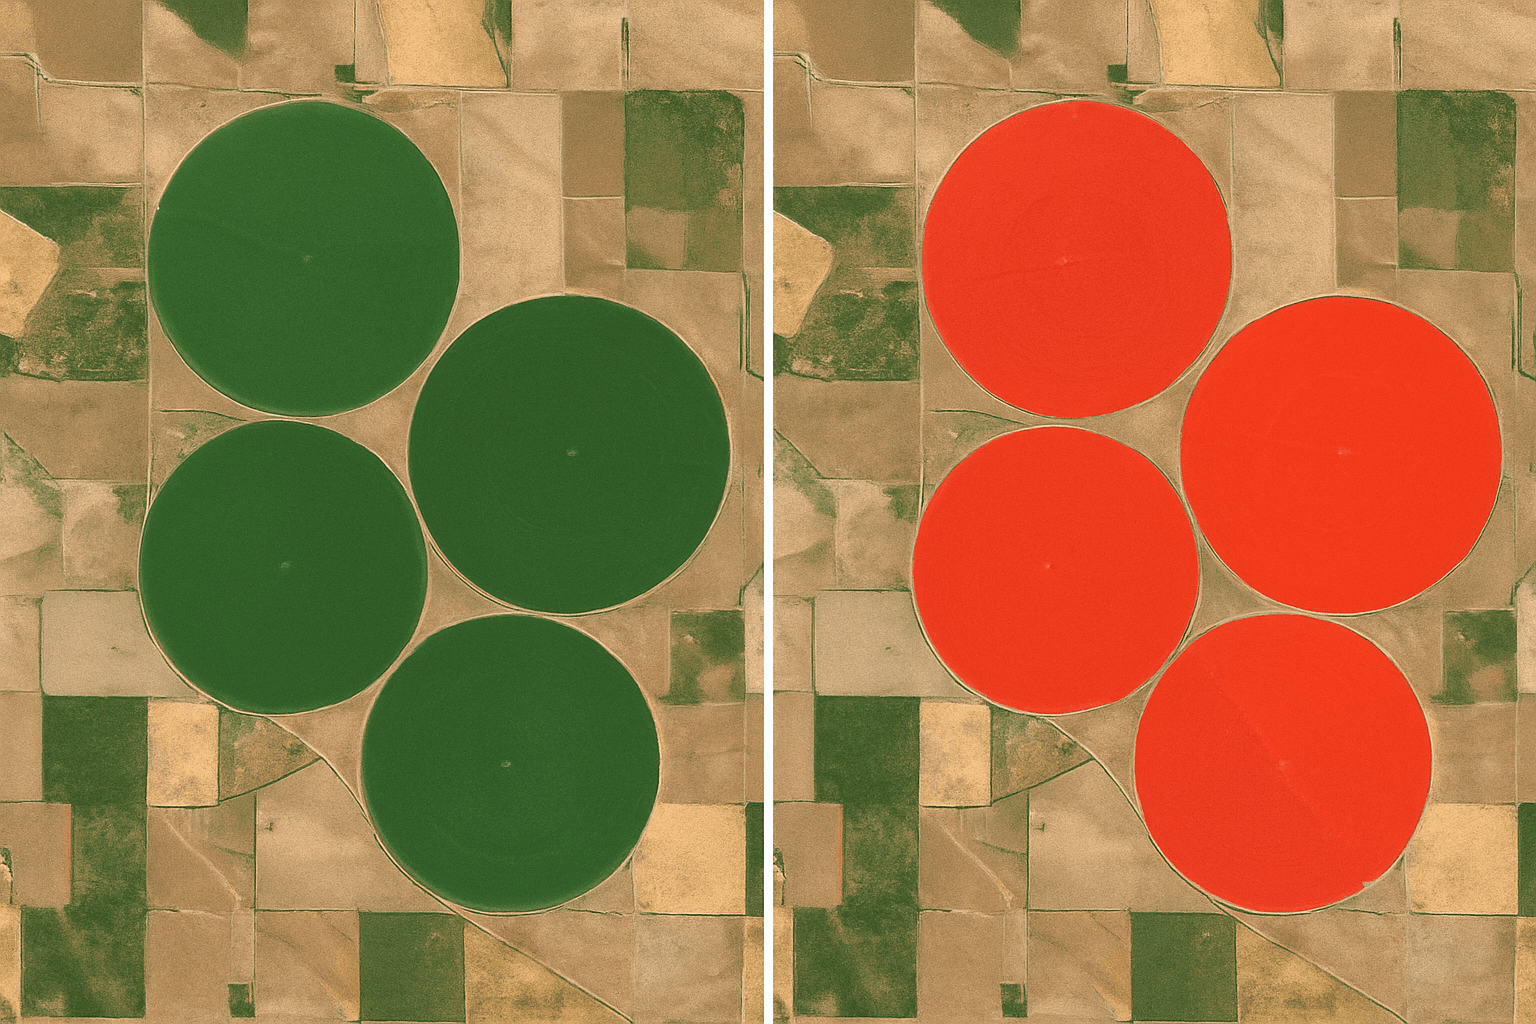
When viewed using true color imagery—which uses red, green, and blue bands just like human vision—the crops and landscape appear as they would to the naked eye.
In this example, the true color NDVI image of pivot irrigation shows the crop circles in natural shades. However, to better understand vegetation health, the NDVI formula incorporates the near-infrared (NIR) band. When this NIR band is displayed in red, it creates a color infrared image. This version highlights healthy vegetation more clearly.
In color infrared, the circular crop areas appear in bright red. That’s because healthy plants reflect near-infrared strongly, and the NDVI calculation brings this out visually. These bright areas stand out immediately, signaling dense, vigorous crops.
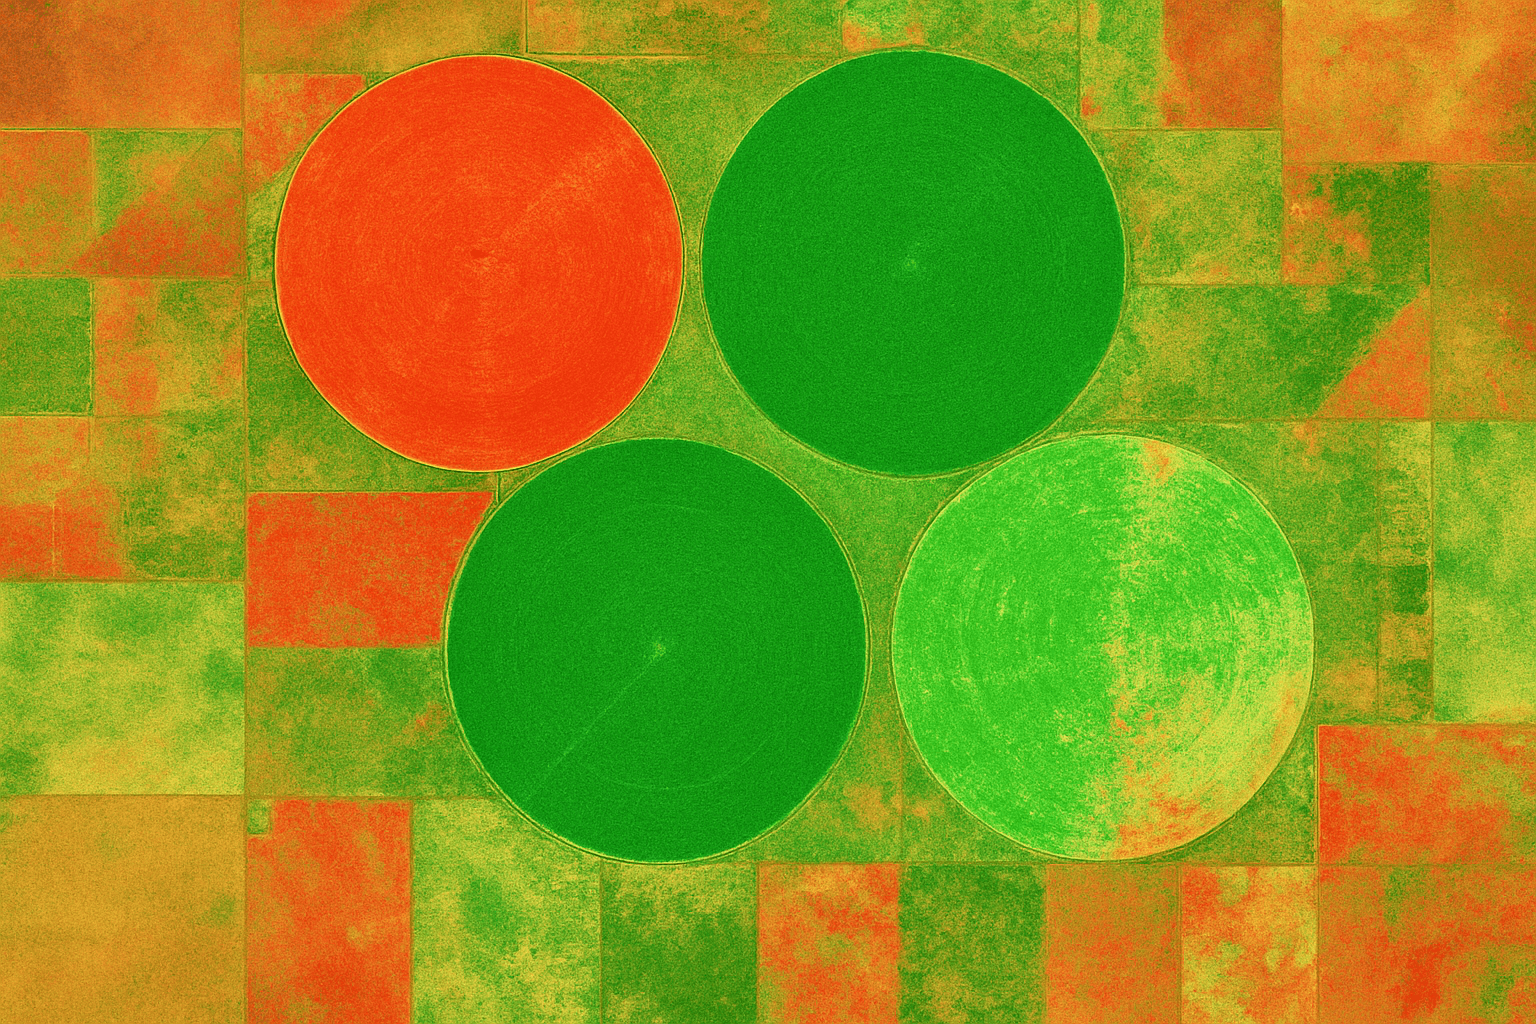
Once the NDVI formula is applied, the resulting NDVI image uses color gradients to indicate vegetation health. Bright green areas show high NDVI values, which means healthy plants with strong chlorophyll content. Red or dull areas reflect low NDVI, often showing dry or barren land.
Using NDVI to calculate vegetation makes it simple to distinguish healthy crop circles. This clarity helps in agricultural planning, crop health monitoring, and even land classification. With tools powered by XRTech Group’s satellite systems, interpreting NDVI becomes a reliable way to manage farmland and boost precision agriculture.
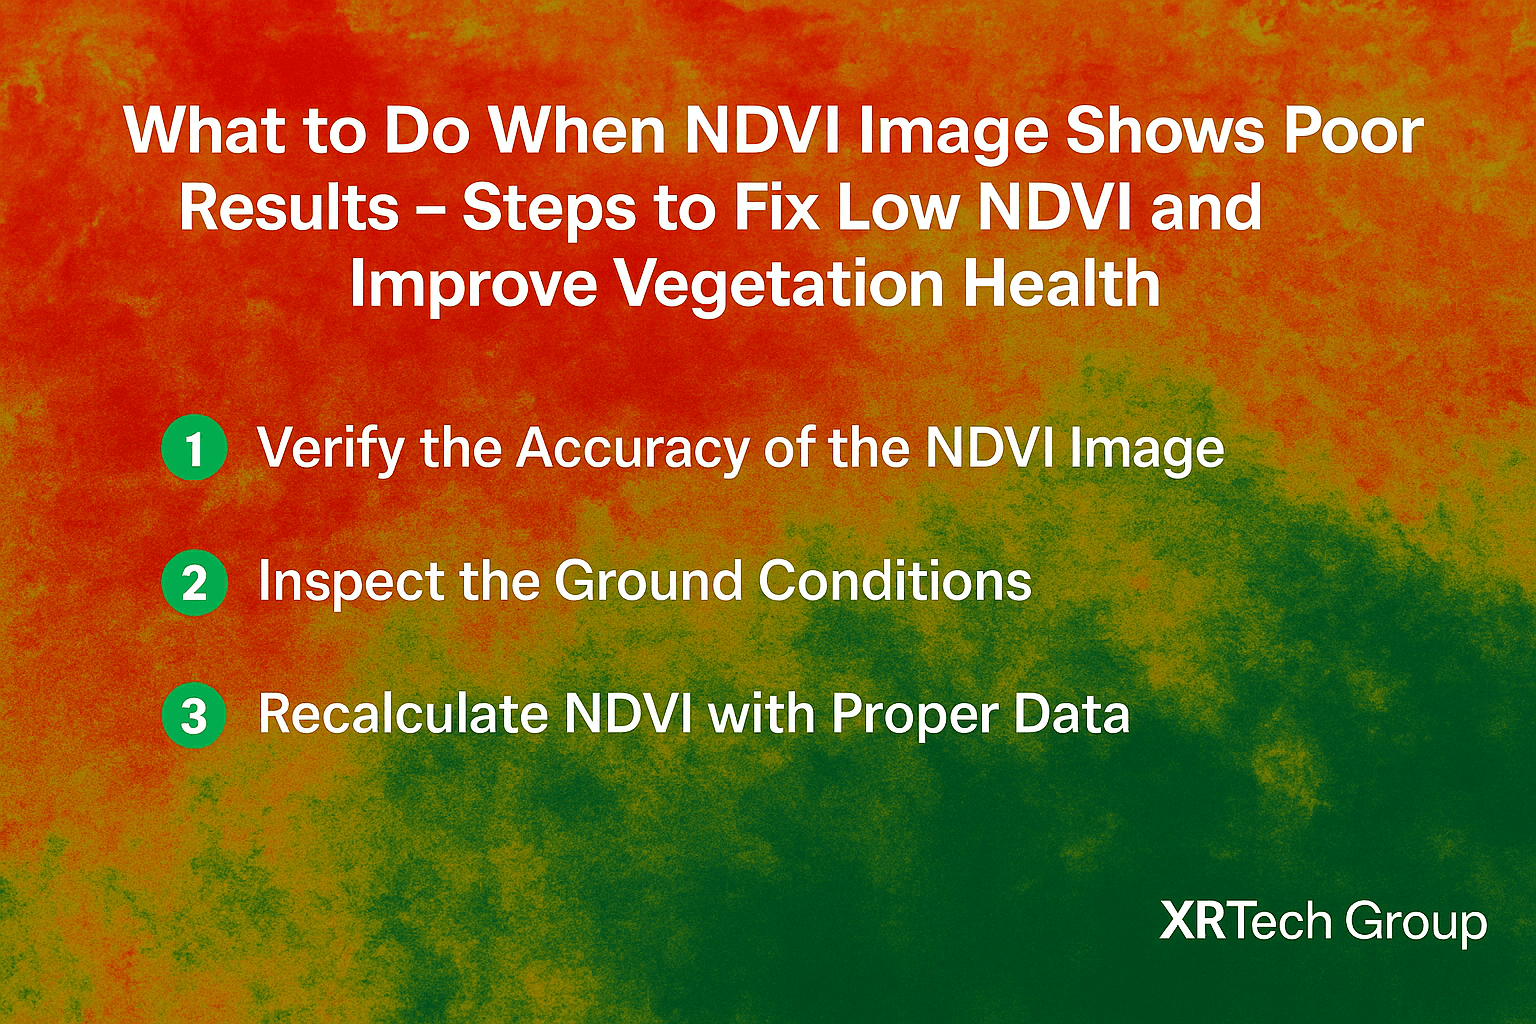
When an NDVI image shows low or unhealthy vegetation values, it means the area might be suffering from stress, damage, or poor growth. Understanding what is NDVI and how to interpret it is just the first step—knowing how to respond is what really makes a difference. Here’s how to take action when the NDVI formula gives poor results:
Check if the NDVI image was captured under the right conditions (clear sky, no shadows, correct season).
Ensure atmospheric corrections were applied to reduce distortions from clouds, haze, or sun angle.
Compare it with earlier NDVI images to confirm it’s not just a one-time anomaly.
Conduct a field survey in low NDVI areas to find real-world causes such as pests, diseases, soil issues, or poor irrigation.
Use drone or satellite imagery from XRTech Group to zoom in for better clarity and decision-making.
Use high-resolution imagery with correct Red and Near-Infrared (NIR) bands to calculate NDVI again.
Apply the NDVI formula accurately: (NIR – Red) / (NIR + Red) to get updated values.
If crops are stressed, improve irrigation schedules or water management techniques.
Modify fertilizer application based on plant needs identified through NDVI analysis.
Consider switching crop types or rotating them to restore soil balance.
Poor soil quality often leads to low NDVI. Add organic matter, test soil pH, and apply nutrients accordingly.
Use precision agriculture tools to target specific low-NDVI zones instead of treating the entire field.
Pest infestation or fungal diseases can drop vegetation health sharply.
Use NDVI images to isolate and treat affected areas, saving time and resources.
Don’t rely on a single NDVI image. Compare NDVI values over days, weeks, or months to see if the issue is temporary or long-term.
This helps in forecasting crop yield and making informed planning decisions.
Combine NDVI with rainfall, temperature, and wind data to understand how external factors are influencing plant growth.
This allows for smarter timing of planting, harvesting, or spraying activities.
Low-quality imagery can result in poor NDVI readings. Use high-precision satellite solutions like Superview Neo or GF series offered by XRTech Group for consistent and detailed NDVI images.
Leverage advanced platforms that allow you to process, visualize, and analyze NDVI data accurately.
XRTech Group provides tailored NDVI analysis services for agriculture, forestry, and environmental applications.
When the NDVI formula shows poor results, it’s not just about the number—it’s a call to action. By understanding what is NDVI, checking your NDVI image for accuracy, and taking the right measures, you can recover plant health and maintain productivity.
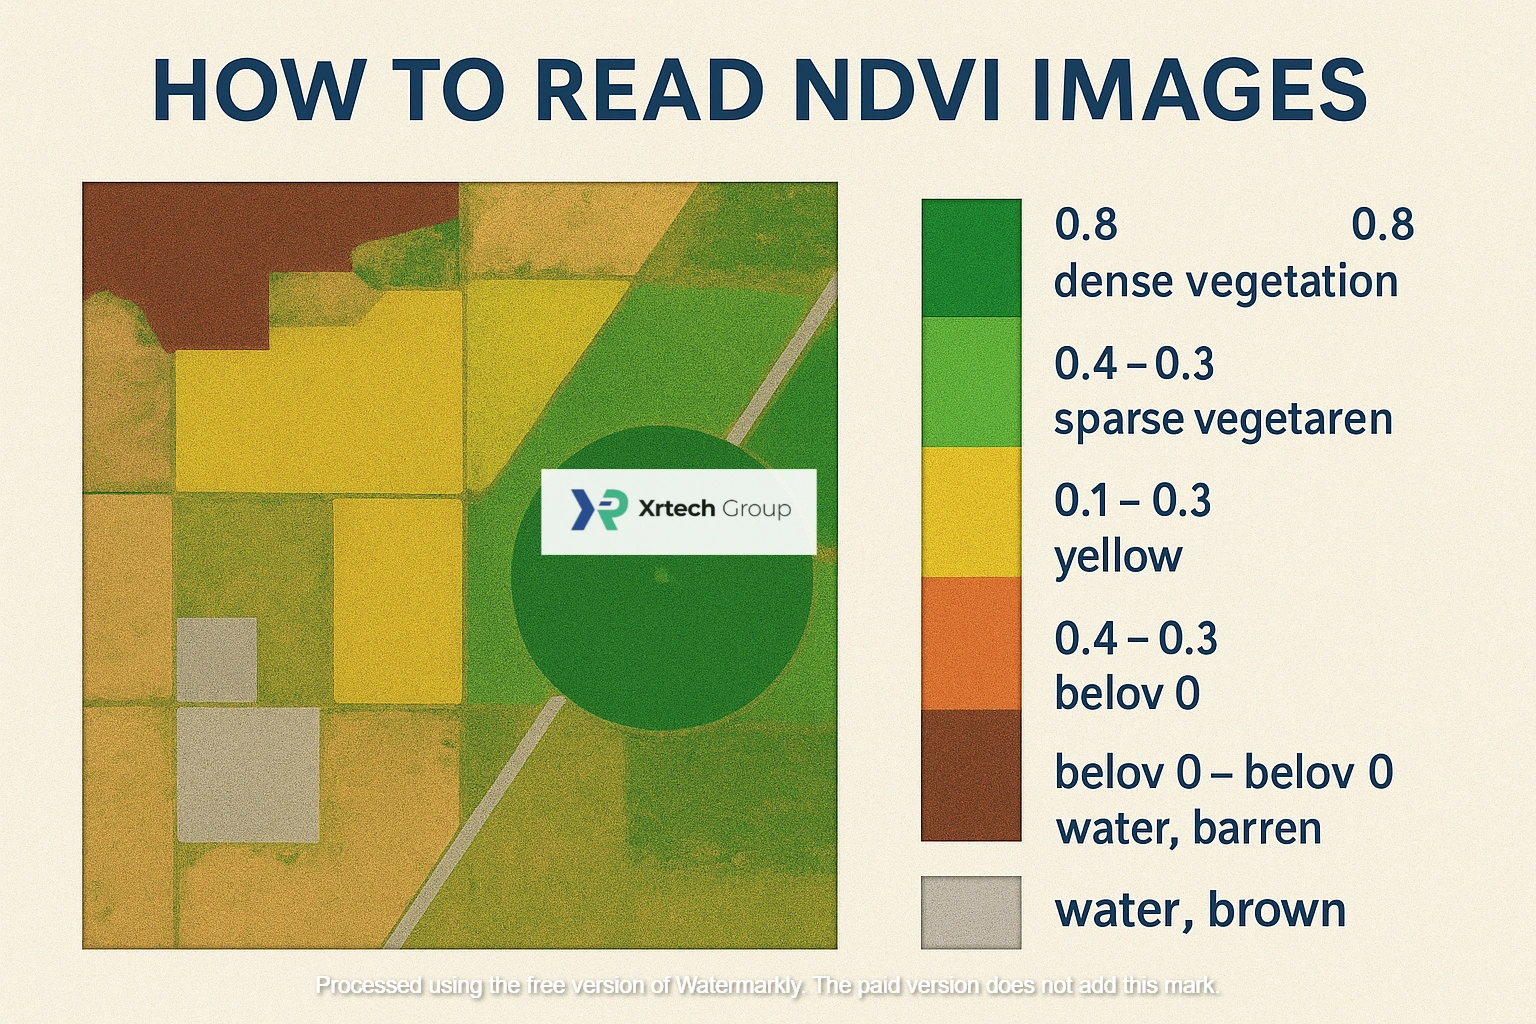
Reading an NDVI image can feel easy once you understand what the colors mean. Each color shows the health of vegetation in a specific area using the NDVI formula, and the image makes it visual. Here’s how to read them step by step:
Know what NDVI is: The Normalized Difference Vegetation Index (NDVI) shows how healthy or stressed vegetation is, based on how it reflects near-infrared and red light. It’s the result of the NDVI formula:
(NIR – Red) / (NIR + Red)
Understand the NDVI scale:
NDVI values always range from -1 to +1. You’ll see them represented in color gradients on the NDVI image.
Interpret the color values:
Each color shows a specific NDVI range that reflects the vegetation status:
Dark Red to Brown: NDVI values below 0 — indicates water, clouds, snow, or barren land.
Yellow to Light Green: NDVI values between 0.1 and 0.3 — shows dry grass or sparse vegetation.
Green to Dark Green: NDVI values from 0.4 to 0.8 or more — means healthy, dense vegetation.
Grey or White areas: Usually mean missing data or non-vegetated areas like cities or roads.
Spot patterns in agriculture:
Farmers and analysts use NDVI images to detect crop stress, areas needing attention, or field zones with healthy growth.
Look at contrast:
A sudden change in color within a field may suggest irrigation issues, pest damage, or soil variation.
Use NDVI over time:
By comparing NDVI images across different dates, you can track vegetation health and observe seasonal changes.
Read with context:
Combine NDVI readings with local knowledge, field surveys, or weather conditions for more accurate decisions.
Leverage satellite tools from XRTech Group:
Our advanced satellite systems capture and generate NDVI images from multispectral data, helping users calculate NDVI with clarity and consistency.
Reading an NDVI image becomes second nature once you understand the scale and how the NDVI formula transforms raw data into visual insights. With the help of XRTech Group’s high-resolution imagery, anyone—from farmers to scientists—can make sense of their land in just a glance.
XRTech Group supports farmers by combining NDVI image technology, satellite data, and artificial intelligence to improve crop health and boost agricultural productivity. Their Satellite Data Applications: Agriculture Module gives farmers the tools they need to monitor crops, manage fields, and make better decisions using NDVI and remote sensing.
Here’s how XRTech helps:
XRTech provides real-time NDVI image data that helps track crop growth and health across large areas.
Farmers can view and monitor field conditions during planting, growing, and harvest seasons.
The data helps in mapping fields, estimating yields, and identifying different crop types.
It supports precision agriculture by showing exactly where crops need attention.
XRTech uses multispectral satellite imagery including Red and Near-Infrared (NIR) bands to calculate NDVI.
Satellites like Superview Neo, GF-1, GF-2, GF-6, GF-7, ZY-3, and ZY-1 02D provide the right bands needed for NDVI formula.
NDVI helps identify healthy vs. unhealthy crops by detecting changes in how plants reflect light.
The data is useful to analyze biomass, monitor soil moisture, and predict yield.
These insights help farmers see which areas are doing well and which need action.
Using NDVI image and AI tools, XRTech identifies areas that lack water or nutrients.
Farmers get alerts to adjust irrigation based on real-time soil moisture data.
Fertilizer use becomes more targeted, reducing waste and improving plant health.
AI models analyze NDVI and spectral data to detect early signs of crop stress.
XRTech uses thermal drones to find pest hotspots using infrared heat signatures.
The system has high accuracy (over 90%) for identifying and mapping affected areas.
Farmers can act early to protect crops and reduce damage.
XRTech tracks land changes using remote sensing and NDVI values.
The system detects non-crop areas or degraded fields.
AI can classify different crop types with over 90% accuracy using NDVI image data.
This helps in better field planning and resource allocation.
XRTech combines satellite NDVI with weather models to predict risks like drought or flooding.
Farmers get forecasts and action plans based on NDVI trends and environmental conditions.
This helps in making smarter, time-sensitive farming decisions.
XRTech offers access to premium satellites that capture multispectral imagery with Red and NIR bands.
These bands are essential to apply the NDVI formula:
(NIR – Red) / (NIR + Red)
With clear NDVI results, farmers can easily see where crops are thriving or struggling.
With XRTech Group’s advanced tools, farmers not only understand what is NDVI but also know how to use it effectively. By combining NDVI image analysis with AI and real-time monitoring, XRTech helps modernize farming and protect crops.
Let XRTech Group help you monitor vegetation, predict yields, and improve your farming decisions using advanced NDVI image analysis and satellite data.
👉 Contact XRTech Group Today
Get access to real-time crop monitoring, AI-powered analytics, and multispectral satellite imagery.
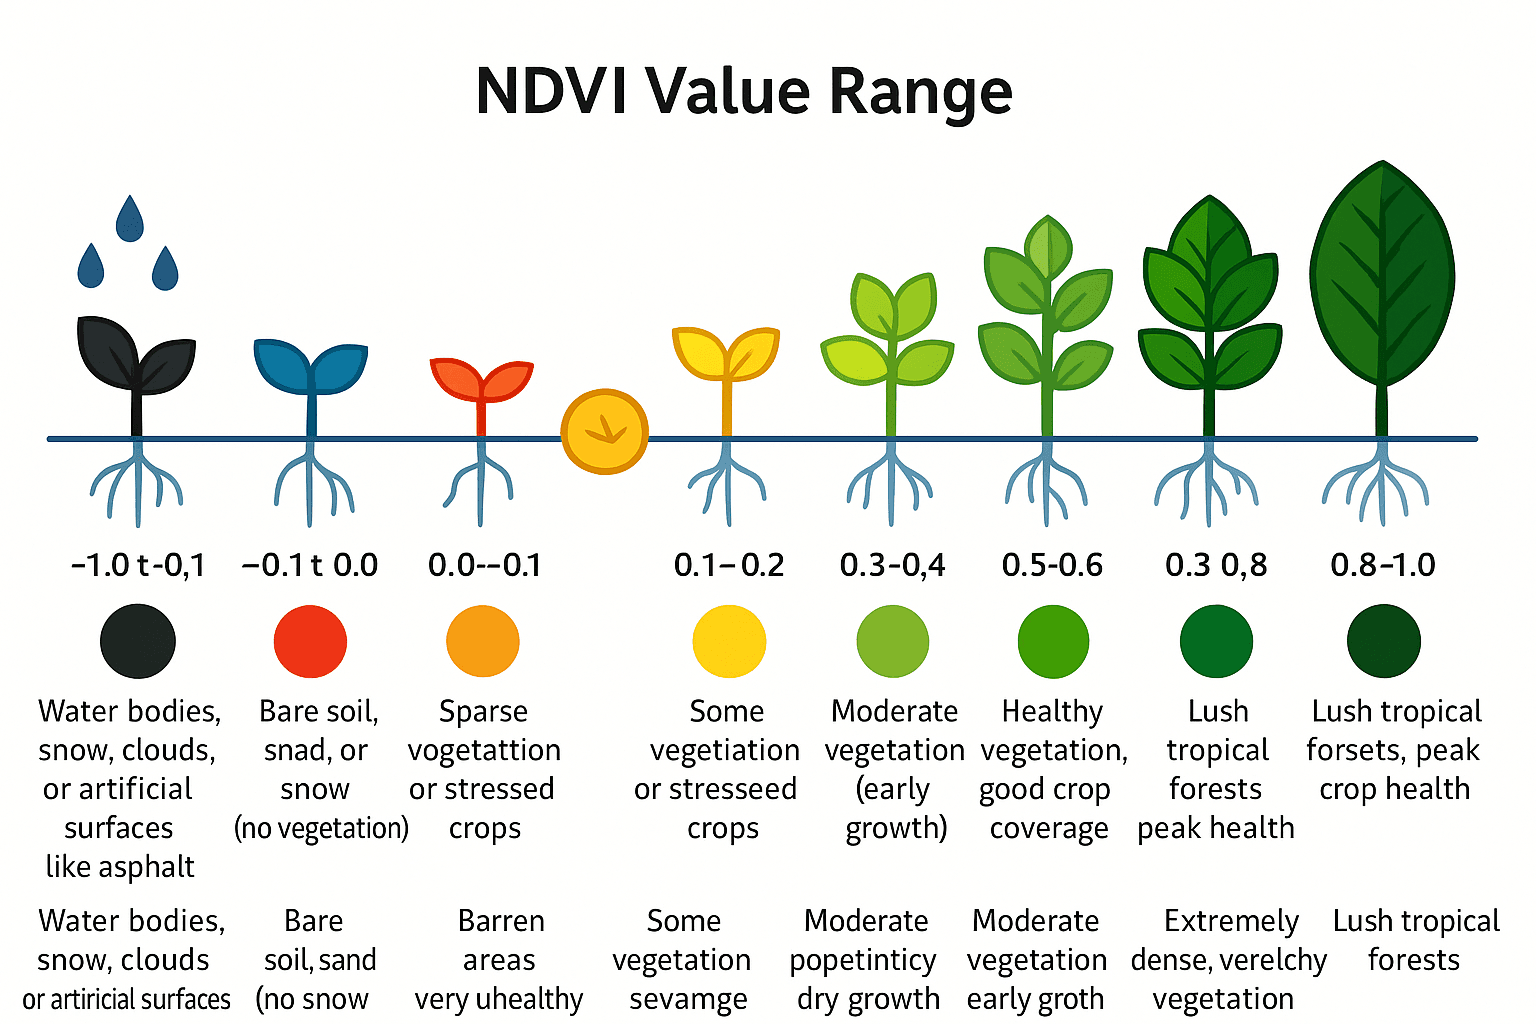
NDVI (Normalized Difference Vegetation Index) is a powerful tool used to measure plant health and vegetation density through satellite or drone imagery. The image above illustrates how NDVI values correspond to different stages of plant growth and health, helping professionals monitor agricultural fields, forests, and green spaces more effectively.
Each plant stage is associated with a specific NDVI value and color range:
🌲 NDVI 0.8 to 1.0 (Deep Forest Green): Indicates extremely dense and healthy vegetation, often found in tropical rainforests or peak-season crops.
🌳 NDVI 0.6 to 0.8 (Very Dark Green): Shows lush vegetation, ideal crop conditions, and thriving ecosystems.
🟢 NDVI 0.5 to 0.6 (Dark Green): Represents mature, healthy crops and well-managed agricultural land.
🟢 NDVI 0.4 to 0.5 (Green): Indicates good crop coverage and healthy vegetation with moderate density.
🟢 NDVI 0.3 to 0.4 (Light Green): Early stages of growth or moderately healthy plants.
🟡 NDVI 0.2 to 0.3 (Yellow): Vegetation is present but possibly dry, under stress, or in recovery.
🟠 NDVI 0.1 to 0.2 (Orange): Sparse or struggling vegetation, often requiring irrigation or attention.
🔴 NDVI 0.0 to 0.1 (Red): Barren areas, highly stressed or unhealthy plants, or urban environments.
🔵 NDVI -0.1 to 0.0 (Blue): Bare soil or non-vegetated land such as sand or snow.
⚫ NDVI -1.0 to -0.1 (Black/Dark Blue): Water bodies, snow cover, clouds, or artificial surfaces like roads.
Monitoring NDVI helps farmers, researchers, and environmentalists:
Track plant health over time.
Detect drought stress or disease early.
Improve precision agriculture through data-driven decisions.
Optimize irrigation and fertilization.
By understanding NDVI values at different growth stages, land managers can act quickly to maintain crop health and improve yield outcomes. XRTech Group’s visual guide helps simplify this complex data into easy-to-understand stages for practical decision-making.
At XRTech Group, we help farmers unlock smarter, data-driven decisions through cutting-edge drone technology and NDVI analytics. One of the most powerful tools in your farming toolkit is the Normalized Difference Vegetation Index, or NDVI — a proven method for tracking crop health and applying inputs only where they’re truly needed.
By analyzing NDVI images, you can break your field into management zones: high-yield, moderate-yield, and low-yield areas. This allows for variable rate application (VRA) of fertilizers, pesticides, or growth enhancers — increasing the dosage in productive zones and reducing it where the return doesn’t justify the cost.
Maximize ROI on fertilizers and chemicals
Reduce overuse and environmental impact
Improve crop uniformity across the field
Boost input efficiency by targeting only the areas that need attention
Whether you’re growing wheat, corn, or specialty crops, NDVI images generated by XRTech drones make precision farming simple and effective.
Large-scale agriculture often struggles with blanket treatments across entire fields. At XRTech Group, we help you bring precision to those acres. Using high-resolution NDVI images, you can detect variations in crop performance due to overwatering, nutrient imbalance, or pest pressure.
These NDVI values, calculated using the NDVI formula:
(NIR – Red) / (NIR + Red)
provide early-warning signs when crops are under stress — before it’s visible to the naked eye.
Acts as a feedback loop to measure treatment effectiveness
Highlights long-term issues like soil compaction or drainage problems
Helps make informed, corrective decisions over time
With XRTech Group’s drone mapping and analytics, you can skip guesswork and apply smarter solutions backed by data.
Hailstorms, droughts, and frost events can leave your field looking devastated — but looks can be deceiving. With XRTech’s drone-powered NDVI imaging, you can quickly identify the parts of your field that are still viable.
Our high-accuracy NDVI maps provide visual proof of where plant vigor has been compromised. This allows you to focus replanting, fertilization, or treatment efforts only where it matters most — saving time, money, and resources.
Spot which areas need replanting vs. recovery
Evaluate the performance of different crop varieties under stress
Plan for future climate-resilient planting strategies
Over time, NDVI data helps you build a resilience map — showing which zones consistently bounce back and which need structural changes or different crop selections.
At XRTech Group, we combine aerial intelligence with agricultural expertise. Our advanced satellite capture ultra-precise NDVI images, and our team helps you interpret them with clarity and confidence.
We use the latest satellite equipped with multispectral sensors
Fast NDVI processing and mapping for real-time decision-making
Tailored support for NDVI-driven fertilization, irrigation, and stress detection
Scalable solutions for farms of all sizes
Whether you’re just getting started or looking to upgrade your precision ag capabilities, XRTech Group delivers results you can trust — with the power of NDVI, the precision of satellite tech, and the backing of agronomic insight.
Understanding the applications and benefits of NDVI images in farming helps farmers and agricultural professionals make informed decisions based on real-time data. NDVI (Normalized Difference Vegetation Index) is widely used in modern agriculture because it shows how healthy crops are by analyzing how they reflect light—especially near-infrared and red light.
Here’s how NDVI images can help in real farming conditions:
NDVI images help farmers see where crops are healthy and where they are not.
Green areas in the image show healthy vegetation, while red or yellow may signal stress, disease, or poor soil.
By checking NDVI regularly, farmers can respond early before problems get worse.
NDVI maps reveal dry patches in fields, helping with efficient water use.
Farmers can avoid overwatering or underwatering, saving water and boosting plant health.
This reduces water costs and prevents crop stress.
Poor growth areas can be identified quickly through NDVI images.
This guides targeted fertilization, so farmers only apply nutrients where needed.
Reduces waste and protects the environment while improving yields.
NDVI helps estimate how much crop is growing and how much will be harvested.
This supports better supply chain decisions, sales planning, and food security.
Farmers can compare NDVI data across seasons to predict outcomes more accurately.
NDVI maps divide fields into zones based on vegetation health.
These zones help in precision agriculture, where each area is managed differently.
That means higher efficiency, better resource use, and fewer risks.
Sudden drops in NDVI values can show early signs of pest damage or crop disease.
This allows faster treatment and prevents major losses.
Healthy plants reflect more near-infrared light, so changes are easy to track.
NDVI images over time show long-term crop performance.
This helps in planning crop rotations, managing soil health, and selecting the right crops for each season.
Supports better sustainability practices on farms.
NDVI is calculated from satellite or drone images.
XRTech Group provides NDVI image data from advanced satellites like Superview, GF-series, and ZY-series.
This makes the solution scalable for any farm—small or large.
Using NDVI in farming improves productivity, saves time, and reduces waste. It allows farmers to make smarter, faster decisions backed by satellite technology. Whether it’s monitoring growth, reacting to crop stress, or planning for harvest, NDVI images make modern agriculture more data-driven and sustainable.
Understanding what is NDVI becomes even more useful when it can be analyzed across time (temporally) and over different locations (spatially). At XRTech Group, advanced tools and technologies help visualize and interpret NDVI images in ways that give farmers, researchers, and land managers powerful insights into crop performance, vegetation change, and environmental conditions over time and space.
Here’s how the top NDVI analysis tools help with both spatial and temporal assessments:
Temporal NDVI analysis helps monitor vegetation changes across seasons and years.
By comparing NDVI values over time, users can see trends in plant health, crop growth stages, or long-term deforestation.
This helps in forecasting yields, identifying delayed growth, or detecting stress before it becomes visible to the eye.
📌 Example: A field might show healthy crops in May but declining NDVI by July. With this trend, action can be taken early to fix irrigation or soil issues.
Spatial NDVI analysis lets users compare different regions or zones of a field or landscape.
It’s especially useful for large-scale farms, forests, or regional studies.
Variations in NDVI values across the map show which areas need more attention and which are thriving.
📌 Example: On one farm, NDVI may be high in one corner but low in another due to soil differences or pests. This allows targeted treatment, saving resources and increasing efficiency.
XRTech Group provides access to NDVI tools backed by satellite remote sensing and AI-driven platforms. These tools make it easier to:
Calculate NDVI using satellite bands like Red and Near-Infrared (based on the standard NDVI formula).
View NDVI images in real-time or from historical data.
Compare NDVI changes spatially and temporally to support precision farming or research.
Generate time-lapse NDVI maps for crop health monitoring, land cover changes, or drought assessment.
Spot crop stress early before yield loss occurs.
Manage large farmlands remotely with better accuracy.
Improve land-use planning, irrigation schedules, and fertilization decisions.
Monitor impacts of climate and seasonal changes using continuous NDVI tracking.
Optimize resources based on detailed, location-specific insights.
Analyzing NDVI images effectively requires specialized software that can process satellite data, apply the NDVI formula, and visualize vegetation health in easy-to-understand ways. Many software tools are designed to help farmers, researchers, and environmentalists calculate NDVI and gain insights from what is NDVI data.
Here are some of the top software options widely used for NDVI image analysis:
An open-source Geographic Information System (GIS) software.
Supports multispectral satellite data and allows users to apply the NDVI formula.
Great for spatial analysis, map creation, and temporal NDVI studies.
Ideal for those seeking free but powerful NDVI tools.
A professional remote sensing software widely used for NDVI image processing.
Offers advanced tools for multispectral image classification, spectral analysis, and vegetation monitoring.
Supports large datasets from satellites like those used by XRTech Group.
A popular GIS platform by Esri with NDVI calculation capabilities.
Provides tools for temporal and spatial analysis of vegetation health.
Easily integrates with satellite data, helping users visualize and interpret NDVI trends.
Cloud-based platform for processing and analyzing large-scale satellite imagery.
Supports the NDVI formula to calculate NDVI for global datasets.
Allows temporal analysis over years of satellite data with powerful visualization tools.
Open-source software designed for processing Sentinel satellite data.
Includes tools for NDVI calculation and other vegetation indices.
Useful for agriculture and environmental monitoring using high-resolution satellite data.
Calculate NDVI quickly and accurately from raw satellite bands like Red and Near-Infrared.
Analyze vegetation health trends over time and across different spatial areas.
Support precision farming with detailed crop health insights.
Automate data processing to handle large satellite image datasets.
Using the right NDVI image analysis software helps turn satellite data into actionable information for better crop management, environmental monitoring, and research. XRTech Group supports these technologies by providing access to high-quality satellite data compatible with these powerful NDVI tools.
To track real changes in vegetation health over time, simply observing NDVI values is not always enough. Instead, a more refined approach called the Fuel Moisture Stress Index (FMSI) is used. FMSI involves calculating the inverse z-score of NDVI, which helps adjust NDVI readings relative to long-term averages.
This method considers observed NDVI values compared against a baseline or mean NDVI over a period. By doing so, it highlights vegetation stress more precisely than raw NDVI values alone. The longer the timespan of NDVI observations, the more reliable and accurate the FMSI becomes in reflecting the true condition of vegetation.
Using FMSI provides deeper insight into how vegetation responds to environmental stresses such as drought or fire risk, offering valuable data for agriculture, forestry, and land management.
In summary, while NDVI images give a snapshot of vegetation health, integrating FMSI enhances understanding of vegetation robustness by accounting for variations over time, making it a powerful tool to complement traditional NDVI analysis.
When studying vegetation change over time using NDVI images, having atmospherically corrected data becomes crucial. This is because atmospheric conditions—like haze, clouds, dust, or humidity—can affect how satellite sensors record the reflected light from the Earth’s surface. Without correction, these variations can create misleading NDVI values, making it difficult to accurately track real changes in vegetation health or density.
Atmospheric correction removes these atmospheric influences, ensuring that the NDVI values represent true surface reflectance. This consistency allows for reliable comparisons between images taken at different times, helping farmers, researchers, and environmentalists confidently monitor vegetation trends and detect gradual changes.
Regarding the NDVI formula itself: NDVI = (NIR – Red) / (NIR + Red)
This formula is the same for both Level-1 (non-atmospherically corrected) and Level-2 (atmospherically corrected) satellite data. However, the accuracy and reliability of NDVI values depend heavily on the data level. NDVI calculated from Level-2 data reflects actual surface conditions much better because atmospheric distortions are minimized. Conversely, NDVI from Level-1 data may include noise from atmospheric interference, potentially causing errors in analysis, especially when comparing data over time.
In summary, while the NDVI formula remains consistent, using atmospherically corrected data is key for accurate, meaningful vegetation monitoring, particularly when analyzing changes over extended periods.
Understanding what is NDVI and how to calculate NDVI plays a vital role in modern agriculture and environmental monitoring. NDVI images provide clear insights into vegetation health by measuring the difference between near-infrared and red light reflected from plants. This simple yet powerful tool helps farmers optimize crop management, improve yields, and monitor land changes effectively.
At XRTech Group, we emphasize the importance of accurate NDVI analysis using the latest satellite data and advanced processing techniques. Whether you’re tracking crop health, detecting drought stress, or managing land resources, mastering NDVI and its applications ensures smarter, data-driven decisions.
By embracing NDVI technology, you gain a deeper understanding of your fields’ condition, enabling precise interventions that save time, resources, and costs. For anyone eager to harness the power of remote sensing, learning to read NDVI images and implement the NDVI formula correctly is the first step toward sustainable and productive agriculture.
Explore how XRTech Group’s cutting-edge satellite imagery and tools can help you unlock the full potential of NDVI for your farming needs. Start calculating NDVI today and watch your crop management transform.
NDVI stands for Normalized Difference Vegetation Index. It is a measurement used to assess the health and density of vegetation by comparing how plants reflect near-infrared and red light. NDVI images help monitor plant growth and environmental changes.
The NDVI formula uses the difference between near-infrared (NIR) and red light reflectance divided by their sum:
NDVI = (NIR – Red) / (NIR + Red). This calculation generates values between -1 and +1, where higher values indicate healthier vegetation.
Values close to +1 show dense, healthy green vegetation. Values near zero indicate sparse vegetation or bare soil, while negative values typically indicate water, clouds, or non-vegetated surfaces.
Yes, NDVI is widely used in agriculture to monitor crop health, detect stress, guide irrigation, and optimize fertilizer use. NDVI images provide farmers with actionable data to improve yields and resource management.
The NDVI formula remains consistent whether the data is atmospherically corrected or not. However, for accurate analysis of vegetation changes over time, using atmospherically corrected data is recommended to remove atmospheric effects and improve reliability.
NDVI images can be obtained from satellite data providers like XRTech Group and drone sensors equipped with multispectral cameras that capture both near-infrared and red bands.
Atmospheric correction ensures that NDVI values reflect true surface conditions by eliminating distortions caused by the atmosphere, such as haze or smoke. This is especially important when comparing vegetation changes over time.
XRTech Group offers advanced satellite imagery and AI-powered tools to help farmers calculate NDVI, monitor crop health, and manage agricultural practices efficiently.
1. USGS – Landsat Normalized Difference Vegetation Index (NDVI)
The United States Geological Survey (USGS) provides comprehensive information on NDVI derived from Landsat missions. These NDVI products are instrumental in quantifying vegetation greenness, assessing plant health, and monitoring changes in vegetation density over time. The NDVI is calculated using the formula: (NIR – Red) / (NIR + Red), utilizing specific bands from Landsat satellites. This resource is invaluable for understanding the application of NDVI in remote sensing and vegetation analysis. Reference: USGS
2. NOAA – Climate Data Record (CDR) of Normalized Difference Vegetation Index (NDVI)
The National Oceanic and Atmospheric Administration (NOAA) offers a Climate Data Record of NDVI, providing gridded daily NDVI data derived from the Advanced Very High Resolution Radiometer (AVHRR) surface reflectance. This dataset spans from 1981 to the present, offering a long-term record essential for detecting drought-stressed regions, forecasting agricultural yields, and managing forestry and crops. The NDVI values are calculated using the standard formula: (NIR – Red) / (NIR + Red). Reference: NCEI
3. MODIS – Vegetation Index Products (NDVI and EVI)
The Moderate Resolution Imaging Spectroradiometer (MODIS) project provides NDVI and Enhanced Vegetation Index (EVI) products, which are widely used in ecosystem, climate, and natural resource management studies. These products offer high temporal resolution, with 16-day composites generated every eight days, facilitating detailed monitoring of vegetation dynamics. The NDVI is calculated using the formula: (NIR – Red) / (NIR + Red), utilizing data from the Terra and Aqua satellites. Reference: MODIS
4. ScienceDirect – High-Quality Vegetation Index Product Generation: A Review of NDVI
This peer-reviewed article provides an in-depth review of methods for generating high-quality NDVI time series products. It summarizes various techniques, discussing their merits and demerits, and offers insights into the challenges and advancements in NDVI product generation. This resource is beneficial for understanding the complexities involved in NDVI data processing and application. Reference: ScienceDirect
5. ResearchGate – NDVI Analysis Using Landsat Imagery in East Java
This study focuses on the use of NDVI images from Landsat to analyze vegetation density in Kediri City, East Java. It highlights how the NDVI formula is applied for urban green space assessment. Reference: Pemanfaatan Citra Landsat Menggunakan Teknik NDVI
Tailings Dam Monitoring: How Advanced Satellite Intelligence Is Transforming Tailings Dam Safety Tailings dams are among the most critical—and high-risk—structures
From Visible Light to Spectral Intelligence in Modern Satellite Remote Sensing Satellite imaging has moved beyond photography. For decades, Earth