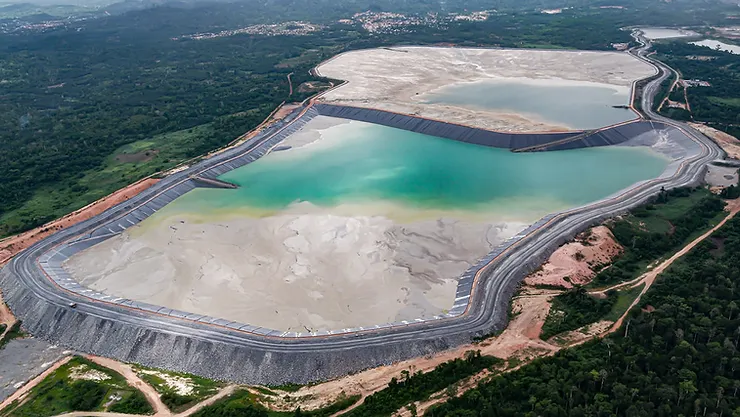
Tailings Dam Monitoring with InSAR & AI
Tailings Dam Monitoring: How Advanced Satellite Intelligence Is Transforming Tailings Dam Safety Tailings dams are among the most critical—and high-risk—structures
Digital elevation data reveals the shape of the earth with clarity that supports planning, engineering, and decision making. At XRTech Group, this data is transformed into usable intelligence through DEM, DSM, and DTM models that show ground levels, surface features, and true terrain structure. By converting landscapes into measurable elevation data, organizations can locate flood-risk areas, evaluate infrastructure routes, and plan land development with confidence. This information helps detect vegetation changes, monitor coastline shifts, and identify terrain constraints before construction begins.
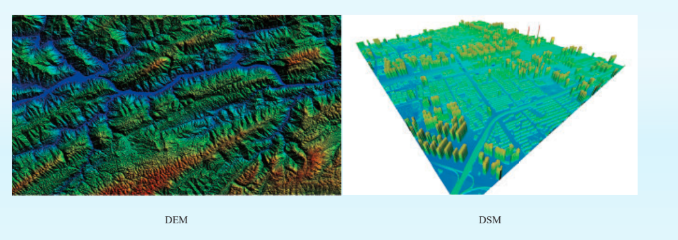
Because the terminology can be confusing, we clarify how DEM, DSM, and DTM differ and when each one is required. A Digital Elevation Model is the foundation layer, while a DSM captures all visible surface features, and a DTM isolates the bare earth for engineering accuracy. Understanding these differences is essential for choosing the right dataset for urban planning, mining, environmental studies, and infrastructure design. With XRTech Group, clients get accurate elevation data that aligns with project requirements, accuracy standards, and operational needs.
Digital Elevation Models (DEMs) provide the vertical dimension needed to understand real-world terrain, enabling accurate analysis that is not possible with 2D imagery alone.
DEMs are categorized into DEM, DSM, and DTM, where DSM includes all surface features and DTM represents the bare-earth ground surface for engineering-grade accuracy.
Elevation data is created using methods like optical stereo photogrammetry, LiDAR laser scanning, and radar-based InSAR, each offering different accuracy levels depending on the project requirement.
Key accuracy factors include pixel resolution, vertical RMSE tolerance, sensor type, acquisition method, terrain complexity, and processing quality.
Vertical errors appear as sinks, spikes, striping patterns, and interpolation artifacts, and are more common in older or low-resolution datasets.
Advanced sensors such as LiDAR, InSAR, and controlled off-nadir imagery significantly reduce vertical error and enable millimeter to centimeter precision monitoring.
DEMs support critical industries such as hydrology, engineering, construction, mining, agriculture, telecommunications, environmental monitoring, and disaster response.
Free datasets like SRTM and ASTER provide global baseline coverage but lack the resolution required for high-stakes decisions, engineering design, or modern infrastructure planning.
Commercial high-resolution DEMs from satellites like SuperView Neo-1, GF-7, and SAR constellations offer sub-meter accuracy, on-demand tasking, and reliable performance in cloud-covered, mountainous, and complex terrain.
Modern workflows use DEM fusion with multispectral, radar, and vector data to build digital twins, optimize infrastructure routes, simulate flood behavior, monitor terrain change, and generate real-time operational intelligence.
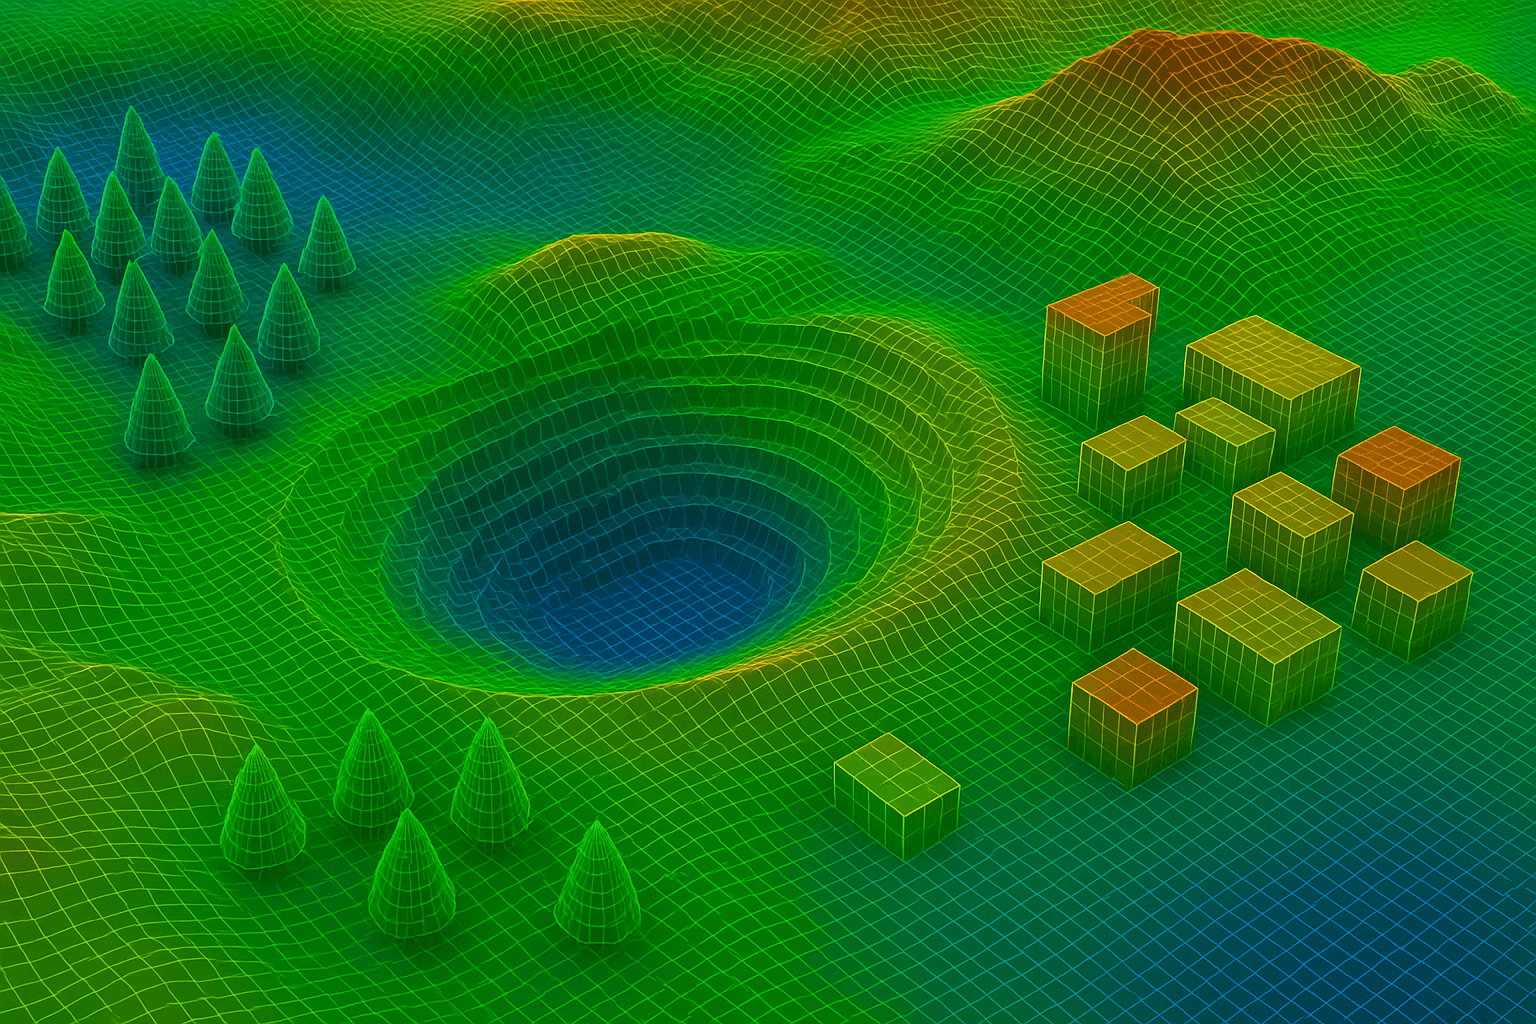
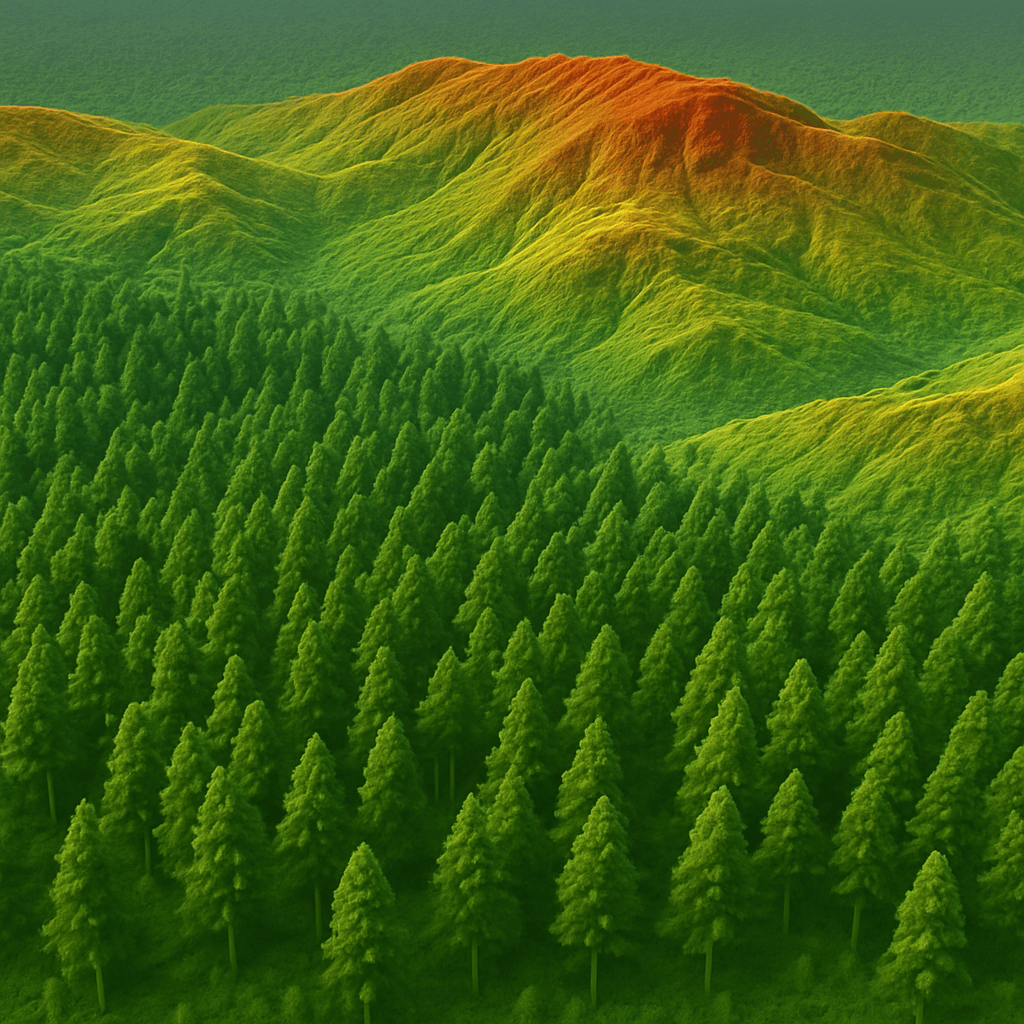
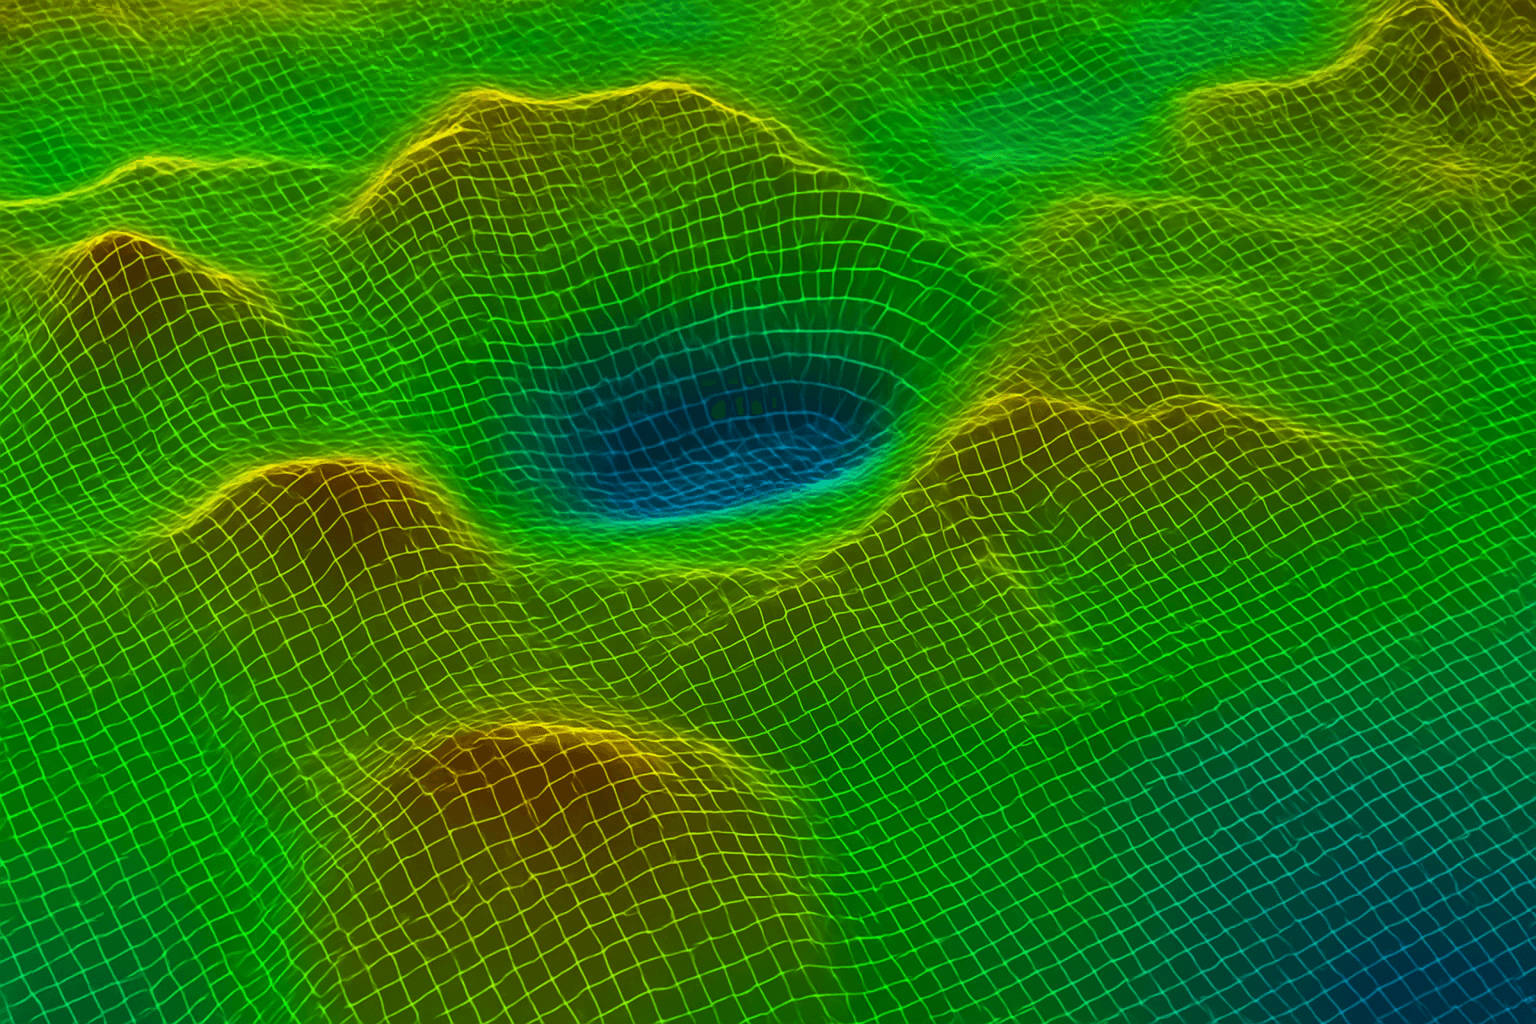
Digital Elevation Models (DEMs) are digital three-dimensional representations of the Earth’s surface that show the true shape of terrain features such as mountains, valleys, ridges, and plains. They are generated by transforming two-dimensional satellite imagery into 3D elevation intelligence, using advanced methods like optical stereoscopic collection or radar-based SAR interferometry. A DEM stores the Earth’s surface as a pixel grid, where each pixel contains an elevation value representing the height of that location above a reference point.
These elevation values are standardized to a vertical datum, typically based on mean sea level. This ensures that elevation from different dates, sensors, or regions can be compared and analyzed accurately. While “DEM” is often used as a general category for elevation data, the term includes three distinct model types, each built for a different purpose:
• Digital Elevation Model (DEM)
DEM is a bare-earth elevation model that excludes surface objects such as buildings, vegetation, and infrastructure. It is essential for hydrology, geology, land use planning, and applications where only true ground height is needed.
• Digital Surface Model (DSM)
A DSM includes all visible surface features such as tree canopies, rooftops, towers, and structures. It is used for urban planning, forestry analysis, telecommunications line-of-sight studies, and aviation obstacle assessments.
• Digital Terrain Model (DTM)
DTM is a refined version of a bare-earth model that includes breaklines and terrain characteristics for higher accuracy. It forms the precision foundation for engineering design, infrastructure routing, contour mapping, and advanced cartographic work.
Elevation models are also classified based on how they are collected and delivered:
• Strip DEMs
Created from a single satellite pass or “strip.” They are localized, highly accurate, and fast to deliver, making them ideal for emergency response, mining site analysis, and rapid feasibility studies.
• Mosaic DEMs
Created by stitching multiple strips into a seamless elevation layer. They provide consistent regional or national coverage and are used for smart city planning, infrastructure networks, watershed management, and digital twin environments.
Stereo DEMs are created from two satellite images of the same location, captured from different viewing angles. By using both forward and backward perspectives, the processor reconstructs a 3D surface model with reduced risk of missing terrain details. This method is widely used for ground-level elevation extraction because stereo imaging faces fewer obstructions and performs well in most environments. It is highly effective for city mapping, infrastructure planning, engineering surveys, and terrain interpretation. However, in complex environments like mine sites, volcanic regions, and glaciers—where sub-surface or partially obscured features exist—near-nadir imaging is often required to enhance visibility and improve elevation accuracy.
Tri-stereo DEMs deliver higher 3D accuracy than standard stereo models by using three images instead of two. These images are captured nearly simultaneously from backward, forward, and near-nadir angles. This multi-angle geometry improves vertical precision, enhances height extraction, and eliminates the risk of blind spots behind tall structures or rugged terrain. Tri-stereo collection is ideal for areas with steep slopes, dense urban blocks, or critical engineering work, providing more reliable elevation values, clearer surface interpretation, and superior detail retention compared to traditional stereo pairs.

Digital Elevation Models (DEMs) are created by converting raw remote sensing data into three-dimensional views of the Earth’s bare surface. This process starts by capturing terrain information from satellites, aircraft, or LiDAR platforms and then using mathematical models to calculate the height of every point on the ground. A single normal optical image cannot capture depth on its own, so specialized imaging methods are required to record elevation from multiple angles.
The main technologies used to create DEMs include:
• Optical Stereoscopic Collection (Photogrammetry)
This is the most common method for satellite-based DEMs. It captures two or more images of the same location from different viewing angles during a single orbital pass. By analyzing the visual differences between the image pair, software calculates ground height based on parallax. Stereo photogrammetry can come from satellite, aircraft, or drone platforms. Modern high-resolution XRTech satellite systems collect stereo images within 45 to 90 seconds of each other which helps maintain consistency and improves elevation accuracy.
• Radar Interferometry (InSAR)
Radar satellites such as the LT-1 constellation send out microwave pulses and record how they reflect back from the surface. By comparing the phase difference between two radar signals captured from slightly different satellite positions, the system can calculate elevation and surface movement. By comparing the phase difference between two radar signals (interferometry), systems can detect surface movements and generate global 1:50,000 scale DEMs with millimeter-level accuracy. InSAR works day or night and through clouds which makes it reliable for global mapping. This approach was also used during the SRTM mission that mapped most of Earth with consistent elevation coverage.
• LiDAR (Light Detection and Ranging)
LiDAR uses laser pulses to measure height with extremely high accuracy. Satellites like GF-7 combine optical capture with a laser altimeter to improve vertical precision in mountains and uneven terrain. LiDAR produces millions of elevation measurement points known as a point cloud. This is later converted into a smooth grid and used for engineering, infrastructure, and high-detail city modeling. Under the right conditions, LiDAR can reach centimeter-level vertical accuracy.
After collection, the data goes through a structured processing pipeline to turn it into a usable DEM:
Precision Pre-Processing
Atmospheric effects, cloud cover, and shadows are corrected to make the raw data accurate and consistent.
Homonymous Contour Pairing
AI systems match visual contours between left and right stereo images to confirm identical locations and remove mismatches.
Elevation Correction
If an object appears in both images, software adjusts the building or terrain polygon to the point where both outlines match. This point becomes the correct elevation value.
Interpolation Algorithms
Because no sensor can capture every single surface point, interpolation fills the gaps between known measurements to create a complete and seamless surface model.
Digital Surface Models (DSMs) are three-dimensional digital representations of the Earth’s surface that include the elevation of all natural and man-made features. Unlike Digital Elevation Models (DEMs), which represent only the bare ground, a DSM captures the height of vegetation, buildings, roads, infrastructure, and any elevated structure. A DSM represents the first surface visible from above, meaning it shows the top of whatever the sensor detects. In a forest, this is the tree canopy. In a city, this is the rooftop level. Only in open terrain does a DSM match the actual ground height.
DSMs are created using high-resolution satellite imagery from multi-sensor constellations and advanced processing systems that combine optical stereoscopic collection and radar (SAR) data. This allows DSMs to reveal height, volume, and structure details that are invisible in standard 2D images.
DSMs include complete surface detail and are engineered for professional use in planning, design, modeling, and simulation. Key technical characteristics include:
High-Resolution Satellite Sources: Generated from satellite constellations with more than 130 imaging platforms that provide repeated coverage and multiple observation angles.
Engineering-Grade Grid Resolution: Professional DSMs typically feature cell spacing of 2 to 10 meters, allowing detailed elevation modeling for development, planning, and asset monitoring.
Vertical Accuracy: Average accuracy lands at ±3m vertical RMSE (Root Mean Square Error), which aligns with engineering, surveying, and hydrology requirements for modern projects.
Data Type: DSMs capture the first return surface, which includes vegetation layers, rooftop heights, towers, bridges, utility lines, canopy structure, and any other object above ground.
3D Spatial Context: Multiple revisits and angled captures provide a true 3D surface perspective that supports height extraction, obstruction analysis, and shadow modeling.
Digital Surface Models are essential wherever above-ground features impact planning, safety, signal flow, structural assessment, or environmental modeling. Core industry applications include:
Used to build Digital Twins and high-resolution 3D city models
Supports zoning studies, redevelopment planning, and urban growth monitoring
Enables AI building contour extraction to detect new construction and unauthorized expansions
RF propagation modeling for 4G, 5G, and microwave links
Identifies building and vegetation obstructions that block communication signals
Helps engineers optimize transmitter placement and ensure maximum network coverage
DSM combined with a DTM extracts accurate building heights across entire cities
Used for real estate modeling, solar feasibility studies, and skyline analysis
Runway approach zone analysis to identify obstacle heights
Ensures safe landing corridors and compliance with aviation safety regulations
Used for pre-construction terrain assessments and infrastructure routing
Supports cut-and-fill calculations, slope grading, and structural placement
Models port environments, breakwaters, docks, and shoreline elevation
Supports emergency planning and coastal hazard readiness
Creates realistic 3D training environments
Supports line-of-sight analysis, tactical planning, and reconnaissance modeling
Measures tree canopy height and density for timber value assessment
Monitors ecological change, biomass estimation, and vegetation encroachment
Tracks damage after storms, floods, or earthquakes
Predicts impact zones by modeling how structures redirect water and wind
Supports evacuation route planning and hazard communication strategies
Digital Terrain Models (DTMs) are advanced elevation datasets that represent the Earth’s bare-earth surface without any above-ground objects. All buildings, trees, vehicles, power lines, and other structures are removed through classification and processing, revealing the true underlying terrain. DTMs provide a clear view of landform shapes, slopes, and natural ground elevation, making them essential for engineering, hydrology, infrastructure routing, and topographic analysis.
DTMs are typically created from high-resolution satellite imagery, optical stereo pairs, Synthetic Aperture Radar (SAR), and LiDAR-supported datasets. In dense urban areas, the difference between DSMs and DTMs becomes noticeable. A DSM may show the top of a skyscraper, while the DTM shows the ground level sometimes hundreds of meters below. This is why DTMs are considered the primary foundation for technical, engineering-grade decision-making and cartographic accuracy.
Different elevation models serve different purposes, and the key distinction comes down to what each model includes:
Digital Surface Model (DSM): Represents the elevation of everything on the surface. It includes vegetation, buildings, towers, bridges, utility lines, and other above-ground features.
Digital Terrain Model (DTM): Represents the bare-earth terrain only. All surface objects are removed so the output reflects the true surface topography, ground shape, and elevation.
DTMs are therefore more suitable for applications that depend on accurate ground readings rather than visible surface height.
An nDSM (Normalized Digital Surface Model) is created when the DSM and DTM are compared to extract the height of objects above the ground. The formula is:
DSM – DTM = nDSM
This measurement reveals the true height of structures. For example:
A 15-meter tree canopy appears as 15 meters in the nDSM
A 50-meter building shows its actual height rather than its elevation above sea level
This makes nDSMs extremely useful for:
Forestry: Tree height and canopy density calculation across large landscapes
Urban planning: Measuring building heights for zoning and 3D model compliance
Vegetation management: Identifying trees encroaching on power lines or roadway corridors
Change detection: Tracking new construction, land development, and vertical growth patterns
The nDSM bridges the gap between DSM and DTM by focusing only on the structural height of visible objects, which makes it valuable for planning and regulatory uses.
DTMs are required in any industry where ground conditions and elevation control performance, cost, and safety. Core applications include:
Hydrology and Watershed Modeling: DTMs identify water flow paths, flood zones, drainage networks, and watershed boundaries. Since water travels along the ground surface, bare-earth models are required for accurate flood prediction.
Civil Engineering and Construction: Used to design roads, railways, pipelines, tunnels, embankments, and foundations. DTM data supports cut-and-fill volume calculations, slope stability assessment, and route optimization.
Utilities and Corridor Planning: Enables safe and efficient placement of pipelines, transmission lines, and fiber routes by analyzing ground shape, gradient, and elevation profiles to reduce environmental disruption.
Mining, Oil, and Gas Exploration: Helps survey terrain for well siting, geological fault mapping, pit design, haul road routing, and pre-excavation planning before on-site operations begin.
Topographic Cartography: DTMs form the base layer for contour mapping, topographic charts, elevation profiles, and geospatial map production.
Flood and Coastal Modeling: DSMs can misrepresent flow by showing rooftops as barriers. DTMs correctly identify where water actually moves across the landscape at ground level, which is essential for flood resilience planning.
The quality and accuracy of a Digital Elevation Model (DEM) depends on how closely the digital terrain surface matches the real world. This accuracy is important for engineering, hydrology, construction, environmental modeling, mining, and land development, because even minor elevation errors can lead to design failures, drainage problems, unsafe structures, and costly project delays. High-quality DEMs allow planners, engineers, and analysts to make reliable decisions based on real ground conditions instead of approximate data.
Engineering-grade DEMs are evaluated through measurable technical standards:
Vertical Accuracy: High-quality models provide a vertical Root Mean Square Error (RMSE) of around ±3 meters, which is the expected range for professional commercial-grade DEMs used in land development and civil engineering.
Resolution (Grid Spacing): Horizontal grid spacing for advanced DEMs typically ranges between 2 to 10 meters, allowing detailed surface representation and precise elevation modeling.
Global Reliability: Unlike public or legacy datasets that may have gaps or low precision, high-resolution DEMs sourced from commercial satellites deliver consistent results even in remote or politically restricted regions.
Consistency Across Terrain: Quality DEMs maintain accuracy over mountains, valleys, forests, and built-up cities by adjusting for shadows, vegetation cover, and steep slopes.
Multiple environmental, technical, and algorithmic factors influence how accurate a DEM can be. The creation method directly shapes data precision, resolution, and reliability.
The technology used to capture elevation information determines the accuracy level:
| Method | Typical Accuracy | Best Use Case |
|---|---|---|
| LiDAR | 5–15 cm vertical accuracy | Highest precision; urban engineering, vegetation penetration, small sites |
| Stereo Photogrammetry | 30 cm to 1 m vertical accuracy | High-resolution mapping, infrastructure, mining, urban planning |
| InSAR (Radar Interferometry) | Several meters to tens of meters depending on baseline and wavelength | Large-area mapping, all-weather coverage, regional surveys |
| Ground Surveying | Excellent accuracy but limited coverage | Small, critical engineering sites, legal boundary surveys |
LiDAR delivers the best accuracy because it creates dense point clouds and measures elevation directly.
Stereo imagery depends on viewing angles, pixel resolution, and precise matching of stereo pairs.
InSAR works through clouds and at night, which is useful for long-term deformation monitoring and regional datasets.
Ground surveys are the most accurate but not scalable for large areas.
DEM data is structured as a pixel grid. Each pixel stores one elevation value.
Smaller pixels = more detail.
Larger pixels = less detail and missing terrain features.
A 10m pixel DEM can capture slopes, roadbeds, and riverbanks accurately, while a 90m pixel DEM may miss narrow valleys, small ridges, or site-specific changes.
Example:
A 30m resolution DEM cannot detect a 5m gully, but a 1m resolution model will capture it clearly.
Sampling density refers to how many elevation points are collected during acquisition:
Higher density = sharper representation of terrain
Lower density = missing ridges, shapes, or sudden elevation edges
LiDAR and high-resolution stereo satellites collect significantly more points than standard optical sensors, which reduces elevation uncertainty.
Sensors do not record every inch of the Earth. Interpolation fills the missing gaps. Good interpolation maintains true landform shape. Poor interpolation creates problems, such as:
Flat plateaus where hills should exist
Artificial slopes where land is naturally level
Incorrect flood paths in hydrological modeling
Accurate algorithms preserve curves, ridges, peaks, valleys, and transitional slopes so the model reflects real-world forms.
Spatial Resolution: Distance between each sample point on the ground. Determines how finely terrain can be mapped.
Vertical Resolution: Minimum detectable change in elevation. Controls height precision.
Vertical resolution is critical for:
Flood prediction
Slope stability analysis
Cut-and-fill calculations
Pipeline and transmission corridor planning
The accuracy hierarchy is:
LiDAR > High-Resolution Stereo > InSAR > Low-Resolution Optical Sources
Combining multiple sensors increases reliability. Optical stereo + SAR fusion can reveal both visible terrain and hidden elevation patterns, creating “true 3D models” with depth that 2D imagery cannot provide.
Errors can occur during capture or processing. These impact DEM reliability if not corrected:
Atmospheric / Ionospheric Interference: Delays radar and optical signals, affecting phase readings and image geometry.
Cloud Cover: Blocks optical stereo capture and creates data voids in shadowed or obscured areas.
Vegetation Penetration Differences: LiDAR penetrates tree cover to measure ground; photogrammetry measures canopy height instead.
Co-Registration Errors: Misalignment between stereo image pairs reduces elevation consistency.
Processing Artifacts: Poor interpolation, edge effects, or gaps introduce artificial peaks, pits, and flat surfaces.
If these are not corrected, DEM outputs may misrepresent slopes, flood paths, drainage networks, or terrain profiles, which leads to incorrect modeling.
Vertical errors in a Digital Elevation Model (DEM) are differences between the recorded elevation and the actual ground height. These errors affect how accurately terrain is represented in engineering, hydrology, construction, and land-use analysis. Professional-grade DEMs usually target a vertical Root Mean Square Error (RMSE) of about ±3 meters, but this accuracy can vary based on data source, resolution, and terrain conditions.
Sinks (Depressions or Pits)
Sinks are low points surrounded by higher elevation cells. Some sinks are natural, especially in glacial, karst, or basin landscapes. However, many sinks are artificial and appear because of missing data, low sampling density, or poor interpolation.
In a 30-meter resolution DEM, around 1% of elevation cells may contain artificial sinks.
In 90-meter or three-arc-second datasets, artificial sink frequency can increase to 5% or more, especially in rugged or forested regions.
Peaks (Spikes)
Peaks are raised elevation points surrounded by lower elevation values. Most peaks are natural, caused by ridges, cliffs, boulders, or building rooftops visible in DSMs. Peaks are generally less problematic than sinks but can interfere with volumetric calculations or slope analysis if left uncorrected.
Striping Artifacts
Striping errors appear as repetitive lines or patterns caused by sampling inconsistencies during data collection. These are most visible in flat terrain where elevation is stored as integer values instead of floating-point numbers. Striping can distort slope readings and produce false drainage patterns in hydrological analysis.
Terrain Roughness
Steep slopes, cliffs, deep valleys, and ridgelines are harder to capture accurately. DEMs with poor resolution tend to smooth these features, reducing true elevation detail and increasing error.
Sampling Density and Grid Resolution
DEM accuracy decreases when fewer points are collected or when grid cells are too large.
A 2 to 10 meter pixel grid captures landforms accurately for engineering.
A 30 to 90 meter pixel grid may miss narrow ravines, roadbeds, retaining walls, and drainage features.
Environmental Interference
Atmospheric distortion, shadows, cloud cover, and vegetation can block sensor visibility. LiDAR can penetrate forest canopy, but optical stereo imagery records only canopy height, which can shift elevation data.
Sensor and Processing Limitations
Misalignment between stereo image pairs, weak interpolation algorithms, or poor orthorectification can create elevation gaps and distort true ground height.
Advanced elevation sensing systems are used to lower vertical error levels and create more reliable Digital Elevation Models (DEMs). These technologies improve accuracy, reduce distortion, and ensure the data reflects the true terrain surface, especially in engineering-grade applications.
Laser Altimetry
Satellites such as the GF-7 use a dual-linear CCD camera paired with a laser altimeter to increase the accuracy of ground elevation points. This is especially important in steep or mountainous regions where traditional optical stereo methods struggle to capture height changes.
Interferometric SAR (InSAR)
InSAR technology analyzes phase differences between radar signals to measure elevation and movement. While standard DEMs aim for about 3 meters vertical accuracy, InSAR can detect deformation as small as 1 to 2 millimeters, making it valuable for monitoring dams, bridges, pipelines, rail corridors, and subsidence zones.
Off-Nadir Angle (ONA) Control
Improved vertical precision can be achieved by requesting specific viewing angles during satellite tasking. An Off Nadir Angle of 10 degrees or less helps minimize distortion and improve height extraction, although lower angles often increase project cost due to higher tasking priority.
TanDEM-X Benchmarking
Specialized missions like TanDEM-X have reached global vertical accuracy levels of approximately 2 meters, setting a reference point for professional and defense-grade elevation models.
Vertical accuracy is essential for applications where water flow, elevation change, or slope stability affect real-world outcomes. A DEM must be free of artificial depressions and spikes to be reliable for hydrological modeling. When sinks remain in the data, simulated water flow becomes trapped, causing incorrect watershed boundaries, false flow paths, and inaccurate flood predictions.
Before running hydrological models, most GIS workflows include preprocessing steps to:
Identify sinks and evaluate their spatial distribution
Fill sinks to produce a depressionless DEM
Measure sink depth to determine whether they are natural features or artifacts
Create a continuous flow surface for accurate drainage and accumulation modeling
This preprocessing is mandatory for flood modeling, water resource analysis, urban drainage planning, dam break simulations, and climate impact studies.
Relying on inaccurate or low-resolution public terrain data introduces risks for industries that depend on precision. Insufficient vertical accuracy leads to:
Incorrect road, rail, and pipeline routing
Miscalculated cut-and-fill volume estimates
Unreliable floodplain and watershed boundaries
Engineering redesign costs and project delays
Legal or compliance issues in regulated infrastructure sectors
For this reason, professional work typically requires satellite stereo, InSAR, or LiDAR-based DEMs rather than low-resolution public datasets.
Digital Elevation Models (DEMs) are used across almost every industry that depends on spatial data. They add a vertical dimension to mapping, analysis, and decision-making. This elevation intelligence makes it possible to study terrain behavior, model natural processes, and plan large-scale infrastructure with accuracy that 2D imagery cannot provide.
Elevation data is the foundation of hydrological analysis because water always flows according to terrain shape.
DEMs are used to:
Run flow direction and flow accumulation analysis to map drainage paths
Delineate watersheds and basin boundaries for water management
Model flood inundation zones for storm surge, rainfall, and sea-level rise scenarios
Extract river and stream networks from elevation-based flow patterns
High-resolution DTMs are essential here because bare-earth elevation is required for accurate results. Low-quality public DEMs often miss floodplain details, causing incorrect predictions. In critical coastal areas, LiDAR and commercial stereo-derived DEMs provide the necessary precision for adaptation planning.
Infrastructure design depends on accurate topographic data to avoid structural and financial risks.
DEMs support:
Route optimization for roads, railways, transmission lines, and pipelines
Cut-and-fill volume calculations for project budgeting and machinery allocation
Line-of-sight analysis for telecom towers and radio infrastructure
Slope stability assessments in landslide-prone corridors
With a DEM, thousands of potential route alternatives can be analyzed before any ground survey takes place, lowering costs and environmental impact.
Mining projects rely on current elevation models for operational control and regulatory compliance.
DEMs enable:
Volumetric measurement of stockpiles, ore extraction, and waste dumps
Pit progression tracking and comparison of planned vs executed excavation
Haul road slope and route planning to optimize fuel and machinery use
Rehabilitation tracking to document environmental recovery over time
Time-series DEMs built from repeated satellite collections provide evidence for reporting and financial calculations.
Terrain has a direct impact on soil behavior, irrigation, and crop performance. DEMs support precision agriculture by defining how water and nutrients move across land.
DEMs are used for:
Creating management zones based on slope, aspect, and microtopography
Designing drainage and tile systems for waterlogged fields
Modeling erosion risk and runoff patterns
Planning irrigation flow, sprinkler placement, and field leveling
By understanding micro-elevation differences, farmers reduce losses, save water, and increase yield.
Cities operate in three dimensions, and elevation models make that third dimension measurable.
DEMs enable:
3D city modeling and Digital Twin development
Height extraction by subtracting DTM from DSM to calculate building heights
Viewshed analysis to study visual impact of construction or towers
Solar suitability mapping for rooftop installations and energy planning
Urban drainage and green infrastructure planning
These datasets support both city expansion and regulatory monitoring of unauthorized construction.
DEMs offer essential elevation context for ecological and natural resource studies.
They are used for:
Landslide and slope failure detection
Coastal erosion mapping and shoreline retreat modeling
Forest canopy height extraction from DSM minus DTM for biomass studies
Habitat mapping where species depend on elevation, aspect, or slope profiles
This elevation data supports conservation, climate adaptation, and environmental risk reduction.
After a natural disaster, elevation change reveals hidden impacts that optical imagery alone cannot show.
DEMs support:
Earthquake deformation analysis and ground displacement detection
Landslide volume and impact zone modeling
Volcanic cone or lava dome height tracking
Infrastructure failure assessment for bridges, roads, and structures
Fast stereo tasking after an event produces a new DEM for ground comparison and response coordination.
Bare-earth elevation models reveal what vegetation and time have hidden.
DTMs are used for:
Identifying buried historical structures
Mapping ancient irrigation systems, roads, and settlement layouts
Reconstructing historical landscapes for research
Locating excavation targets before fieldwork begins
These methods discovered ancient Mayan cities hidden under jungle canopy that were invisible in traditional aerial images.
Elevation exposes the structure of the Earth and ongoing tectonic processes.
DEMs are used for:
Identifying fault lines, volcanic systems, and rift zones
Mapping erosion and deposition patterns over time
Studying crustal deformation in active seismic regions
Understanding long-term landscape evolution and terrain formation
Example: DEMs of the East African Rift show the continent splitting and forming new future ocean basins.
DEMs are required to correct raw satellite images by removing distortion caused by terrain relief.
They enable:
Seamless mosaicking of images across large regions
Accurate measurements of distance, area, and location
Reliable change detection between dates
Proper alignment with GIS layers and base maps
Without a DEM, imagery in mountainous regions becomes stretched, misaligned, and unusable for analysis.
Free Digital Elevation Models (DEMs) are available from multiple global sources, ranging from free government missions to high-accuracy commercial datasets. These sources include satellite missions, radar programs, LiDAR collections, and public archives. Choosing the right dataset depends on the required accuracy, spatial coverage, budget, and the technical demands of your project.
Free global datasets are widely used for regional planning and general analysis, while commercial datasets provide higher accuracy for engineering, infrastructure, mining, and regulatory work.
The SRTM mission was operated using the Space Shuttle Endeavour during February 2000. The shuttle orbited Earth 16 times per day for 11 days, capturing global elevation data using Interferometric Synthetic Aperture Radar.
Coverage: Approximately 80 percent of the global land surface, from 60°N to 56°S latitude
Resolution: 1 arc-second (about 30 meters) globally; originally 90 meters outside the United States but the 30-meter dataset is now fully released
Acquisition Method: InSAR using two radar antennas separated by a 60-meter mast to measure phase difference and calculate elevation
Vertical Accuracy: Less than 16 meters absolute vertical error for most regions
Access: Available for free through USGS Earth Explorer
Pros:
Free and globally available
Standardized methodology with strong documentation
Reliable baseline for general topographic analysis
Cons:
Data is more than 25 years old and does not reflect modern development
Moderate spatial detail with gaps in steep terrain and high mountain zones
Not suitable for precise engineering work that requires sub-meter accuracy
SRTM is still one of the most used DEM sources worldwide because of its consistency and global coverage, despite its age.
ASTER GDEM is produced by NASA and Japan’s Ministry of Economy, Trade and Industry (METI). The stereo elevation data is generated from the Terra satellite, which captures dual-view imagery using nadir and backward-looking optical telescopes.
Coverage: Approximately 80 percent of global land area, from 83°N to 83°S
Resolution: 1 arc-second (about 30 meters), suitable for mapping large regions
Acquisition Method: Optical stereo imaging that detects elevation from parallax between paired images
Versions Available:
GDEM Version 2 (2011) with broad coverage
GDEM Version 3 (2019) with improved void filling, water correction, and fewer artifacts
Access: Free download through NASA Earthdata and USGS Earth Explorer
Pros:
Free and publicly available
Better performance in rugged, mountainous regions than SRTM
More recent in certain zones and higher detail in steep topography
Cons:
Cloud contamination and atmospheric issues create artifacts in tropical regions
Variable accuracy because the data depends on image clarity at the time of capture
Can be less reliable than SRTM for flat or low-relief landscapes
ASTER GDEM Version 3 is significantly improved, especially for environmental and mountain-region studies, and is commonly used for terrain modeling when cost-free data is required.
ALOS World 3D is a global Digital Surface Model (DSM) produced by the Japan Aerospace Exploration Agency (JAXA). It is generated from the PRISM sensor on the Advanced Land Observing Satellite (ALOS), which captures stereo optical imagery to calculate elevation with consistent accuracy.
Coverage: Global land coverage across most continents and populated regions
Resolution: 30 meters (1 arc-second) as a free dataset, and a premium 5 meter commercial version for higher accuracy
Acquisition Method: PRISM stereo optical imaging for global elevation extraction
Acquisition Timeline: 2006 to 2011, providing a more recent alternative to early 2000s datasets like SRTM
Access: Requires free user registration through JAXA’s Earth Observation Research Center portal
Pros:
More recent elevation capture than SRTM
Better void filling and fewer gaps than ASTER
Strong performance in steep and mountainous terrain
Cons:
Requires account registration before downloading
Data is about 15 years old and may not reflect new construction or landscape change
ALOS World 3D is now one of the most trusted free global datasets for researchers, planners, and GIS users who need consistent elevation coverage across borders.
Copernicus EU DEM is a freely accessible elevation model created by the European Space Agency (ESA) for regional and international mapping. It is based on a combination of SAR data and optical sources to improve seamless coverage.
Coverage: Europe and near-regional partners, with partial international expansion
Resolution: 25 meter and 10 meter versions depending on region and licensing tier
Acquisition Method: Radar-based elevation data fusion from Copernicus Sentinel missions
Access: Free through the Copernicus Open Access Hub or ESA data portal
Pros:
Higher resolution than many global public DEMs
Strong accuracy for engineering and environmental applications
Excellent for hydrology, urban planning, and terrain analysis
Cons:
Primarily focused on Europe rather than global coverage
Licensing terms vary for commercial republishing
The Copernicus EU DEM is now a go-to free source when users need a step up in precision from SRTM or ASTER, especially for scientific and city-planning projects.
While free global datasets like the Space Shuttle Radar Topography Mission (SRTM) or ASTER GDEM provide useful baseline information for research, education, and general mapping, they often lack the precision and update frequency required for professional use. When projects require engineering-grade accuracy, real-time monitoring, or visibility through atmospheric and environmental obstructions, commercial high-resolution elevation data becomes essential.
Publicly available Digital Elevation Models (DEMs) generally offer a horizontal resolution between 30 and 90 meters. This can be insufficient for infrastructure planning, engineering design, and decision-making in sensitive environments. Common limitations include:
• Inaccurate vertical measurements: Free models typically cannot deliver the ±3m RMSE accuracy needed for engineering, construction, or hydrology
• Outdated datasets: Many archives do not reflect recent urban expansion, new infrastructure, mining activity, or post-disaster terrain change
• Cloud and atmospheric interference: Optical sensors like ASTER GDEM may contain visible artifacts, cloud shadows, or missing data in high-humidity and mountainous regions
• Undefined product categories: Many free datasets do not clearly separate DSM (Surface) and DTM (Terrain), which complicates modeling, analysis, and volumetric calculations
• Limited change detection value: Older datasets cannot support accurate comparisons when measuring terrain deformation, coastal erosion, or construction growth
These constraints make free DEMs suitable for early feasibility review but unsuitable for precision-dependent industries.
Commercial providers like XRTech Group and China Siwei maintain high-revisit satellite constellations capable of delivering sub-meter clarity and task-based data acquisition. These systems provide elevation and surface intelligence at a resolution as sharp as 0.3m per pixel.
Key optical resources include:
• SuperView Neo-1: 0.3m resolution with high revisit frequency, used for intelligence mapping, digital twins, and engineering visualization
• SuperView-2: 0.4m resolution with eight multispectral bands, including Red Edge for crop health, soil stress detection, and agricultural disease analysis
• GF-7: Mapping-grade satellite equipped with a laser altimeter to improve elevation accuracy in mountainous or complex terrain
These satellites are prioritized when vertical accuracy, clarity, and current data are required for technical decisions.
Some environments cannot be captured with standard optical satellites. For these cases, advanced commercial sensors provide critical operational intelligence:
• SAR (Synthetic Aperture Radar): Satellites such as GF-3 (1m resolution) and LT-1 (3m resolution) create their own illumination and operate regardless of weather, smoke, or darkness. SAR is essential for maritime monitoring, emergency response, and surface deformation analysis
• Hyperspectral Imaging: Platforms such as Khaza’in analyze hundreds of narrow wavelength bands to identify mineral signatures. This supports geological exploration for resources like copper, lithium, phosphate, and gold, removing the need for continuous ground sampling
These capabilities outperform any publicly available dataset when clarity and penetrative sensing are required.
Commercial elevation solutions are built for operational use where timing and accuracy influence cost, safety, and outcome:
• On-Demand Tasking: New Collection, Priority, and Emergency Collection services acquire imagery within hours for critical monitoring and response
• Engineering-Grade Accuracy: Surface and terrain models are produced to a vertical accuracy of ±3m RMSE, meeting hydrology, design, and land development standards
• Value-Added Products: Outputs include Digital Orthophoto Maps (DOM), Tri-Stereo 3D models, 3D City Models, and Digital Twins for long-term management of infrastructure and urban assets
Commercial systems therefore provide the precision, timeliness, and reliability that free elevation datasets cannot supply.
If you are deciding between free datasets, commercial satellite DEMs, or custom tasking, XRTech Group can help you choose the right solution for your accuracy, coverage area, time sensitivity, and budget. Our team evaluates technical specifications, vertical accuracy needs, and operational goals to match your project with the correct data source.
We support organizations that want reliable results from the start by providing:
• Assessment of existing elevation data coverage and quality for your Area of Interest
• Access to archive stereoscopic satellite imagery for photogrammetric DEM and DTM extraction
• Coordination of custom stereo tasking missions for urgent or engineering-grade projects
• Support with value-added products including 3D city models, digital twins, and terrain intelligence
• Connections to processing partners for DEM, DSM, and DTM generation services at defined accuracy levels
If you need clarity on what dataset is suitable before investing in field surveys or design work, XRTech Group provides guidance backed by satellite expertise and operational experience. Contact us now!
Tailings Dam Monitoring: How Advanced Satellite Intelligence Is Transforming Tailings Dam Safety Tailings dams are among the most critical—and high-risk—structures
From Visible Light to Spectral Intelligence in Modern Satellite Remote Sensing Satellite imaging has moved beyond photography. For decades, Earth