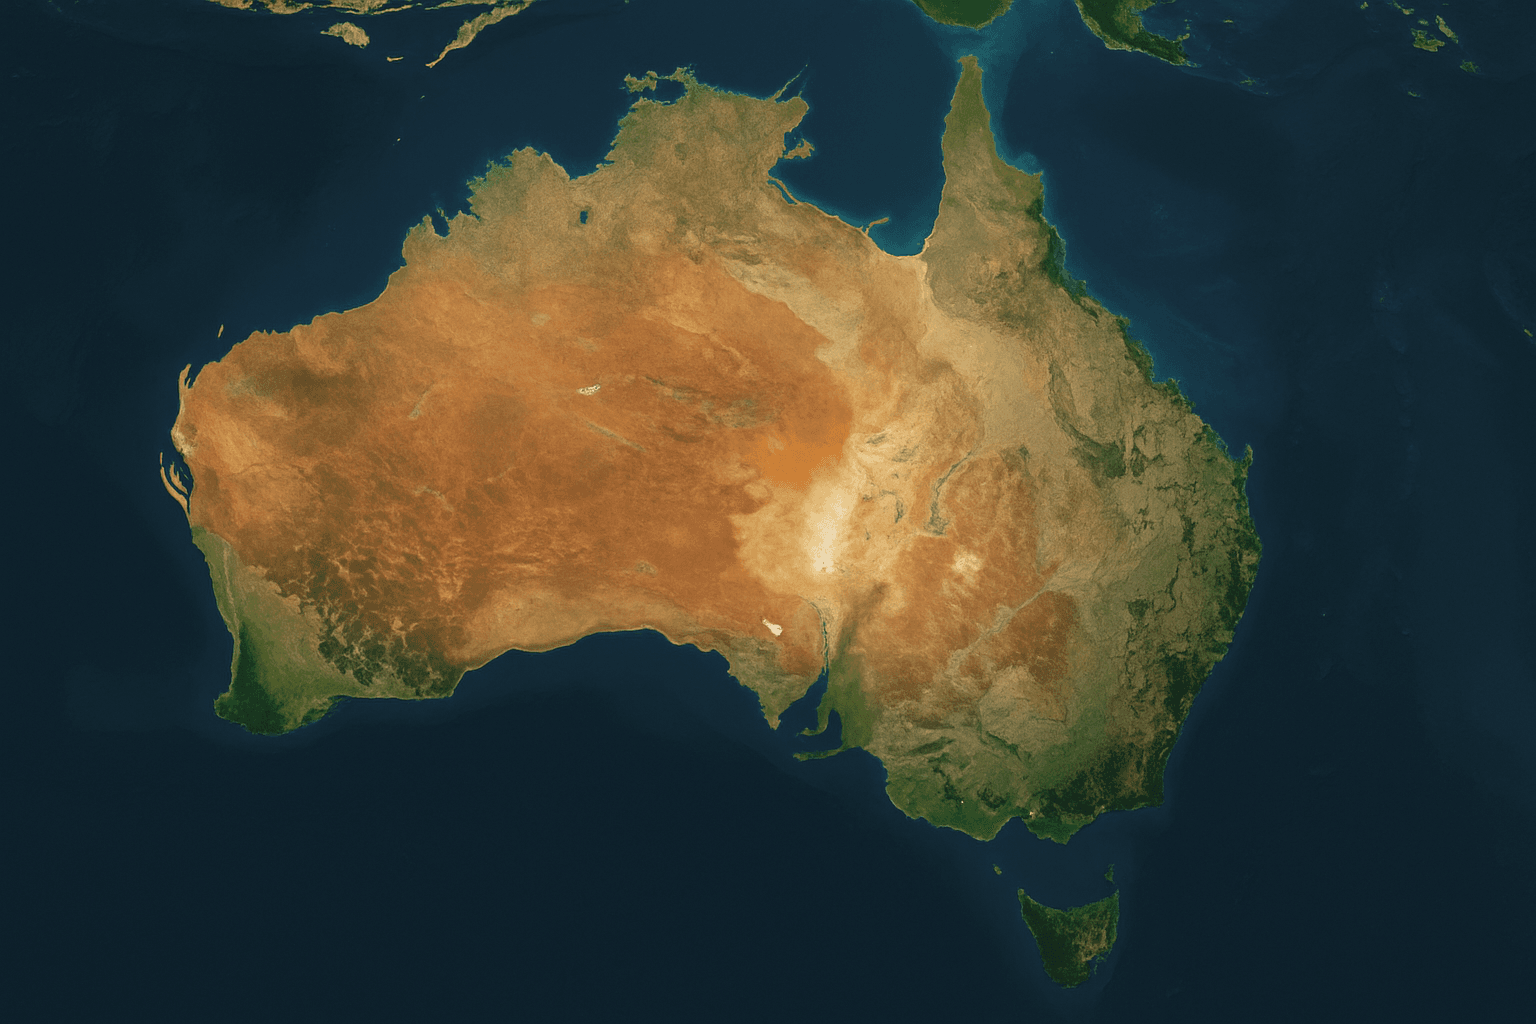
Satellite View of
Australia
View high-resolution satellite imagery across Australia's 7.7 million km². Visualize, compare, and analyze optical and radar data on the go.
Order Australia Imagery
Fill the form · Feasibility check · Quote within 24h
Request Submitted
Your request has been sent to admin@xrtechgroup.com. We'll respond within 24 hours with a formal quote and a free sample tile for your AOI.
No areas drawn yet. Use the draw tools on the map.
Spam-protected · Confidential · Free sample tile with quote
| Tier | Resolution | Archive | Tasking | Priority |
|---|---|---|---|---|
| Super HR | 30 cm | $20 | $30 | $45 |
| Very HR | 31–50 cm | $13 | $20 | $37 |
| High R | 51–80 cm | $5 | $8 | — |
| Moderate | 2 m | $1 | $2 | — |
| SAR / Hyper | 30–50 m | Custom quote | ||
Min: 25 km² archive · 100 km² tasking. Stereo +50%. Emergency +100–165%.
Free sample tile included with every formal quote.
Why Satellite Imagery of Australia
Is in a Category of Its Own
Australia spans six time zones, holds the world's largest contiguous arid zone, and sits atop one of the most mineral-rich geological formations on the planet. Ground access to large parts of the interior is seasonal at best. Getting accurate spatial data here has always been difficult — until now.
Vast, Remote Interior
Over 70% of Australia is classified as arid or semi-arid. The Outback spans more than 5 million km², with some areas unreachable by road for months after wet seasons. A satellite pass covers more in 90 minutes than a ground team covers in a year.
World-Class Mineral Deposits
Australia is the world's largest producer of lithium, holds the third-largest iron ore reserves, and is a top-5 producer of gold, copper, nickel and uranium. Identifying and monitoring these deposits requires spectral analysis that only hyperspectral satellites can deliver at scale.
Fragile, Unique Ecosystems
Australia has the highest rate of mammal extinction of any continent. Its ecosystems need consistent, repeat monitoring. Satellite imagery tracks biomass change, fire scars, and habitat loss at a scale no other method can match.
25,760 km of Coastline
Australia's coastline is longer than most countries' entire borders. Monitoring sea-level impact, coastal erosion, kelp forest extent, and illegal fishing at this scale requires regular wide-swath satellite passes — not sporadic drone flights.
Wildfire and Climate Risk
The 2019–2020 fire season burned over 18 million hectares — an area larger than England. Real-time SAR radar imagery that sees through smoke is the only tool capable of tracking fire fronts and supporting recovery planning at continental scale.
Agricultural Heartland
Australian agriculture covers over 426 million hectares. Crop health, soil moisture, irrigation efficiency and yield forecasting across this area requires multispectral and hyperspectral satellite data updated weekly — something ground sensors and drones cannot deliver economically.
The Mapping Options Available to You
and Why the Decision Matters
When a mine extension needs approval, a lithium prospect needs delineating, or a bushfire recovery needs documenting, you need accurate spatial data fast. Choosing the wrong method costs time, money, and in some cases the opportunity itself.
Ground survey teams are the gold standard for small areas requiring centimetre-level precision. For everything else, the maths simply does not work. A 10-person survey team covering 200 km² per month costs well over $500,000 per year. For a 50,000 km² project area — common in Western Australian mineral exploration — that is decades of work.
Drones improved things for areas up to 20–50 km². Beyond that, regulatory requirements, battery limitations, and the need to relocate aircraft make them impractical. In remote Australia, logistics costs often exceed the survey itself.
Satellites remove both constraints. A single tasking order covers your entire project area in one pass. No site access, no weather delays for optical data, no expensive mobilisation. And with 130+ satellites, there is rarely a wait of more than 1–5 days for a fresh acquisition.
| Method | Area per Day | Cost per km² | Turnaround | Remote Access | Cloud / Night | Spectral Bands | Best Fit |
|---|---|---|---|---|---|---|---|
| Ground Survey | 2–5 km² | $200–$2,000+ | Months–Years | Requires Access | No | None | Precision benchmarks |
| LiDAR Aircraft | 500–2,000 km² | $50–$200 | Weeks | Limited | No | None | DEM, forestry |
| Drone Survey | 10–50 km² | $20–$100 | Days–Weeks | Requires Crew | No | Up to 5 | Small sites |
| Satellite — Archive | Unlimited | $1–$20 | 24–48 Hours | No Access Needed | Optical Only | Up to 330 | Change detection, baseline |
| Satellite — New Tasking | Unlimited | $2–$80 | 1–5 Days | No Access Needed | Optical Only | Up to 330 | Monitoring, compliance |
| Satellite — SAR Radar | Unlimited | Custom | 1–3 Days | No Access Needed | Works Through Cloud | 12 SAR Modes | Mining, flood, deformation |
Which Resolution Do You Actually Need
for Your Australian Project?
Resolution determines what you can and cannot see. Picking the wrong tier either wastes budget on detail you don't need, or leaves you unable to answer the question your project requires.
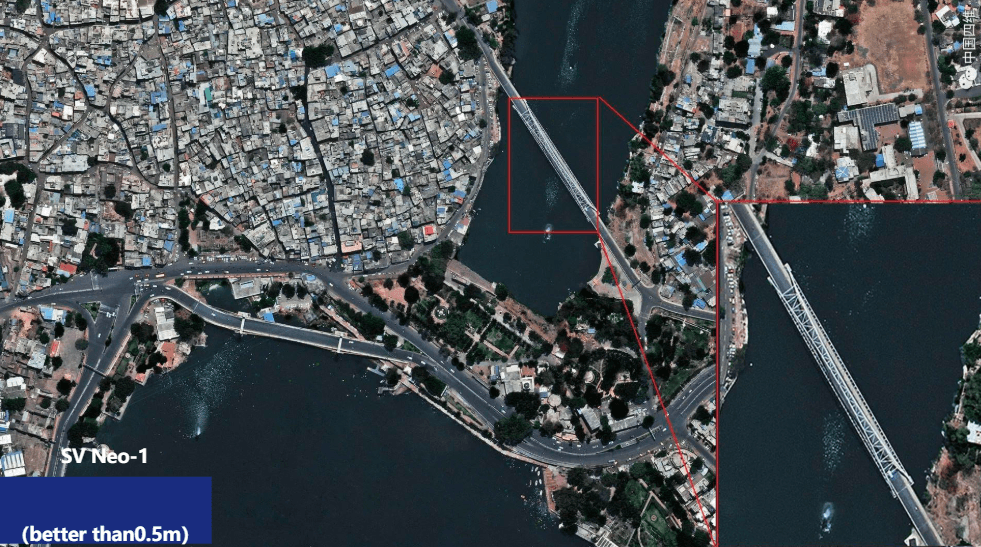
- Individual vehicles and road markings visible
- Property boundary mapping
- Mine pit wall and bench monitoring
- Infrastructure asset inspection
- 3D city model generation (stereo)
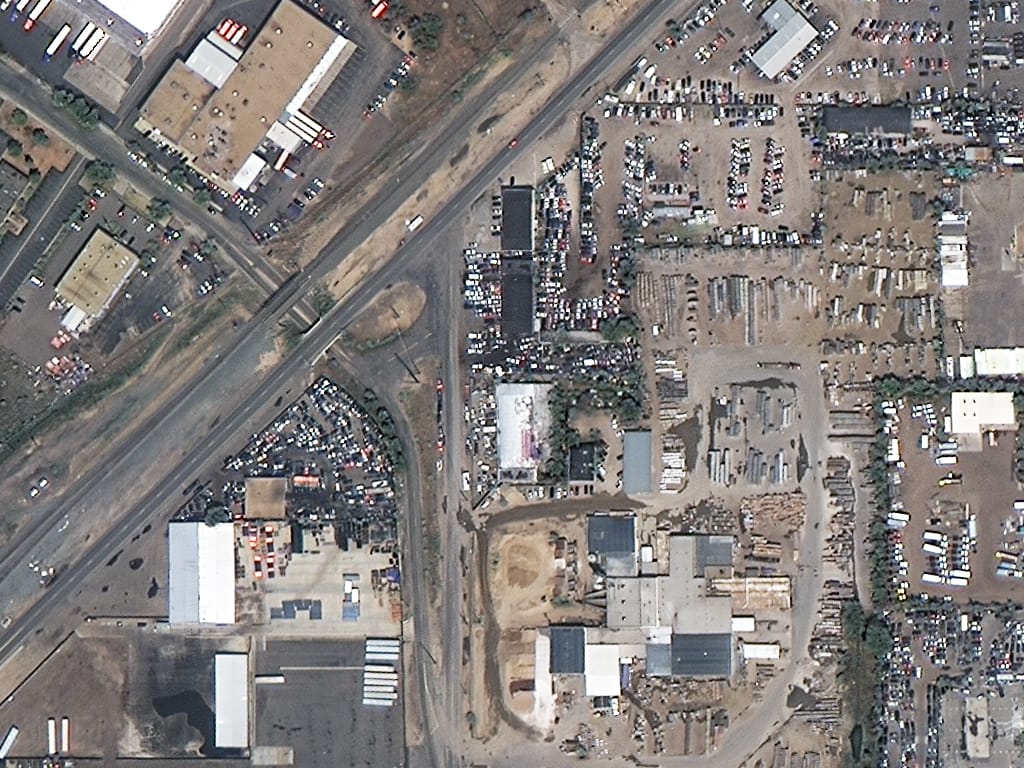
- Large mine site monitoring
- Agriculture field-level analysis
- Environmental impact assessment
- Urban planning and development
- Infrastructure project tracking
- 1:10,000 scale topographic mapping
- DEM and DSM generation
- Regional land use mapping
- Cadastral boundary verification
- National-scale land cover change
- Broad agricultural monitoring
- Vegetation and biomass mapping
- Wide-area change detection surveys
- Mineral and geological mapping
- Gold and lithium alteration zones
- Carbon stock assessment
- Crop species classification
- Water and soil contamination detection
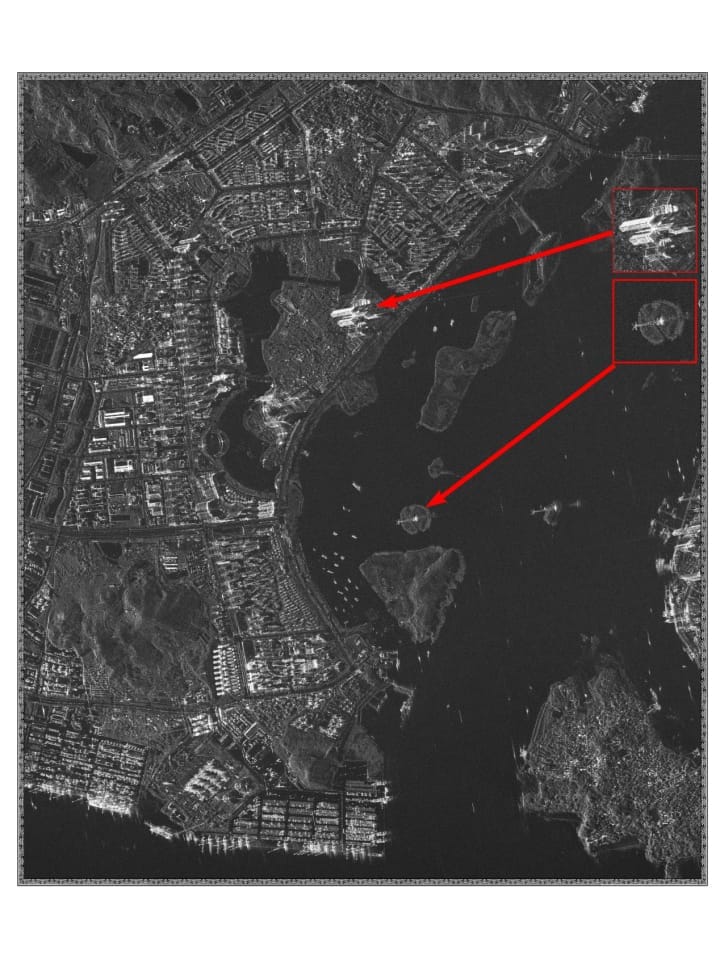
- All-weather, day and night acquisition
- Mine subsidence and ground deformation
- Flood mapping through cloud cover
- Maritime vessel monitoring
- Dam wall and infrastructure monitoring
Who Uses Satellite Imagery in Australia
From a single mine operator needing a monthly compliance image to a government agency running a national land monitoring program, XRTech's fleet and pricing structure is built to serve every scale of need.
Gold. Copper. Lithium.
Seen from Space Before You Set Foot on Site.
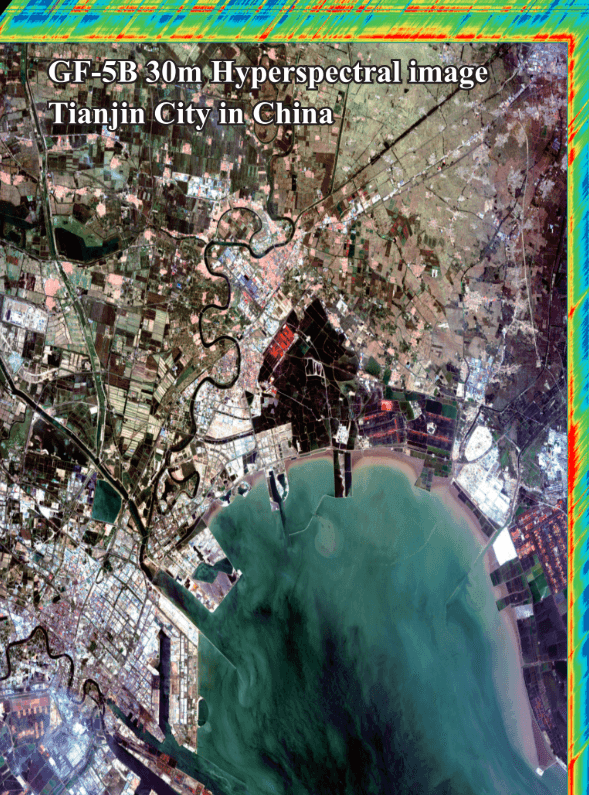
Australia's Pilbara, Yilgarn Craton, and Olympic Dam regions hold some of the most significant mineral deposits ever discovered. XRTech's hyperspectral satellites capture 166 to 330 spectral bands — each one revealing chemical and mineralogical signatures invisible to the human eye or standard cameras.
- 🏅Gold Exploration: Iron oxide and clay mineral assemblages (kaolinite, chlorite, carbonate) associated with Archaean gold systems are directly mappable from GF-5 and ZY-1 02D hyperspectral data. Identify the alteration halo before drilling a single hole.
- 🔶Copper Porphyry Systems: Phyllic and potassic alteration zones produce distinct SWIR spectral signatures at 2.0–2.35 µm. Satellite hyperspectral data maps these zones across thousands of km² in a single acquisition.
- ⚡Lithium and Pegmatites: Spodumene-bearing pegmatites in the Pilgangoora and Greenbushes districts show distinctive spectral contrast against surrounding granite. Repeat imaging tracks weathering profiles used to estimate deposit geometry.
- 🌱Carbon and Environmental Compliance: GF-5's atmospheric sensors measure CO₂ and CH₄ directly. Combined with biomass indices, XRTech provides a complete carbon baseline and change-detection service for carbon credit programs and mining rehabilitation compliance.
- 💧Acid Mine Drainage: Ferruginous and sulphate-bearing drainage plumes from tailings storage facilities are detectable in VNIR and SWIR bands. Satellite monitoring replaces expensive periodic sampling programs with a continuous remote sensing layer.
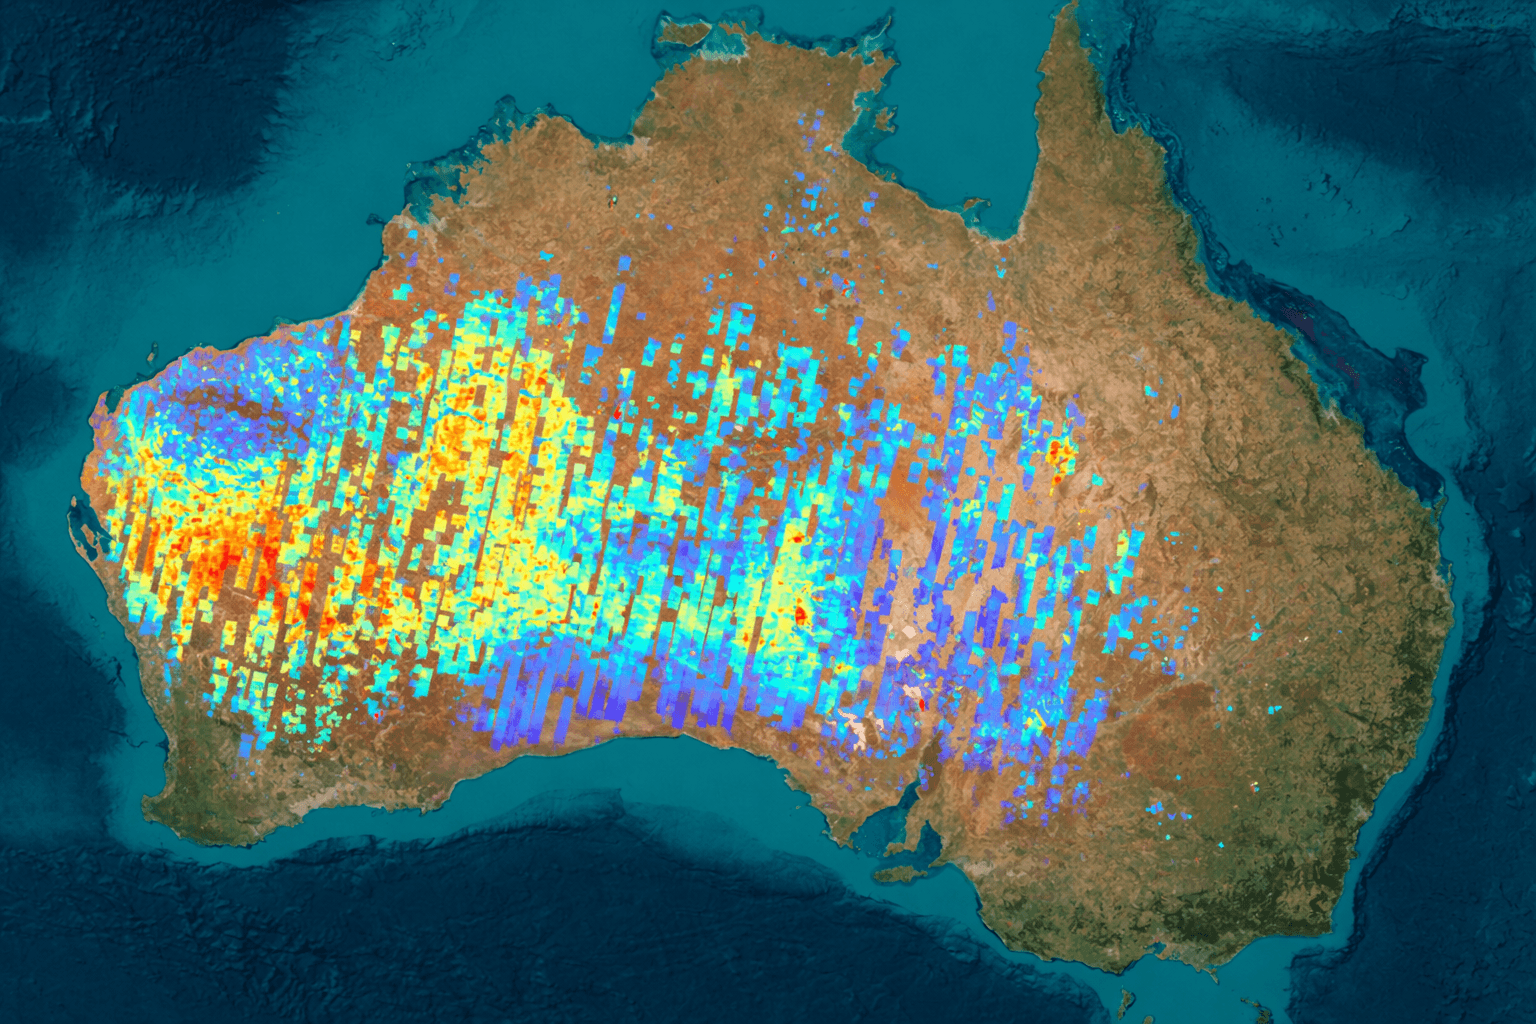
Detectable Minerals via Satellite
3D Elevation Data for Australia's
Most Demanding Terrain Challenges
Australia's terrain is deceptively complex — from the Pilbara's ancient gorge systems and the Snowy Mountains' alpine ridges to the Murray–Darling Basin's vast floodplains and the Kimberley's dissected plateau. Flat-image satellite data tells you what is there. Elevation models tell you how it behaves — where water flows, where ground collapses, where roads can be built, and where communities face flood risk.
XRTech delivers three core elevation product types from its stereo satellite fleet, each serving different project requirements. Unlike airborne LiDAR — which requires costly mobilisation, restricted airspace approvals, and extended capture campaigns — satellite-derived elevation models cover tens of thousands of square kilometres in a single stereo acquisition, delivered in under 21 days from order.
For Australian mining, engineering, and hydrology projects, our elevation products are validated against surveyed control points and delivered with guaranteed vertical accuracy specifications. The GF-7 satellite's integrated laser altimeter takes accuracy even further — providing elevation reference points that reduce reliance on ground control in remote tenements where GPS deployment is prohibitively expensive.
All XRTech DEM products are delivered in GeoTIFF format with full metadata, compatible with ArcGIS, QGIS, ERDAS Imagine, Global Mapper, and any standard GIS or CAD workflow used across the Australian surveying and engineering industry.

Represents the bare-earth surface with all above-ground features removed — vegetation, buildings, and structures are filtered out. The true ground surface beneath everything.
- Flood modelling and hydrology studies for the Murray–Darling Basin and coastal lowlands
- Slope and aspect analysis for terrain suitability assessments
- Soil erosion modelling across broad agricultural areas
- Mining rehabilitation compliance — baseline pre-disturbance terrain recording
- Bushfire risk assessment — topographic fire behaviour modelling
Captures the elevation of everything visible from above — buildings, tree canopy, power lines, and ground. Represents the first reflective surface encountered by satellite sensors.
- Urban planning and building height extraction in Australian cities
- Tree canopy height mapping for forestry and carbon inventory
- Mine stockpile and tailings volume calculations
- Infrastructure clearance analysis — powerlines, pipelines, roads
- 3D city models and digital twin input for smart city applications
An enhanced DEM incorporating breaklines, ridge lines, stream networks and spot heights — a structurally intelligent terrain representation used in engineering-grade design work.
- Road, rail, and pipeline route engineering across remote Australian terrain
- Dam design and catchment modelling in water-stressed inland regions
- 1:10,000 topographic map production (GF-7 stereo)
- National Park boundary surveys and land title determinations
- Cut-and-fill earthworks calculations for construction projects
Accuracy Specifications for Australian Projects
All vertical accuracy figures are RMSE (Root Mean Square Error) against independent check points. CE90 figures are horizontal planimetric accuracy at 90% confidence level.
How Australian Industries Use Elevation Data
From Western Australia's Pilbara ironstone ridges to Queensland's coastal floodplains, each Australian terrain type demands a specific elevation approach.
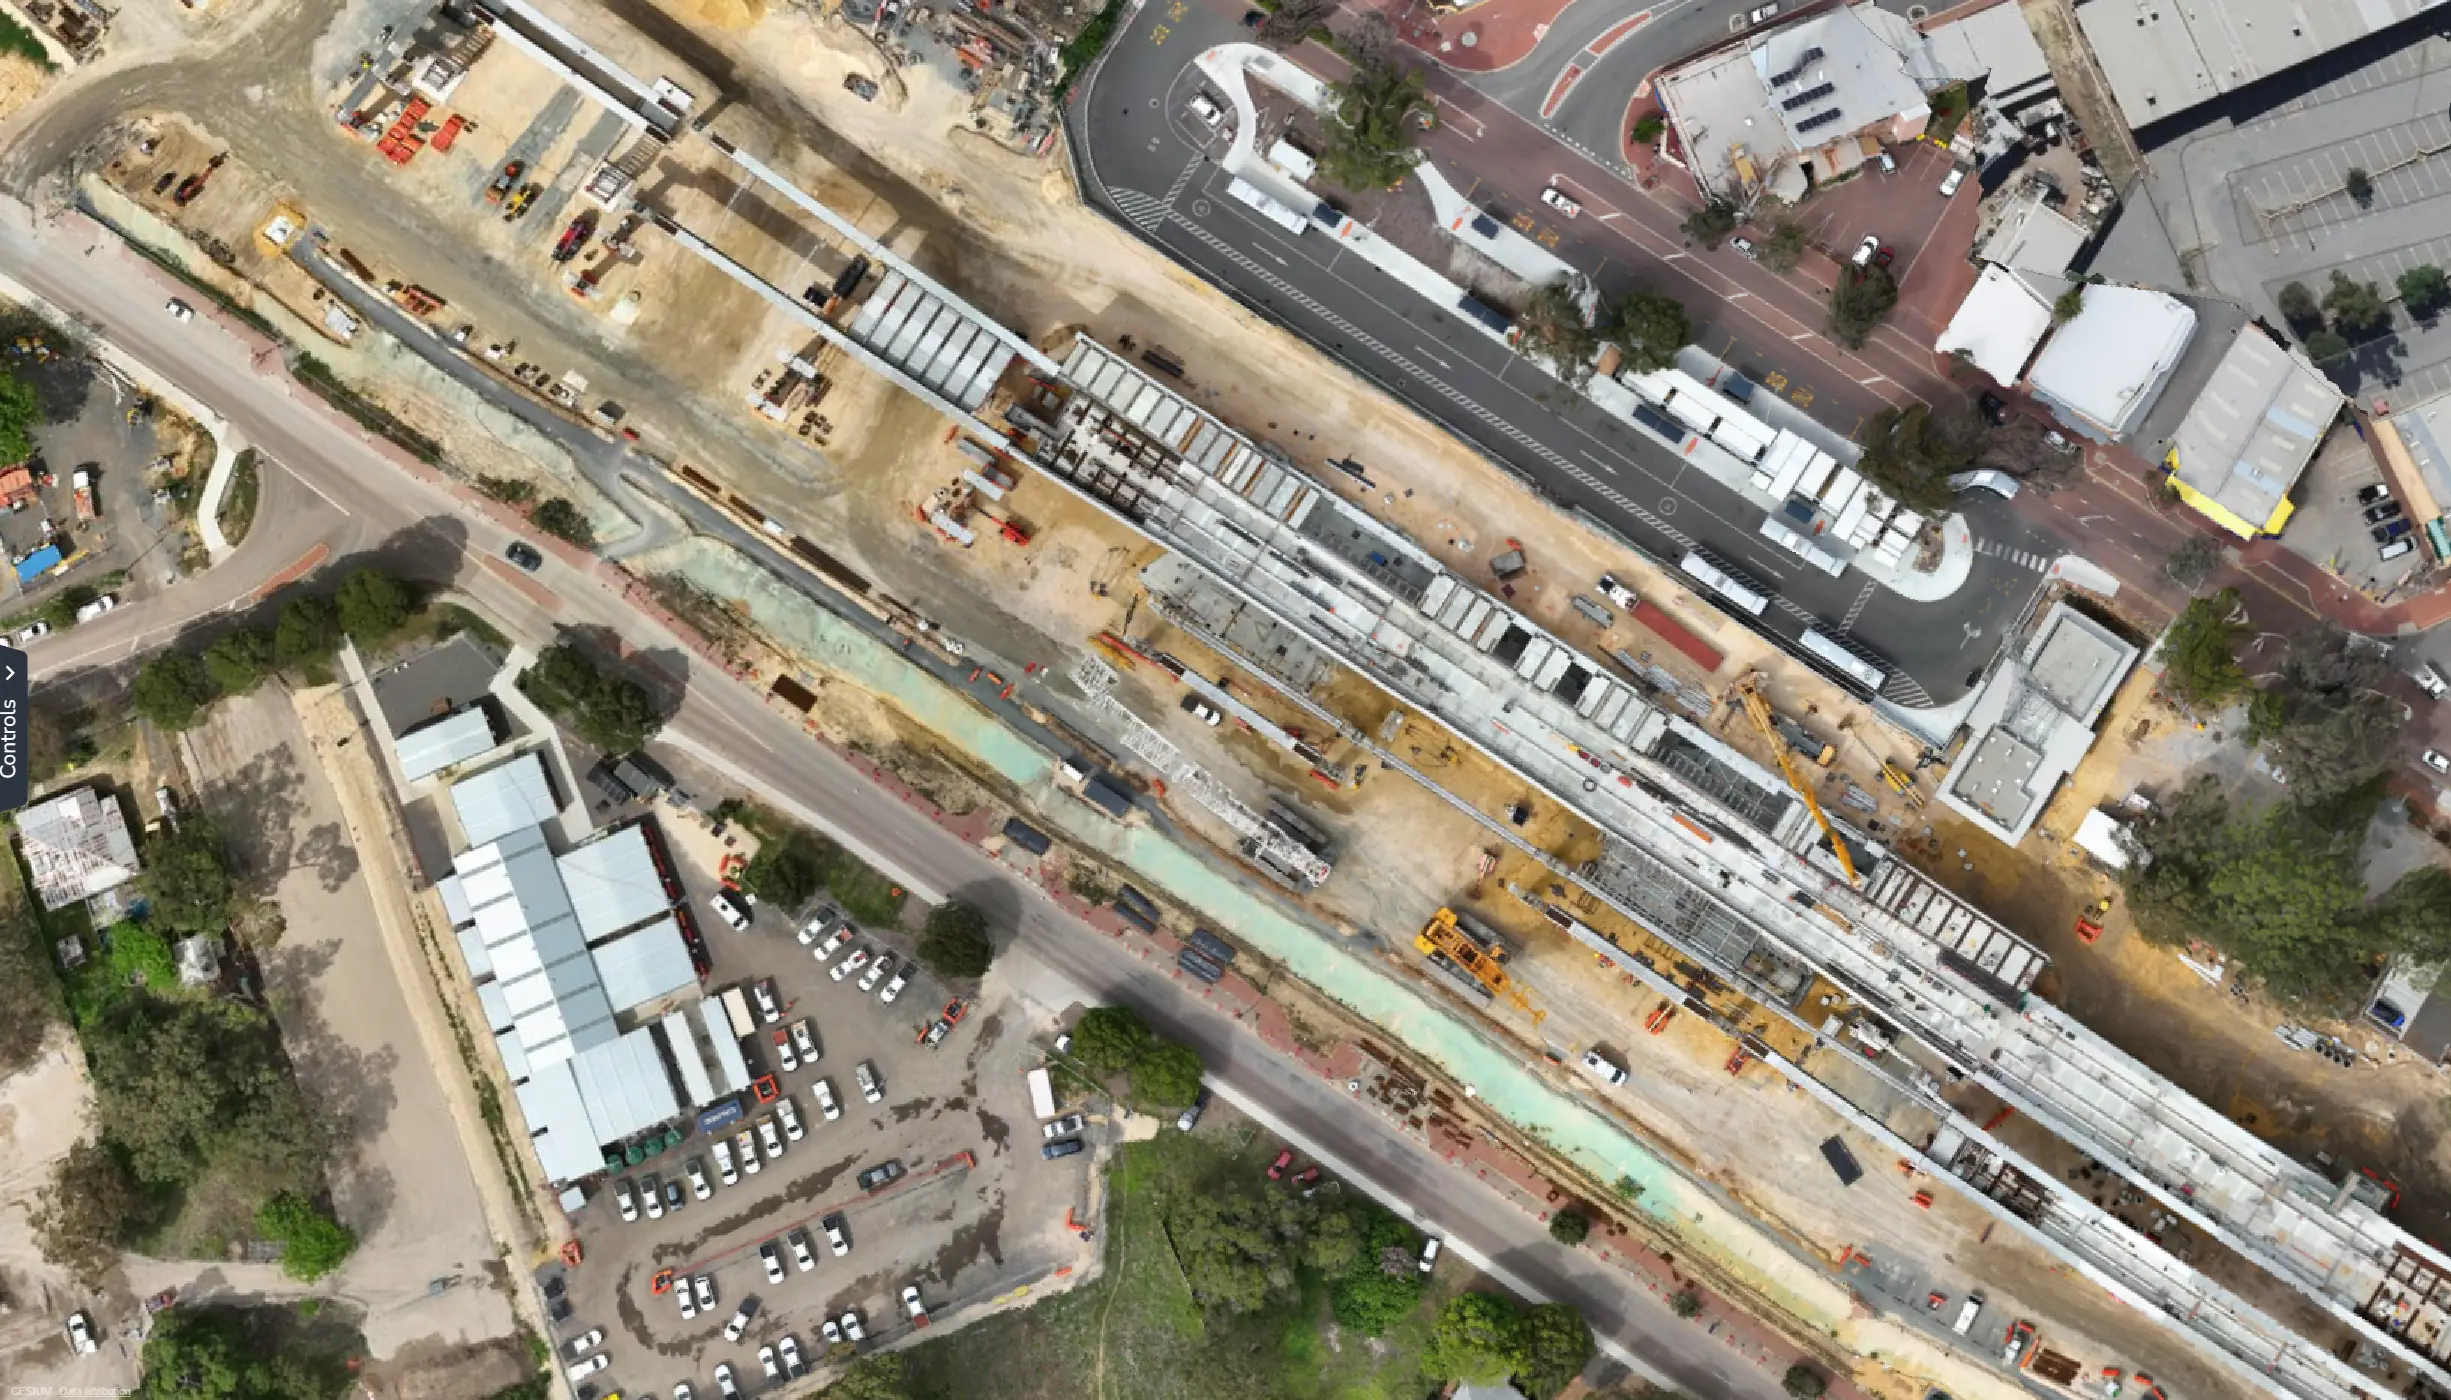
Mining — Pit Design & Volume Tracking
Open pit mines in the Pilbara and Goldfields require monthly DEM updates to calculate extracted volumes, monitor pit wall stability, and track waste dump progression. Satellite-derived DSMs replace expensive drone surveys across large mine footprints. GF-7 stereo provides 0.65m resolution suitable for bench-level analysis. LT-1 SAR InSAR adds millimetre-level subsidence monitoring between optical acquisition cycles — critical for detecting ground movement around underground operations before surface cracking appears.
Flood Modelling — Murray–Darling & Coastal Lowlands
Australia's 2022 flooding across the Murray–Darling Basin and South East Queensland demonstrated the catastrophic cost of inadequate terrain data for inundation prediction. DEM data can be feed directly into HEC-RAS, TUFLOW, and MIKE FLOOD hydraulic models used by councils, state agencies, and insurers. A 2m DEM at ±3m RMSE over a 10,000 km² catchment can be delivered in under 21 days — compared to years for equivalent LiDAR coverage — enabling rapid pre-season flood modelling updates across all at-risk Australian communities.
Agriculture — Irrigation Design & Water Harvesting
Precision irrigation across Australian grain and cotton farms requires accurate terrain slope data to design efficient water distribution layouts and identify ponding zones. A 2m satellite DEM over a 500 km² farm property costs a fraction of ground-based GPS survey, with comparable accuracy for flow-path analysis. DTMs with breaklines along drainage channels enable accurate water harvesting dam placement — increasingly critical as Australia's inland agricultural regions face more variable rainfall and higher evaporation rates under changing climate conditions.
Infrastructure — Remote Roads, Rail & Pipelines
Australia's resource industry requires tens of thousands of kilometres of access roads, rail spurs, and pipelines across terrain that may be visited by a ground survey team only once before construction. Satellite-derived DTMs provide the longitudinal profiles, cross sections, and cut-fill estimates needed for preliminary engineering design without expensive field mobilisation. The GF-7 DTM product at 1:10,000 scale is compliant with Australian surveying standards for preliminary route feasibility studies, enabling engineering teams to progress design before mobilisation approvals are in place.
Bushfire Risk — Topographic Fire Behaviour Modelling
The Phoenix RapidFire and Prometheus fire behaviour models used by Australian fire agencies require high-quality DEM inputs to simulate fire spread across ridgelines, gullies, and aspect-dependent fuel loads. Annual DEM updates covering high-risk interface zones in Victoria, NSW, and South Australia ensure fire models reflect current terrain conditions following prior-year fire damage and revegetation. XRTech can also delivers post-fire scar DSM comparisons to quantify canopy removal and model changed surface runoff patterns that elevate erosion risk in post-fire landscapes.
Urban Planning — 3D City Models & Development Assessment
Australian state and territory planning authorities are progressively requiring 3D representations of built form in development assessment submissions. XRTech DSM products can be combined with AI-based building contour extraction enable rapid generation of Level of Detail 1 and 2 (LoD1/LoD2) 3D city models for Australian urban areas at a fraction of the cost of ground-based or drone survey. Annual updates track the pace of infill development in growth corridors across Greater Sydney, South East Queensland, and Melbourne's northern and western suburbs.
| Satellite | Stereo Type | Pan Res. | DEM Spacing | Vertical Accuracy | Swath | Revisit | Best Australian Use |
|---|---|---|---|---|---|---|---|
| GF-7 | Tri-Stereo + Laser Altimeter | ≤0.65 m | 1–2 m | ≤0.5 m RMS (flat) | ≥20 km | 5 days | Mining, 1:10,000 mapping, engineering |
| ZY-3 / 02 | Tri-Stereo (Forward/Nadir/Backward) | 2.1 m | 2–5 m | ≤5 m planimetric | 51 km | 1–2 days | Flood modelling, 1:50,000 national mapping |
| Superview Neo-1 (Stereo) | Stereo pair — agile collect | 0.30 m | 0.5–1 m | CE90 ≤4 m | 12 km | Daily | Mine pit walls, urban 3D, cadastral |
| Superview-1 (Stereo) | Stereo pair — agile collect | 0.50 m | 1–2 m | CE90 9.5 m | 12 km | 1–2 days | Site planning, infrastructure corridors |
| LT-1 SAR (InSAR) | L-band interferometric SAR | 3 m | 2–5 m | mm-level deformation | 50–400 km | 4 days | Subsidence, dam monitoring, cloud-affected regions |
When to Order Optical vs SAR Imagery
Across Australia's Seasons
Cloud cover is the primary constraint on optical satellite imagery in Australia. Understanding seasonal patterns by region helps you choose the right sensor type and tasking window — and avoid delays that hold up approvals, reporting deadlines, or exploration programs.
XRTech Pro Tip: Cloud Cover Thresholds
When placing a new tasking order for cloud-affected Australian regions, specify a cloud cover threshold for your area of interest (AOI) — typically 10%, 20%, or 30% maximum. XRTech will schedule satellite passes until a qualifying acquisition is achieved. For urgent requirements over cloud-prone regions, combine SAR radar for immediate structural data with a deferred optical order to capture the first clear-weather window.
130+ Satellites. One Point of Contact.
Coverage Across All of Australia.
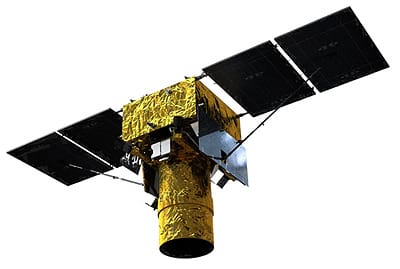
XRTech Group provides access to one of the most comprehensive commercial satellite fleets available to the Australian market. We operate across optical, SAR radar, hyperspectral and stereo DEM sensor types, giving you the right data type for every project requirement without switching providers.
Our fleet includes satellites launching as recently as 2022, meaning sensor technology, calibration standards and data quality reflect the current state of the art. When you need sub-30cm data with daily revisit over a remote Western Australian tenement, we have it. When you need all-weather SAR over a flooded inland basin, we have that too.
Every acquisition is supported by a human team who understands Australian project requirements, timeline pressures, and the specific technical needs of mining, agriculture, and environmental sectors.
Fleet also includes GF-2, GF-4, GF-6, GF-1 series, LT-1 L-band SAR, ZY-1 02D hyperspectral, ZY-3 stereo, CBERS-04, HJ-1 disaster monitoring constellation and more. View full fleet specs →
Satellite Imagery Australia Pricing
No Hidden Fees. Pay Only for What You Need.
All pricing is in USD per km². Minimum order is 25 km² for archive imagery and 100 km² for new tasking. Every formal quote includes a free sample tile for your specific area of interest.
- Archive$20/km²
- New Tasking$30/km²
- Priority$45/km²
- Emergency$80/km²
- Stereo$60/km²
- Tri-Stereo$90/km²
- Archive$13/km²
- New Tasking$20/km²
- Priority$37/km²
- Emergency$66/km²
- Stereo$40/km²
- Tri-Stereo$60/km²
- Archive$5/km²
- New Tasking$8/km²
- PriorityOn request
- Archive$1/km²
- New Tasking$2/km²
- DEM ArchiveFrom $5/km²
- SAR New TaskingCustom quote
- Hyper New TaskingCustom quote
Minimum order: 25 km² archive · 100 km² new tasking. Stereo adds 50%. Emergency adds 100–165%.
Free sample tile included with every formal quote. All prices USD, ex. taxes.
What Makes XRTech the Right Partner
for Satellite Imagery in Australia
There are a handful of satellite imagery providers operating in Australia. Here is why the companies and agencies we work with stay with us.
One Fleet, Every Data Type
Most providers specialise in one sensor type. XRTech covers optical, SAR radar, hyperspectral, stereo DEM, and thermal — all from a single contract. You don't have to manage four providers to get the data your project actually needs.
Speed That Matches Your Decisions
Archive delivery in 24–48 hours. New tasking in 1–5 days. Emergency tasking within 24 hours where feasible. Waiting weeks for imagery means missing the window that mattered.
Transparent, Scalable Pricing
Archive from $1/km², 30cm from $20/km². No hidden licensing, no per-seat fees, no annual subscription traps. You pay for the data you order and own what you receive.
Australia-Focused Service
We understand Australian project requirements — from DPIE compliance imagery to JORC-compliant resource reporting. Our team speaks your industry's language.
Latest Satellite Technology
Superview Neo-1 launched 2022. LT-1 L-band SAR launched 2022. GF-5B hyperspectral launched 2021. You're getting data from current-generation hardware, not repurposed decade-old sensors.
Free Sample with Every Quote
Before you commit, we provide a free sample tile covering your specific area of interest. You evaluate actual data quality over your actual project area — not a promotional image from somewhere else.
How Fast Can You Get Satellite Imagery of Australia?
Every project has a decision point. An approvals deadline. A board presentation. A regulatory submission. Here is exactly what to expect from XRTech.
Delivery delays due to cloud cover affect optical imagery only and are most common over northern Australia during the wet season (October to April).
SAR radar and existing archive imagery are not affected by cloud conditions.
Satellite Imagery Australia — Frequently Asked Questions
Questions we get from Australian mining companies, government agencies, agricultural businesses and environmental consultants every week.
Ready to Get Satellite View of Your
Australian Project Area?
Draw your area of interest, select resolution and capture type, and receive a detailed feasibility check and formal quote within 24 hours — with a free sample tile included.