Satellite Gold Map Identifies 140 ha of Priority Land in Africa
A mining company needed to screen a large licensed exploration block in East Africa without committing to a full ground campaign. XRTech Group delivered a satellite-based gold prospectivity map using Landsat imagery, spectral analysis, and proprietary deep learning in weeks, not months.
Gold mineral exploration, East Africa. XRTech Group used satellite remote sensing to narrow a 6,183 ha licensed exploration block to 140 priority hectares, directing ground investigation to where spectral and structural evidence of hydrothermal gold systems converges.
XRTech Group conducted a satellite-based gold prospectivity assessment over a 6,183 ha licensed exploration block in East Africa. Using calibrated Landsat multispectral imagery, spectral band analysis, hydrothermal alteration mapping, structural interpretation, and a proprietary machine learning classification platform, the analysis identified approximately 140 hectares of Moderate to Very High prospectivity, concentrated in the southeastern sector of the block where multiple independent indicators converge. The highest-priority zone covers 15.5 ha where iron oxide signatures, clay alteration responses, and structural lineament intersections coincide.
Project Overview
A mining company holding a licensed exploration block in East Africa needed to prioritise ground investigation across a large, arid terrain without committing significant capital before a single drill target was identified. XRTech Group was engaged to deliver a satellite-based prospectivity screen to direct that investment efficiently.
The block covers approximately 6,183 hectares and was analysed using calibrated Landsat multi-spectral satellite imagery in conjunction with spectral band analysis, hydrothermal alteration mapping, structural interpretation, and XRTech's proprietary machine learning classification platform.
The analysis indicates that the block carries meaningful geochemical and structural signals consistent with hydrothermal gold systems. Approximately 15.5 hectares (0.25% of the block) exhibit the strongest combined indicators: elevated iron oxide signatures, clay-alteration responses, and favourable structural positioning, classified as High to Very High probability. A further 38.5 hectares (0.62%) fall within the Moderate-High tier, and an additional 85.8 hectares (1.39%) within the Moderate tier. Combined, approximately 140 hectares represent the total priority target area.
The highest concentration of anomalous signatures is located in the southeastern sector of the block, where multiple independent indicators converge spatially. This convergence is the most geologically meaningful outcome of the analysis.
| Prospectivity Class | Area (ha) | % of Block |
|---|---|---|
| Very High + High | 15.5 | 0.25% |
| Moderate-High | 38.5 | 0.62% |
| Moderate | 85.8 | 1.39% |
| Low-Moderate | 615.3 | 9.95% |
| Low / Background | 3,427.9 | 97.74% |
The terrain is characterised by arid to semi-arid conditions with exposed bedrock, sparse vegetation cover, and a network of dry drainage channels (wadis). The low vegetation density across most of the block is advantageous for remote sensing mineral analysis, as it minimises spectral interference from plant cover when interpreting rock and soil signatures.
Analytical Methodology
A seven-stage spectral and structural workflow was applied to calibrated Landsat satellite imagery. Specific algorithmic parameters and proprietary processing methods are not disclosed. The stages are described at a functional level below.
Iron Oxide Detection
A visible-band spectral ratio was applied to identify zones of elevated iron oxide concentration. In hydrothermal gold systems, iron oxides, particularly goethite and hematite, form as secondary products of sulphide weathering and represent a well-established surface expression of subsurface mineralisation.
Clay and Hydrothermal Alteration Mapping
Short-wave infrared (SWIR) band ratios were used to detect hydroxyl-bearing clay minerals (kaolinite, illite, smectite) formed through hydrothermal alteration. These mineral assemblages are characteristic of epithermal and mesothermal gold deposit environments.
Lithological Differentiation
A false-colour composite using SWIR and visible bands was generated to discriminate lithological units and identify contacts between host rocks and intrusive bodies. Alteration zones and structural boundaries were traced within this composite.
Vegetation Masking
The Normalised Difference Vegetation Index (NDVI) was computed and applied as a mask to exclude vegetated pixels, ensuring that spectral signatures of interest are derived exclusively from exposed geological surfaces.
Structural Analysis
Linear features, interpreted as faults, shear zones, and fracture corridors, were mapped from the imagery. Intersections and jogs in fault systems were identified as high-priority structural traps, as gold in many deposit types preferentially precipitates at structural complexities where hydrothermal fluid flow is focused.
Drainage and Placer Screening
The wadi network was analysed for morphological features associated with placer gold concentration: meander bends, channel constrictions, and sediment traps.
Machine Learning Classification
All derived spectral indices and structural inputs were integrated using XRTech's proprietary supervised deep learning classification platform. The model produced a continuous probability output across the block, assigning each pixel a gold prospectivity score expressed as a colour-coded probability raster and a raw floating-point probability surface.
Delivered Products
Gold prospectivity classification map, raw probability surface raster, prospectivity statistics by class, three named target zones with positional descriptions, wadi drainage intersection flags, and this full assessment report.
Prospectivity Results: Area by Classification Tier
The full 6,183 ha block was classified into seven prospectivity tiers. Approximately 140 hectares (2.26% of the block) falls within the Moderate to Very High priority range.
| Prospectivity class | Area (ha) | % of block | Priority |
|---|---|---|---|
Very High |
2.6 | 0.04% | Zone 1 |
High |
12.9 | 0.21% | Zone 1 |
Moderate-High |
38.5 | 0.62% | Zone 2 |
Moderate |
85.8 | 1.39% | Zone 3 screen |
Low-Moderate |
615.3 | 9.95% | Background |
Low |
2,025.5 | 32.76% | Background |
Background / Unfavourable |
3,402.4 | 55.03% | Background |
The highest concentration of anomalous signatures is located in the southeastern sector of the block, where iron oxide response, clay alteration, and structural lineament intersections converge spatially. This convergence, covering approximately 15.5 ha of High to Very High probability, is the most geologically meaningful outcome of the analysis. Combined with the 38.5 ha Moderate-High corridor, a total of approximately 140 ha represent the full priority target area for ground follow-up.
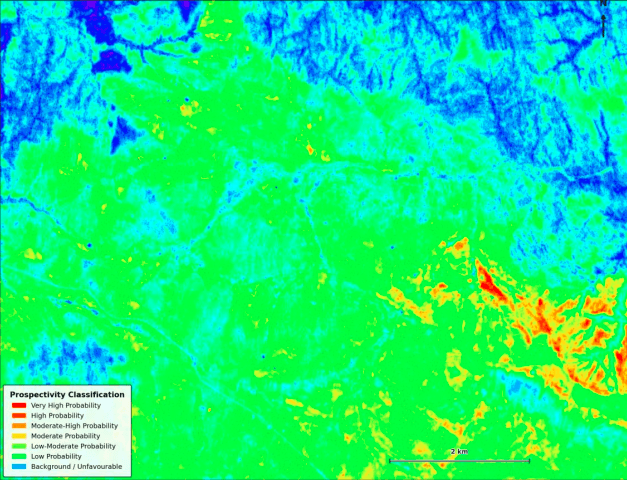
4.1 Gold Prospectivity Map
The final output is a continuous gold prospectivity map covering the full 6,183 ha block. Warm colours (red, orange, yellow) represent the highest convergence of favourable indicators; cool colours (green, cyan, blue) represent progressively fewer indicators or geological settings less consistent with gold-hosting environments.
Red = Very High, Orange = High, Yellow = Moderate, Green = Low-Moderate, Blue/Cyan = Background. Source: Landsat imagery, XRTech proprietary analysis. Warm colours in the southeastern quadrant represent the strongest convergence of iron oxide, clay alteration, and structural indicators.
4.2 Raw Probability Surface
Figure 2 displays the underlying continuous probability surface produced by the classification model. Pixel values range from 0.74 to 1.00, where higher values indicate stronger combined spectral and structural similarity to prospective environments.
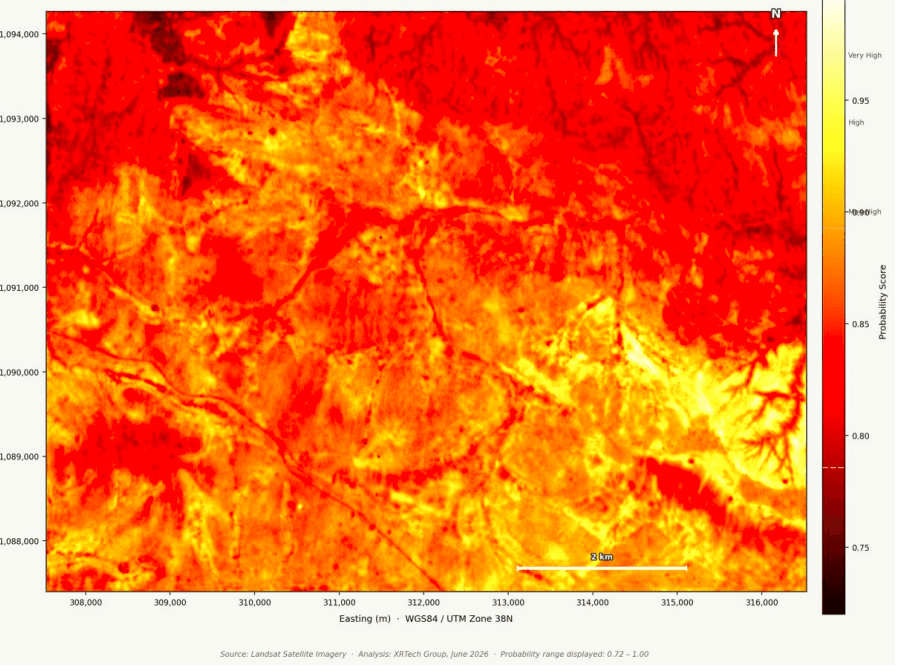
Dark = lower values (0.74); yellow/white = higher values (1.00). The continuous probability surface produced by XRTech's proprietary deep learning classification platform. Source: XRTech analysis, Landsat imagery.
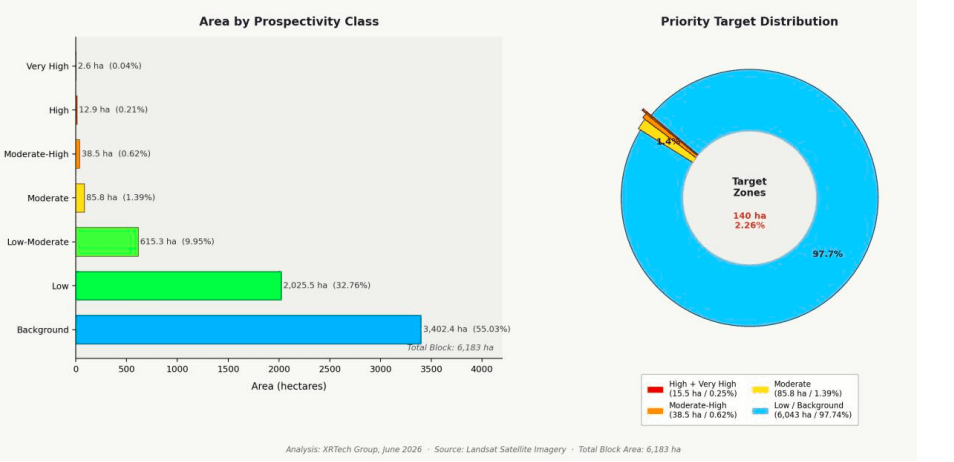
Left: area (ha) per prospectivity class. Right: priority target zones as a proportion of the total 6,183 ha block. Combined priority area (Moderate to Very High) totals 140 ha or 2.26% of the block.
Target Zones Identified
Three target zones were defined from the analysis. Zone 1 is the primary exploration target. Zone 2 is a secondary corridor. Zone 3 covers wadi drainage features for placer screening.
Zone 1: Southeastern Anomaly Cluster
Zone 2: Central-Eastern Corridor
Zone 3: Wadi Drainage Intersections
Background Interpretation
Approximately 55% of the block returns cool-colour background responses indicating minimal convergence of the prospectivity indicators applied. This does not preclude mineralisation at depth or for deposit styles not detectable at surface; it indicates that surface expression of the key indicators is absent or below detection threshold at those locations.
Limitations
This section is provided in the interest of scientific integrity and to ensure all operational decisions are made with full understanding of what remote sensing can and cannot determine.
Surface Expression Only
Remote sensing measures radiation reflected from the uppermost surface, typically the top few centimetres of exposed material. It cannot detect mineralisation beneath soil cover, alluvium, or unweathered rock regardless of grade or size.
Spectral Indicators Are Proxies, Not Direct Gold Detection
Satellite imagery cannot directly detect gold. What is mapped are surface mineral assemblages, iron oxides, clay minerals, silica, geologically associated with hydrothermal gold systems. These same assemblages can form without gold through supergene weathering or other non-economic processes. An anomaly is a reason to investigate, not a confirmation of mineralisation.
Resolution Constraints
At 10-metre output resolution, features smaller than approximately 10 to 30 metres may be missed or blended with adjacent pixels. Narrow quartz veins or small structural intersections that could be economically significant at the metre scale are below the reliable detection limit.
Atmospheric and Illumination Effects
Despite atmospheric correction during pre-processing, residual haze, aerosol loading, and variable illumination geometry can introduce spectral noise. In arid, dust-loaded environments this effect may be more pronounced.
Vegetation and Sediment Cover
Where vegetation or thick wadi sediment is present, rock signals may be partially or completely suppressed regardless of what lies beneath.
Structural Interpretation Subjectivity
Lineament mapping is partly interpretive. Not all mapped lineaments represent active fault or fracture zones; some are lithological contacts, geomorphic features, or imaging artefacts. Field validation is required.
Machine Learning Classification Uncertainty
The model produces a continuous probability score, not a grade, tonnage, or resource estimate. It reflects spectral and structural similarity to prospective environments in the training dataset. Its accuracy depends on the representativeness of that training data for this specific geological setting.
No Substitute for Ground Investigation
Remote sensing is a targeting tool. It narrows a large block to priority areas that merit field investment. It does not replace geological mapping, geochemical sampling, trenching, or drilling. No economic mineral deposit has ever been defined by satellite imagery alone.
Possible Next Steps for Consideration
Ground visits to Zone 1 (southeastern cluster)
The most direct way to test whether the spectral signals correspond to physical geology. Positional bounds are provided in Section 4.4. Whether this is worthwhile depends entirely on the client's priorities and existing field knowledge.
Stream sediment sampling along the wadi network
A low-cost early-stage screen for anomalous heavy minerals draining the eastern sector. Carries no guarantee of results.
Field verification of mapped structural lineaments
To determine whether linear features correspond to real fault or fracture zones. A judgement call for the client's own geologists.
Geophysical survey over Zone 1
Methods such as magnetic or IP surveys could image subsurface features that satellite data cannot reach. Appropriate only if surface results warrant it.
Review of existing regional geological records
Published maps and prior survey data may contextualise the anomalies identified here.
None of the above constitutes a programme of work that XRTech Group is endorsing or guaranteeing. The appropriateness of any action is entirely for the client to assess with its own qualified technical advisors.
Summary of Findings
The satellite-based prospectivity analysis identified a primary target cluster in the southeastern sector covering approximately 15.5 hectares of High to Very High probability response (Zone 1). A secondary corridor of approximately 38.5 hectares of Moderate-High response extends through the central-eastern portion of the block (Zone 2). Combined, approximately 140 hectares (~2.26% of the block) exhibit convergence of iron oxide, hydrothermal clay alteration, and structural indicators.
The remaining approximately 98% of the block returns background-level responses under the indicators applied. This does not eliminate exploration potential at depth or for deposit styles not detectable at surface.
Frequently Asked Questions
Common questions about satellite imagery for gold exploration and mineral prospectivity mapping.
Can satellite imagery detect gold deposits?
What is gold prospectivity mapping using satellite data?
How accurate is remote sensing for mineral exploration?
How long does a satellite gold prospectivity assessment take?
What satellite data does XRTech use for mineral exploration?
What are hydrothermal alteration indicators in satellite imagery?
Commission a Satellite Gold Prospectivity Assessment
XRTech Group delivers remote sensing mineral prospectivity assessments for exploration blocks across Africa, the Middle East, and Asia. Landsat archive data. Proprietary deep learning classification. Full report with named target zones.
This case study summarises a remote sensing gold prospectivity assessment conducted by XRTech Group in June 2026 (Document Ref. XRT-DM-2026-001). Client identity and specific location details are withheld by agreement. All methodology, prospectivity statistics, and target zone descriptions reflect the actual project output. The findings presented are a probabilistic assessment of surface geochemical and structural indicators and do not constitute a mineral resource estimate, reserve statement, or geological report under any regulatory reporting code. They do not represent a recommendation to invest or act. All exploration decisions remain the sole responsibility of the client. XRTech Group accepts no liability for decisions taken on the basis of this work.
