Quick Answer —
The Enhanced Vegetation Index (EVI) is a satellite-derived spectral index that measures vegetation greenness, density, and health. Calculated from red, near-infrared (NIR), and blue bands, it corrects for atmospheric noise and soil background interference. EVI values range from −1 to +1, with healthy dense vegetation typically between 0.20 and 0.80. It outperforms NDVI in dense canopy environments where NDVI saturates and loses sensitivity.
Enhanced Vegetation Index at a Glance
- EVI stands for Enhanced Vegetation Index. It measures how green, healthy, and dense vegetation is using satellite data.
- It uses three spectral bands: red, NIR, and blue. NDVI only uses two.
- The blue band is what sets EVI apart. It corrects for aerosol and atmospheric scattering that distorts other indices.
- EVI does not saturate in dense forests or high-biomass crops the way NDVI does.
- Values between 0.20 and 0.80 indicate healthy vegetation. Below 0.20 signals stress, bare soil, or sparse cover.
- The standard EVI formula uses a gain factor of 2.5, coefficients of 6 and 7.5, and a canopy background factor of 1.
- MODIS, Sentinel-2, and Landsat 8/9 are the main satellite platforms used to generate EVI data.
- EVI can detect drought stress 7 to 10 days before visible symptoms appear on the ground.
- In precision agriculture, EVI-derived prescription maps help reduce fertilizer costs and improve yield predictions to 85% accuracy.
- XRTech Group delivers EVI-ready multispectral imagery at 0.3 m resolution with daily global revisit capability.
The enhanced vegetation index, or EVI, has become one of the most trusted tools in satellite-based land monitoring. If you work in precision agriculture, forest management, environmental compliance, or land use planning, you have probably seen EVI maps in reports and dashboards. This guide explains exactly what EVI is, how it works, how to calculate it, and why it often delivers better results than NDVI in the environments that matter most.
What Is the Enhanced Vegetation Index (EVI)?
EVI is a satellite-derived spectral index developed by NASA as part of the MODIS land product suite. It quantifies vegetation greenness by measuring how plants interact with sunlight across three specific wavelength bands: red, near-infrared (NIR), and blue.
Unlike older single-band or two-band indices, EVI incorporates a correction for atmospheric noise using the blue band and an adjustment for soil background reflectance below the canopy. These two corrections make it significantly more reliable in environments where NDVI struggles, such as tropical rainforests, dense cropland at peak growth, or any region regularly covered by haze or smoke.
NASA first introduced EVI as part of the MODIS Terra satellite mission in 1999. Since then it has been adopted into Sentinel-2, Landsat 8 and 9 workflows, and commercial satellite data products worldwide.
“In dense canopy regions, NDVI stops telling you anything useful. EVI keeps working. That’s the whole point of the index.” — Remote sensing interpretation common in geospatial literature
The EVI Formula Explained
The standard EVI formula, as computed from MODIS, Sentinel-2, and Landsat data, is:
EVI = 2.5 × (NIR − Red) / (NIR + 6 × Red − 7.5 × Blue + 1)
- NIR = Near-infrared reflectance (strong reflection from healthy leaf mesophyll)
- Red = Red band reflectance (absorbed by chlorophyll)
- Blue = Blue band reflectance (corrects for atmospheric aerosol scattering)
- 2.5 = Gain factor (G) (scales the output)
- 6 = C1 (aerosol resistance coefficient for the red band)
- 7.5 = C2 (aerosol resistance coefficient for the blue band)
- 1 = L (canopy background adjustment factor)
What Each Band Contributes
The NIR band is the core of the calculation. Healthy plant cells reflect strongly in the near-infrared spectrum. The more dense and active the canopy, the stronger that NIR signal. The red band captures chlorophyll absorption. Plants absorb red light for photosynthesis, so a healthy plant with strong red absorption will push the NIR-to-Red ratio higher.
The blue band is what separates EVI from NDVI. Atmospheric aerosols, dust, haze, and smoke scatter blue light disproportionately. By including the blue band and applying the C2 coefficient, EVI filters out much of that scattering before the vegetation signal is calculated. This matters enormously in regions like Southeast Asia, sub-Saharan Africa, and the Middle East where haze is common year-round.
EVI2: The Two-Band Alternative
Some satellite sensors do not capture blue reflectance. For these, researchers use EVI2:
EVI Value Range: What the Numbers Mean
| EVI Value | What It Indicates | Typical Land Cover |
|---|---|---|
| −1.0 to 0.0 | Non-vegetated surfaces | Water bodies, snow, ice, urban areas |
| 0.0 to 0.10 | Bare or very sparse vegetation | Deserts, dry scrubland, fallow fields |
| 0.10 to 0.20 | Sparse vegetation | Dry grasslands, early-stage crops, degraded land |
| 0.20 to 0.40 | Moderate vegetation | Shrublands, crops at early growth, light forests |
| 0.40 to 0.60 | Dense healthy vegetation | Mature crops, temperate forests, well-irrigated farmland |
| 0.60 to 0.80 | Very dense lush vegetation | Tropical forests, peak-growth high-yield crops |
| 0.80 to 1.0 | Extremely dense canopy | Old-growth rainforest, bamboo dense stands |
A drop in EVI values compared to the same period in the previous year is often more informative than the absolute number. In wheat and corn regions of China, a 0.10-point drop mid-season has been shown to signal drought stress or disease up to 10 days before visual symptoms appear in the field.
EVI vs NDVI: Key Differences and When to Use Each
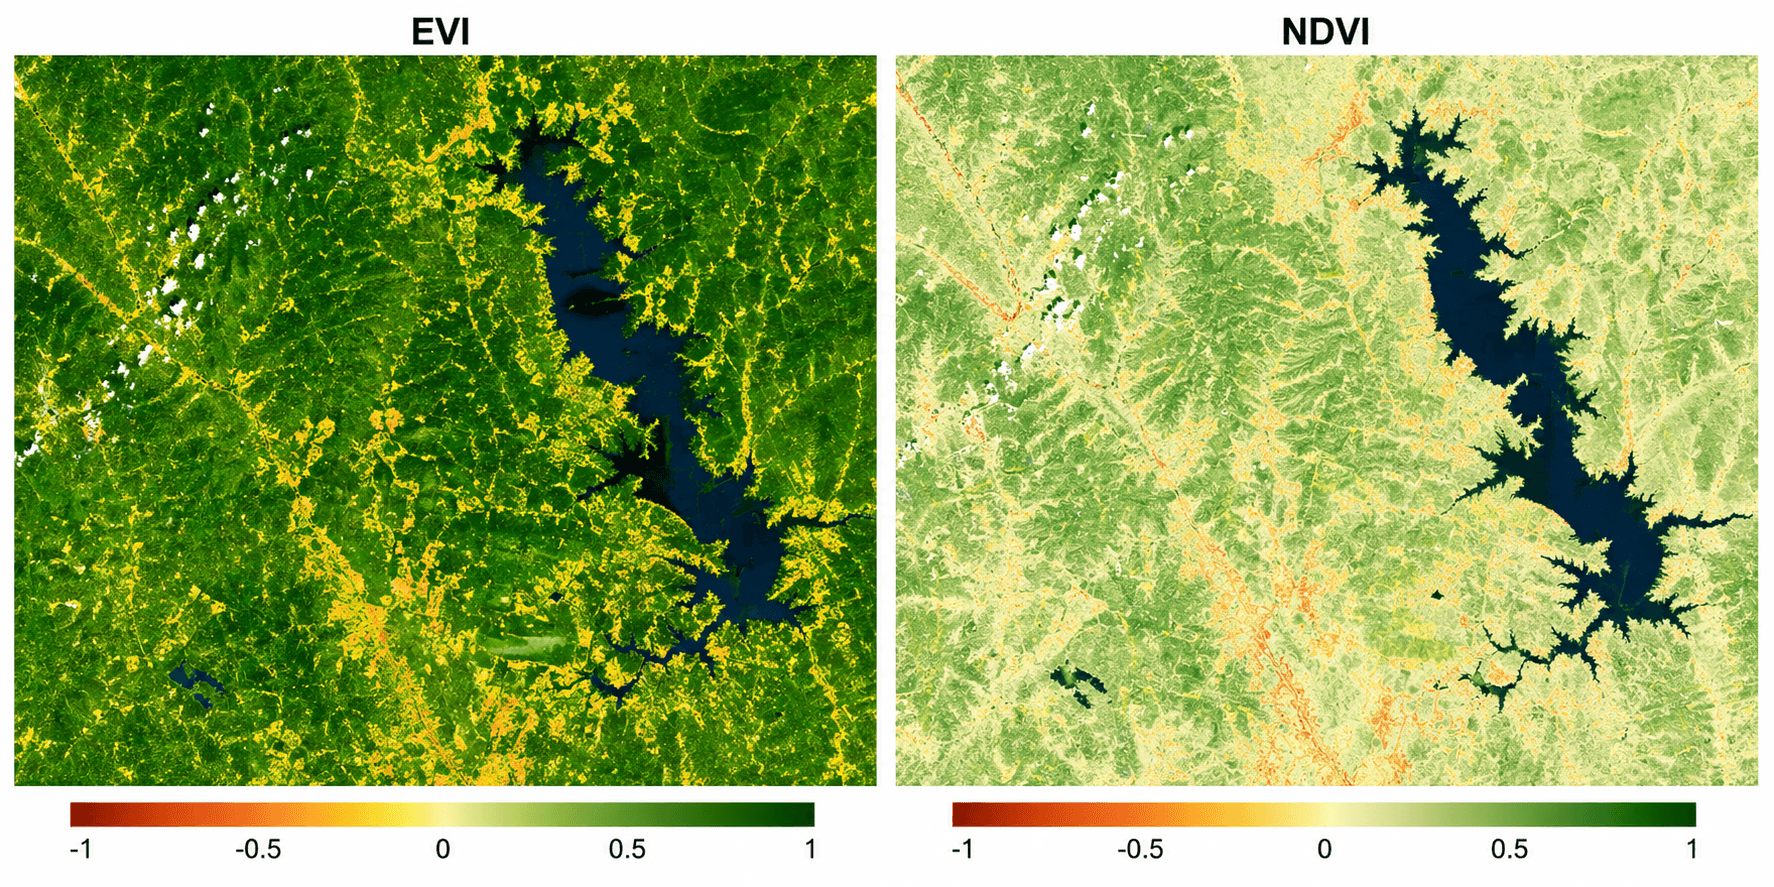
Both EVI and NDVI (Normalized Difference Vegetation Index) measure vegetation health using satellite reflectance data. They serve the same basic purpose but perform very differently in specific conditions. Here is a direct comparison:
| Feature | NDVI | EVI |
|---|---|---|
| Full name | Normalized Difference Vegetation Index | Enhanced Vegetation Index |
| Formula | (NIR − Red) / (NIR + Red) | 2.5 × (NIR − Red) / (NIR + 6×Red − 7.5×Blue + 1) |
| Spectral bands | Red, NIR | Red, NIR, Blue |
| Atmospheric correction | None | Yes, via blue band |
| Soil background correction | Minimal | Yes, via L factor |
| Saturation in dense canopy | Saturates (loses sensitivity above ~0.8) | Does not saturate |
| Best for | General monitoring, sparse to moderate vegetation | Dense forests, high-biomass crops, hazy regions |
| Sensor availability | Virtually all multispectral platforms | Multispectral satellites with blue, red, and NIR bands |
| Computational complexity | Simple | More complex, requires blue band |
| Cloud and haze sensitivity | High (more affected) | Lower (blue band reduces impact) |
| Year introduced | 1973 | 1999 |
When NDVI Is the Right Choice
NDVI is not obsolete. For sparse vegetation mapping, early-season crop assessment, or rapid monitoring tasks where simplicity matters, NDVI is faster and easier to compute with older satellite data. If your sensor does not capture blue reflectance, NDVI is the logical default.
When EVI Is the Right Choice
Use EVI when you are working with dense tropical or temperate forests, high-yield crop areas at peak growth, or any region where atmospheric interference is a recurring problem. In these conditions, NDVI will plateau and stop discriminating between healthy and extremely healthy vegetation. EVI continues to detect differences across that range.
For deforestation monitoring in the Amazon or Southeast Asian forest corridors, EVI is the index of choice among government agencies and conservation organizations precisely because haze from burning biomass does not compromise the signal the way it does with NDVI.
XRTech Satellites That Deliver EVI-Ready Data
EVI requires three spectral bands: blue, red, and near-infrared. Not every satellite platform captures all three. XRTech Group’s constellation of over 130 satellites is purpose-built for multispectral analysis, and several satellites in the fleet are directly optimized for EVI calculation and vegetation index workflows.
All imagery from XRTech’s constellation is delivered with radiometric calibration and atmospheric correction applied. This means the data is ready for EVI calculation without additional pre-processing steps on the client side. Standard delivery is under 7 days, with urgent tasking completed within 24 hours.
Applications of the Enhanced Vegetation Index
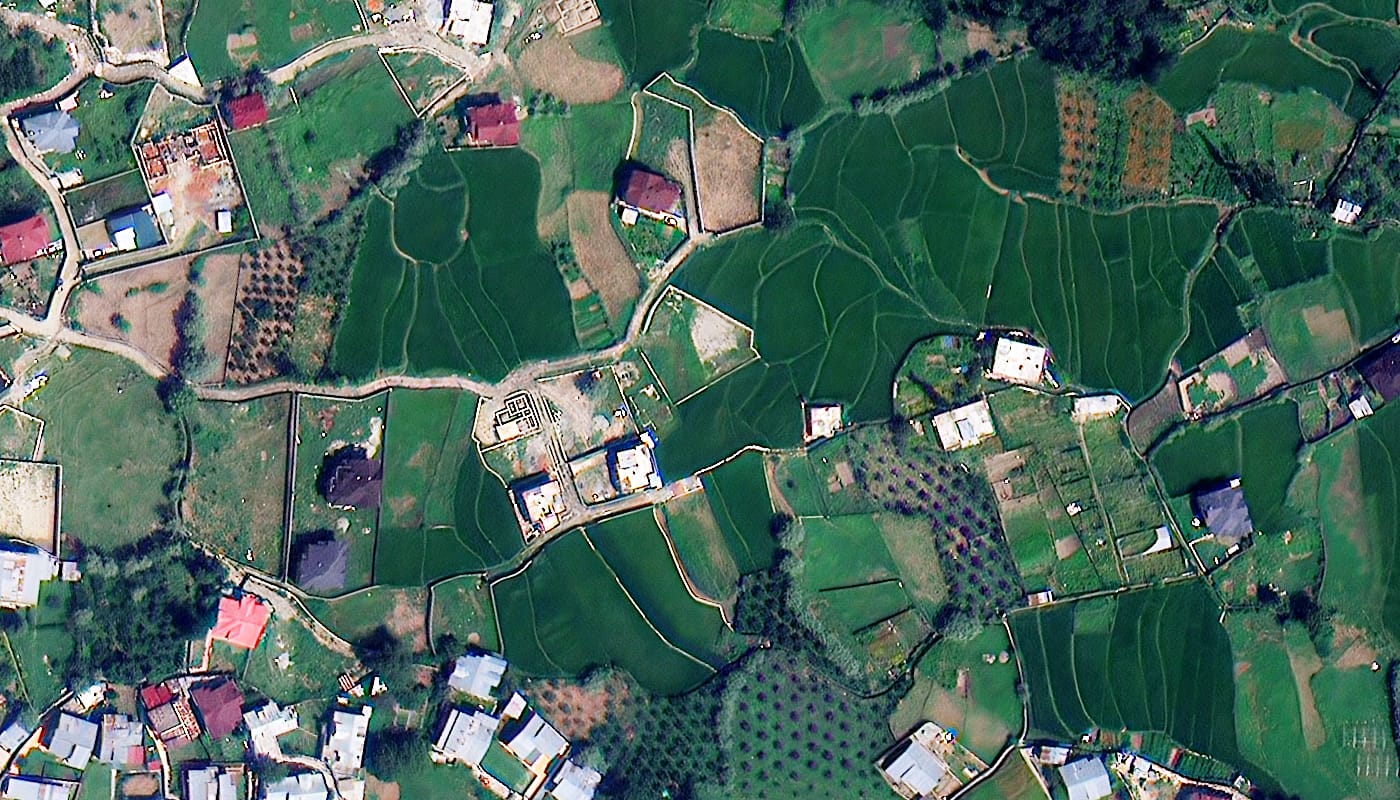
Precision Agriculture and Crop Monitoring
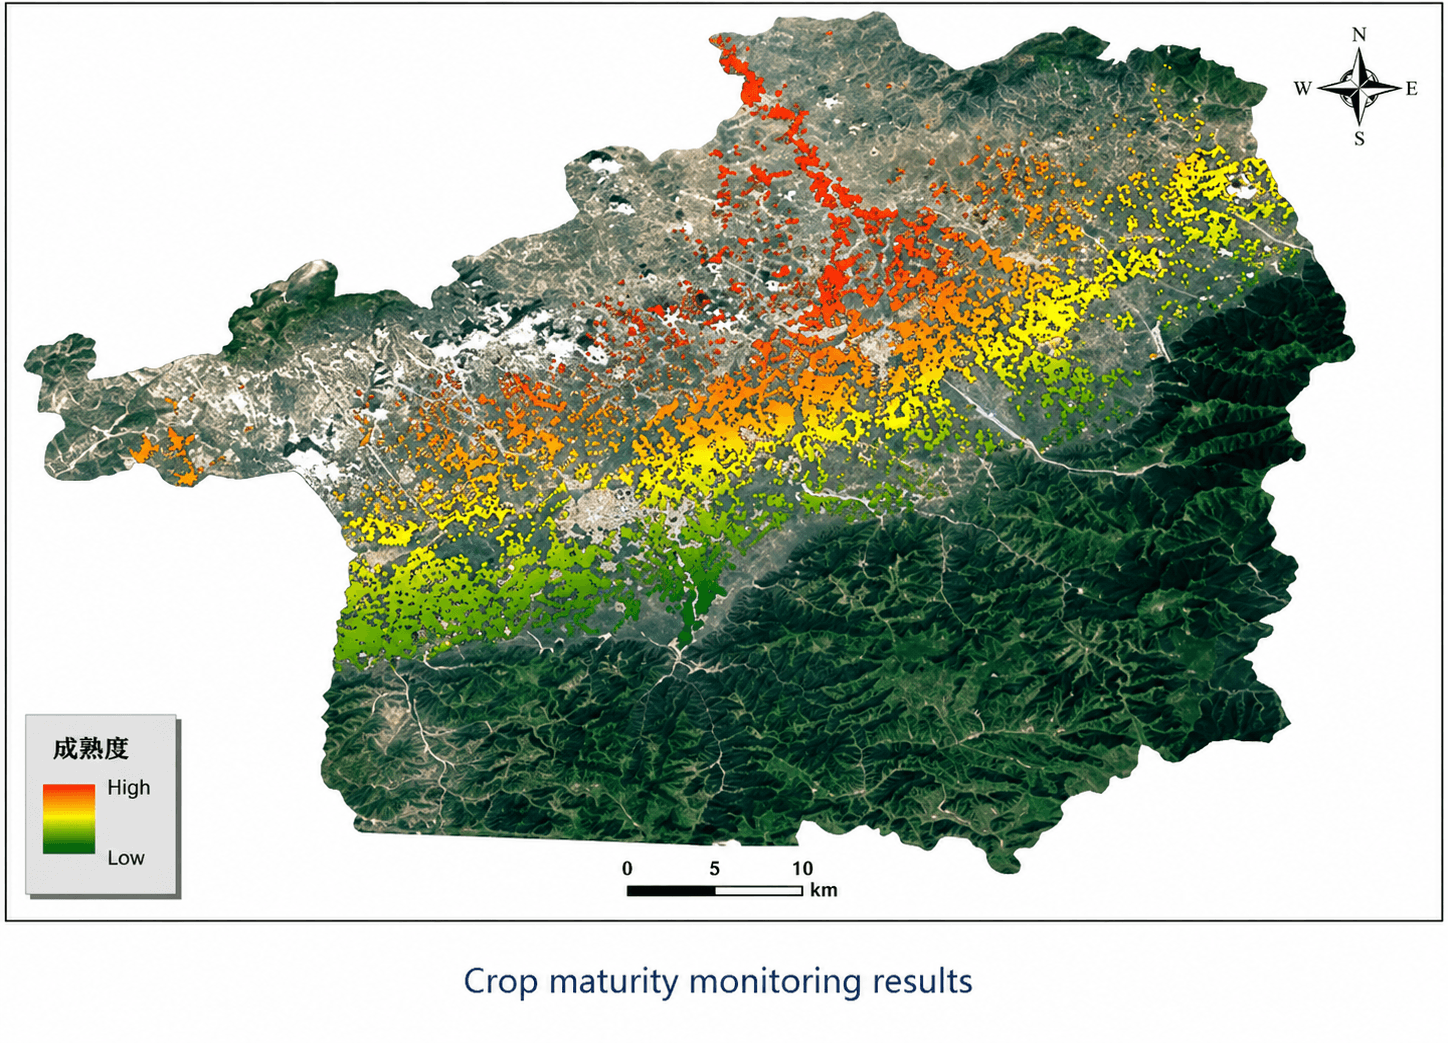
EVI is now central to modern precision agriculture. By tracking the EVI curve of a field throughout the growing season, agronomists can build yield estimates with up to 85% county-level accuracy. That kind of precision was impossible with ground surveys alone.
EVI-derived prescription maps divide fields into management zones. Automated machinery reads these maps and applies the right amount of seed, fertilizer, or water to each zone. Farms using this approach have reduced fertilizer input costs by 15 to 30% without sacrificing yield.
Early stress detection is one of the most commercially valuable applications. Subtle spectral shifts in NIR and blue reflectance often appear 7 to 10 days before visual symptoms show up on the ground. For fast-moving diseases or pest outbreaks, that lead time can be the difference between a targeted treatment and a lost harvest.
Forest Monitoring and Deforestation Detection
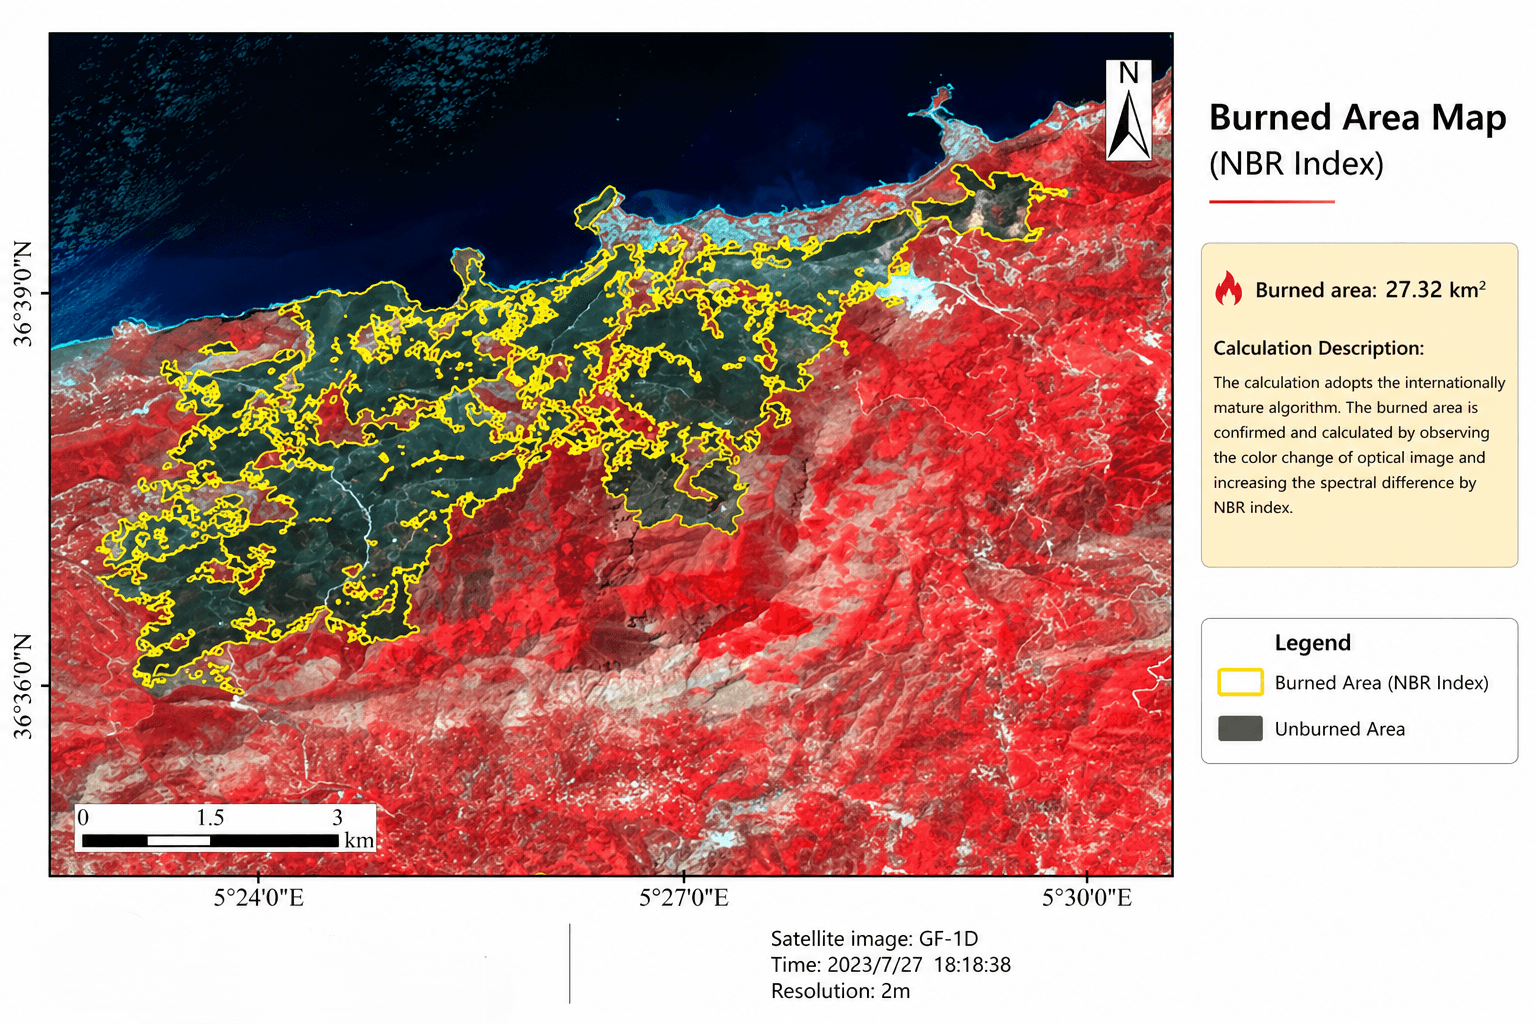
EVI is the preferred index for monitoring dense forest ecosystems. NDVI saturates quickly in tropical canopy, making it hard to distinguish between a healthy old-growth stand and a recovering secondary forest. EVI maintains sensitivity across that range, which is why it powers most operational deforestation alert systems today.
In Southeast Asia, where smoke from burning agricultural fields routinely covers satellite imagery, the blue band correction in EVI allows forest health data to be captured reliably even during the fire season. This matters for governments and NGOs trying to enforce land-use laws in real time.
Drought Monitoring
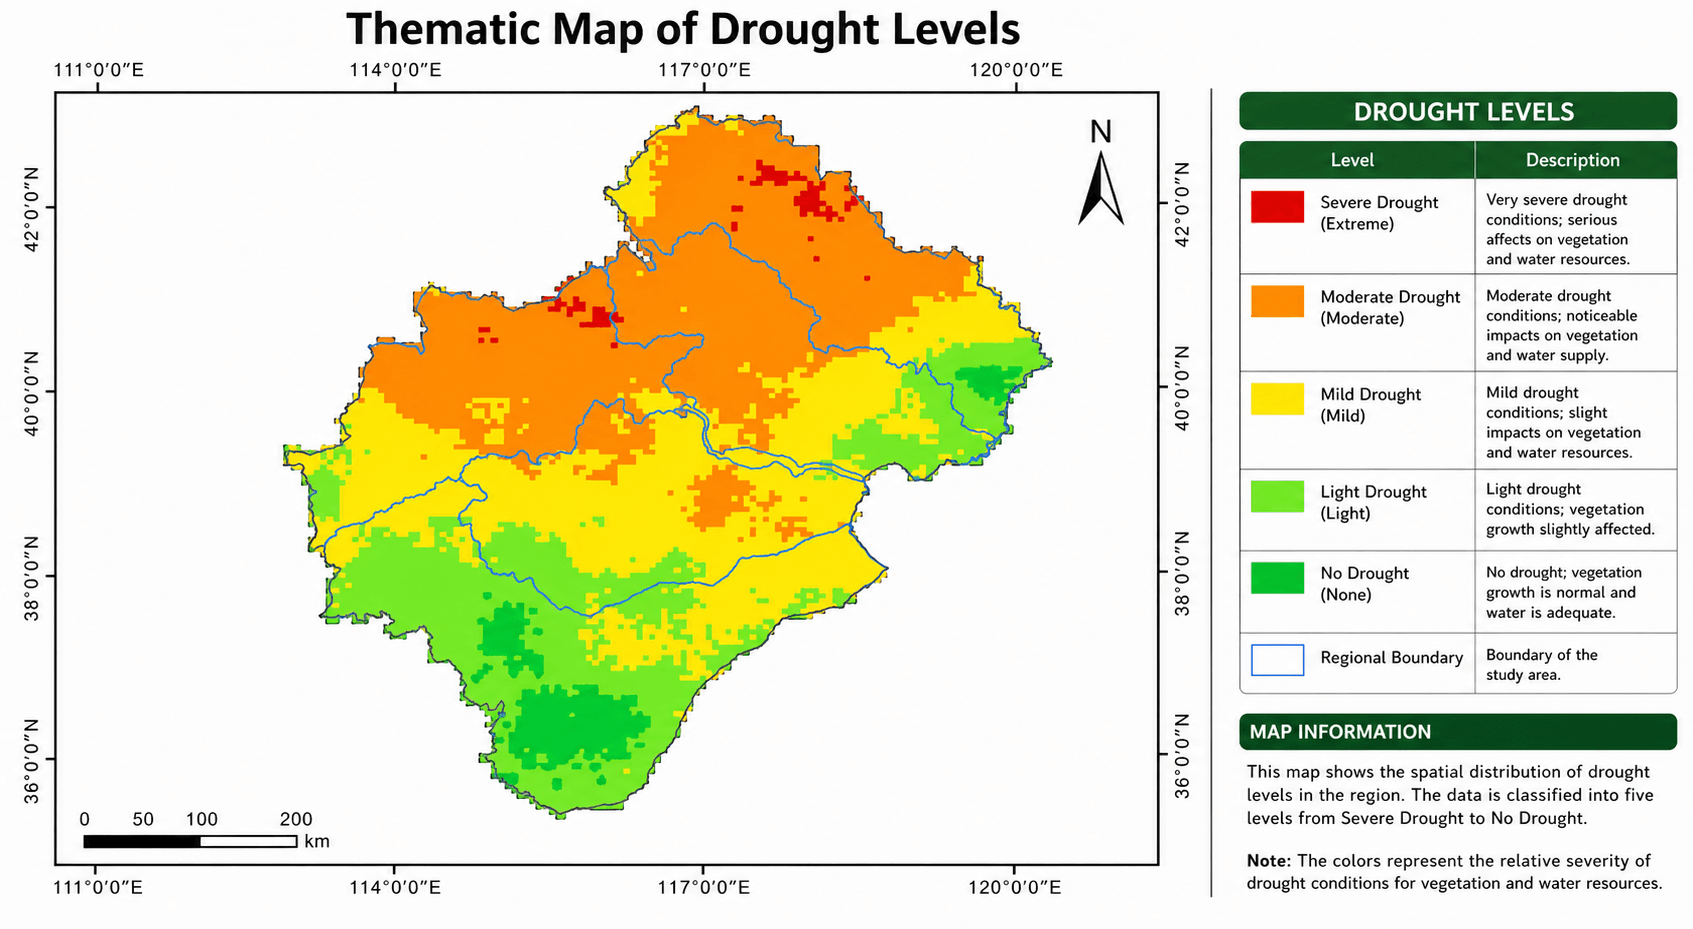
EVI responds well to soil moisture stress through the NIR band. As plants begin to close their stomata under water deficit, leaf structure changes and NIR reflectance drops. EVI captures this before any colour change is visible. The practical result is that drought alerts tied to EVI data can trigger irrigation or emergency response earlier than any ground-based system.
In China’s Henan Province, EVI-driven monitoring allowed farmers to identify drought stress 10 days earlier than traditional ground checks. Emergency irrigation saved a significant portion of that season’s crop.
Carbon Stock Estimation and Climate Research
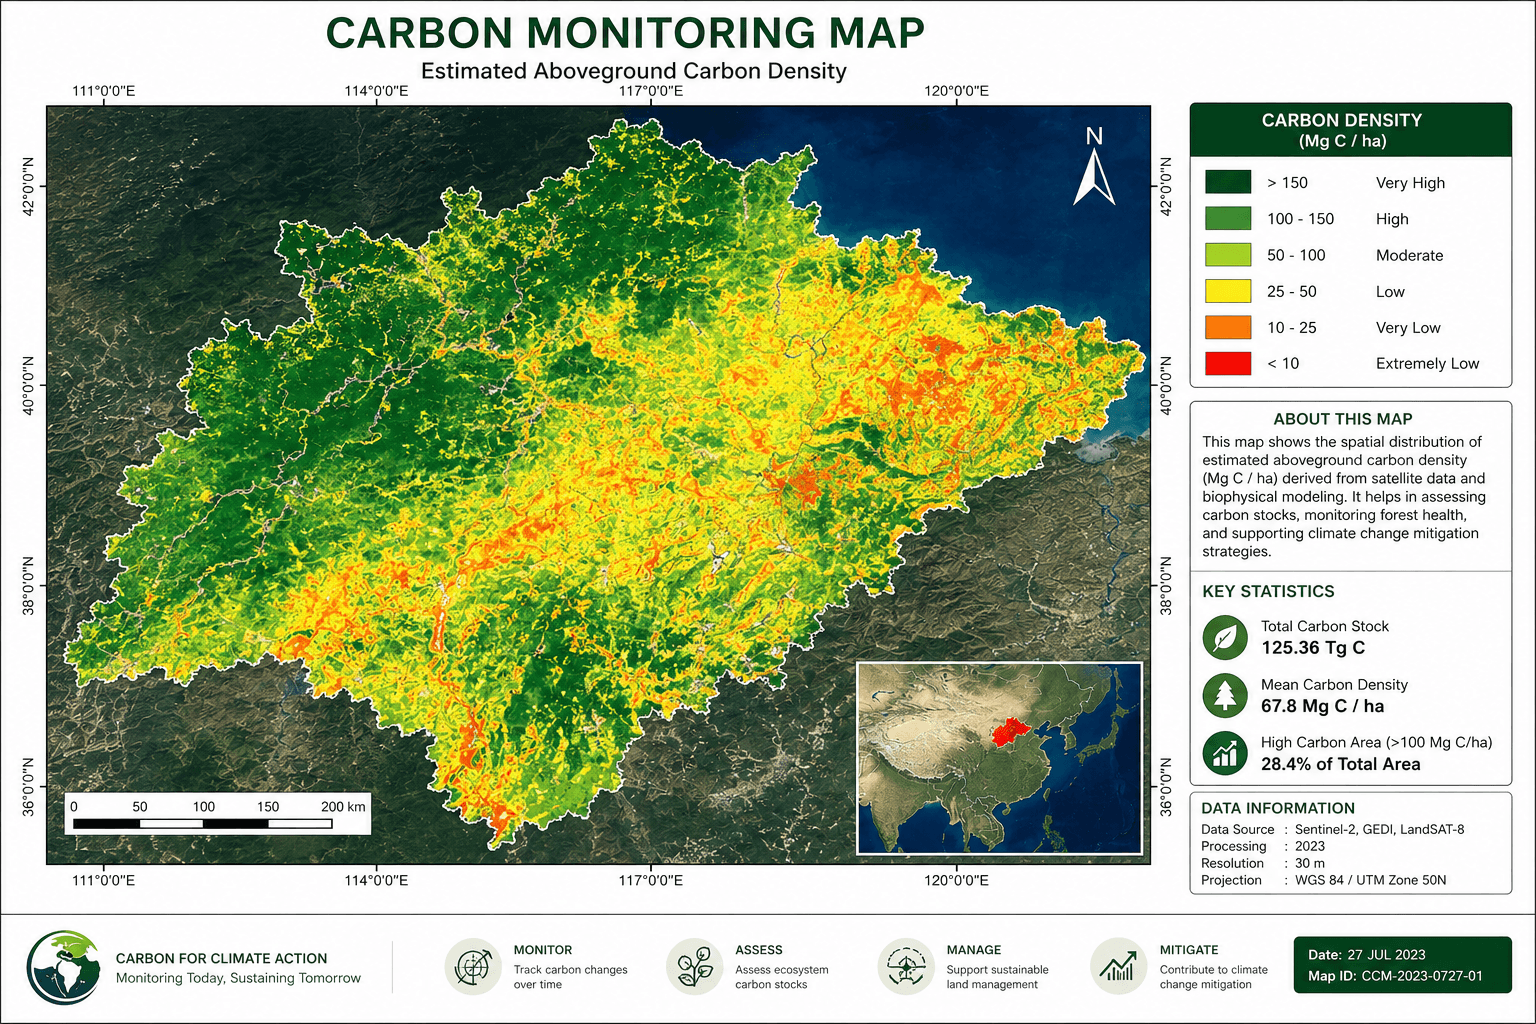
Because EVI tracks canopy density accurately even in high-biomass forests, it is widely used to estimate above-ground biomass and carbon stocks. Conservation programmes, carbon offset verification bodies, and national forest inventories all use multi-temporal EVI data as part of their assessment frameworks.
Land Degradation and Mining Reclamation
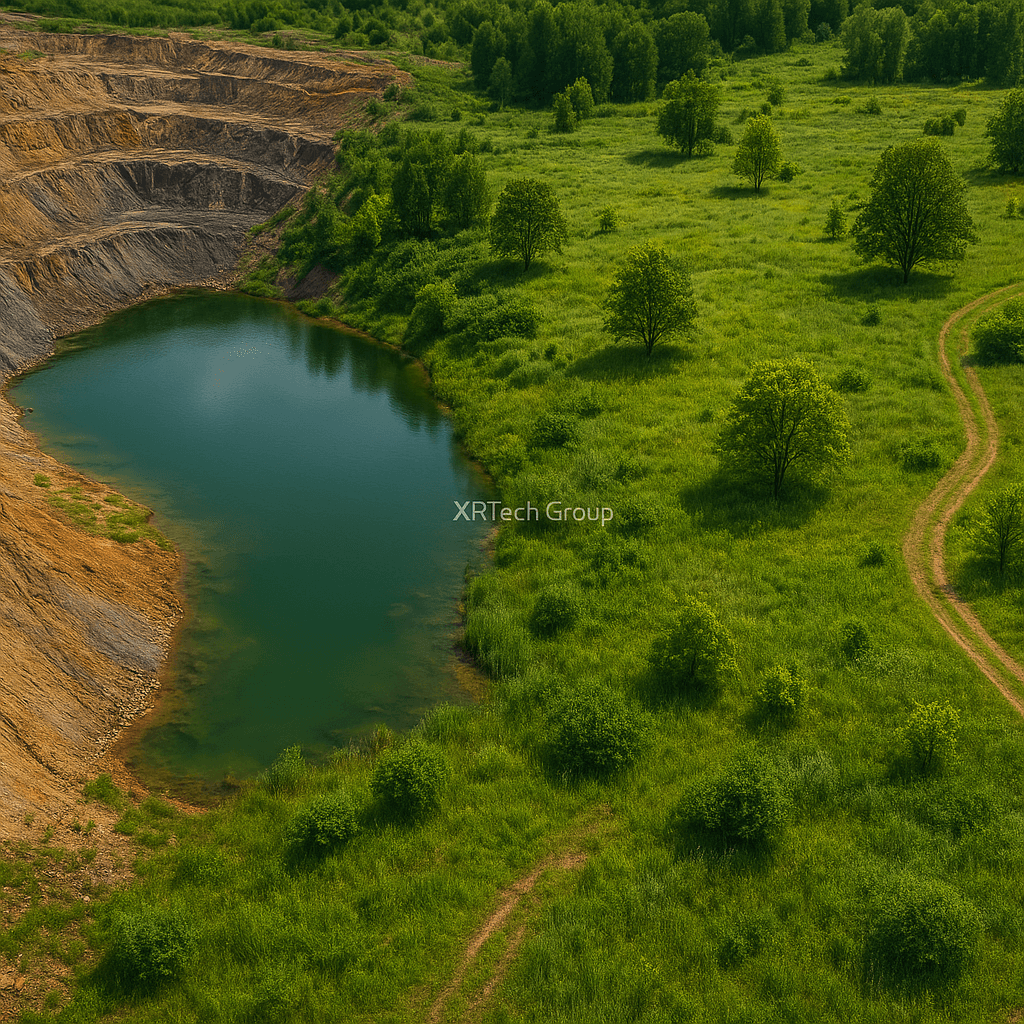
Mining and industrial sites are required in many jurisdictions to restore vegetation after operations end. EVI monitoring provides a verifiable, satellite-based record of revegetation progress over time. Comparing current EVI values against historical baselines going back to 1999 gives land managers a clear picture of how site recovery is progressing.
How XRTech Group Delivers EVI Data
XRTech Group operates through a constellation of over 130 satellites. This gives clients access to daily global revisit coverage with imagery at resolutions as fine as 0.3 m — fine enough to monitor individual field zones, tree rows, and land use boundaries with precision.
For EVI-specific applications, several satellites in the fleet are particularly relevant:
- SuperView Neo-1 (0.3 m): The highest-resolution option. Daily revisit ensures EVI maps are updated continuously. Well-suited for field-level crop monitoring where missing a week of data due to cloud cover is not acceptable.
- SuperView-2 / GFDM: Optimized for spectral indices with 1+8 band configuration including Purple and Yellow bands. Adds further atmospheric correction capability beyond the standard EVI formula.
- GF-6: Includes a Red Edge band at 690 to 770 nm. When fused with EVI data, Red Edge-enhanced models achieve vegetation classification accuracies above 90%.
- GF-4 (geosynchronous): 20-second revisit frequency for critical monitoring windows. Relevant for irrigation response and rapid environmental monitoring.
XRTech’s workflow moves from data acquisition and atmospheric correction through spectral analysis and AI-assisted interpretation to a delivered product. Standard delivery is under 7 days. Urgent tasking can be completed within 24 hours.
Archive imagery is available from $20 per km². New 30 cm tasking starts at $30 per km².
AI and the Future of Vegetation Index Monitoring
EVI generates enormous datasets. A single multitemporal analysis of a large agricultural region can involve hundreds of gigabytes of imagery across dozens of time steps. Processing this manually is not realistic. That is why deep learning and AI have become inseparable from operational EVI workflows.
Deep learning models trained on EVI time series can identify crop types automatically, predict yield trajectories, and flag anomalies that deviate from expected seasonal patterns. What used to take weeks of analyst time now runs in near-real-time on cloud platforms.
Predictive modelling built on EVI is particularly valuable for food security planning. At the county level, AI-integrated EVI analysis can forecast harvest volumes with enough lead time for government agencies and commodity traders to make decisions before the crop is in the ground.
Hyperspectral imaging is the next step in this progression. Current multispectral sensors capture 4 to 12 bands. Hyperspectral sensors capture hundreds of narrow spectral bands, which will allow indices far more specific than EVI to be calculated for detecting individual nutrient deficiencies, specific disease strains, or precise moisture content in plant tissue.
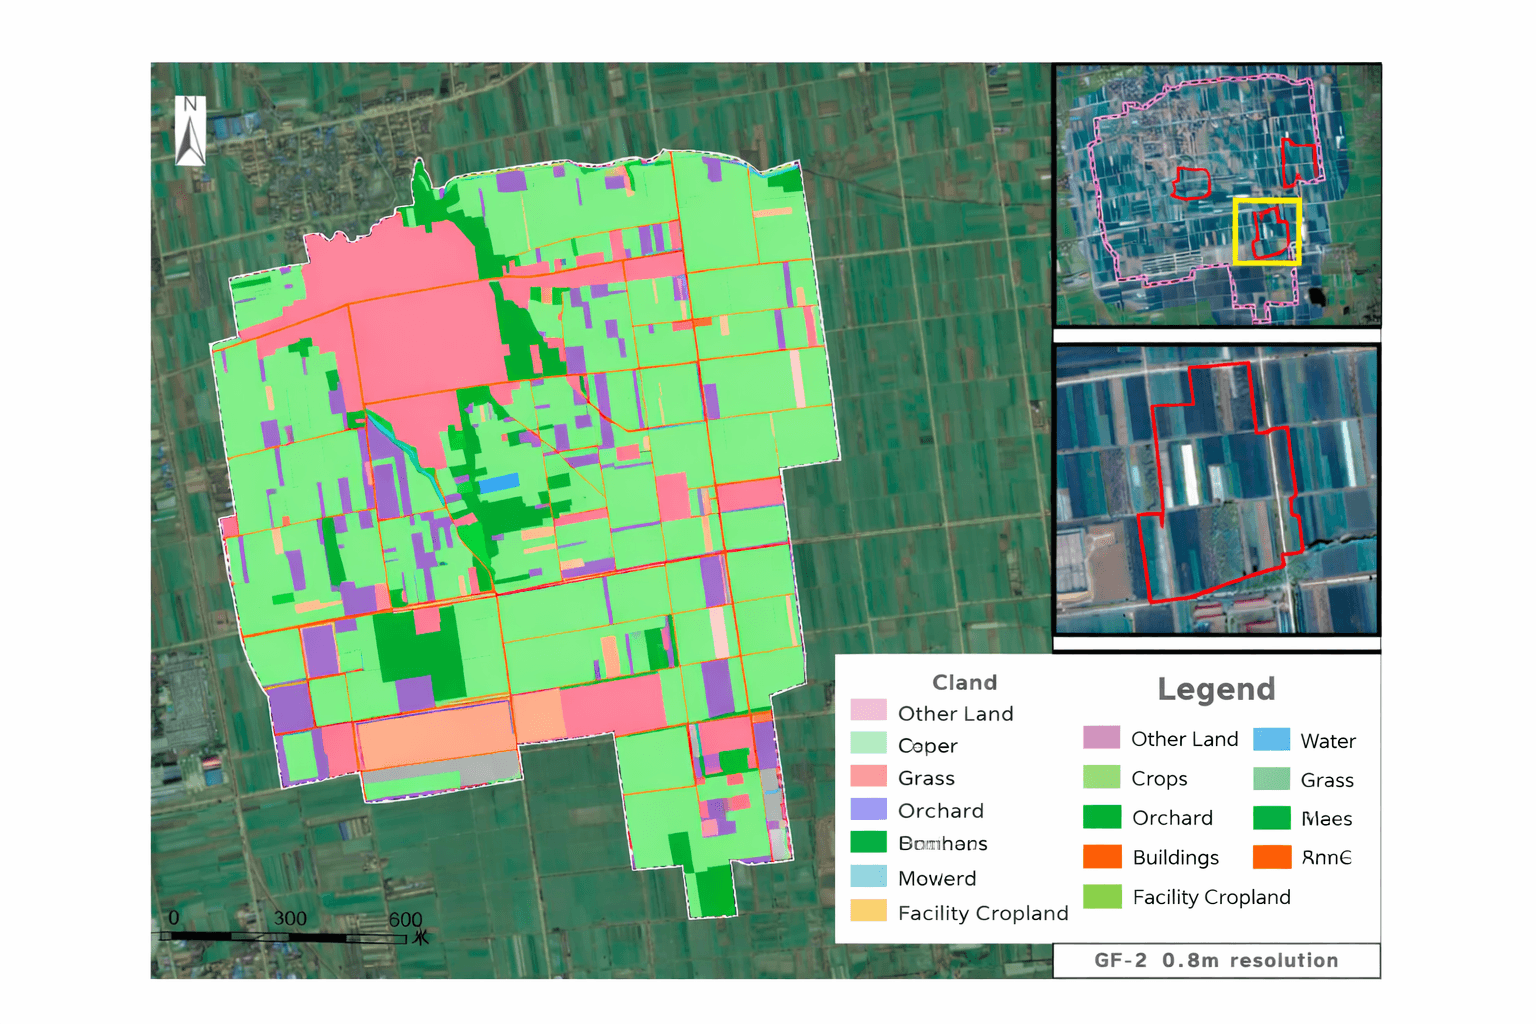
The Four Levels of Vegetation Classification
EVI data is often used to classify land into vegetation levels. The four broad categories used in remote sensing and land cover mapping are:
| Vegetation Level | Description | Typical EVI Range |
|---|---|---|
| No Vegetation | Urban areas, bare soil, water bodies, rock | < 0.10 |
| Sparse Vegetation | Desert grassland, dry scrub, degraded land | 0.10 – 0.25 |
| Moderate Vegetation | Cropland, savanna, mixed woodland | 0.25 – 0.50 |
| Dense Vegetation | Tropical forest, intensive cropland, riparian zones | > 0.50 |
EVI and Leaf Area Index (LAI)
EVI is closely correlated with Leaf Area Index (LAI), which is the total one-sided leaf area per unit of ground area. LAI is a key structural variable in ecosystem models, and EVI provides a non-destructive way to estimate it from satellite data.
In healthy temperate broadleaf forests, LAI typically ranges from 3 to 8. Tropical rainforests can reach LAI values of 5 to 10 or higher. NDVI saturates in both of these environments, but EVI maintains its sensitivity through the full LAI range. This is why EVI is the preferred index for global LAI estimation products used in climate and ecosystem research.
Conclusion
The enhanced vegetation index is not a replacement for fieldwork. No satellite index is. But for monitoring large areas, detecting stress early, and making resource decisions across thousands of hectares, EVI gives you a level of visibility that ground surveys simply cannot match in scale or frequency.
It works better than NDVI in the environments where you need it most: dense canopy, heavy agricultural regions, and areas with frequent atmospheric interference. The three-band formula costs slightly more to compute than NDVI, but the accuracy gain is worth it for any project where the difference between 0.40 and 0.50 EVI actually changes a decision.
XRTech Group provides the satellite data and delivery infrastructure to turn that formula into actionable intelligence. From 0.3 m resolution imagery to AI-interpreted prescription maps, the full pipeline is available with global coverage, daily revisit, and no export licence barriers.
Frequently Asked Questions: Enhanced Vegetation Index