
Sentinel-2 Satellite Image Data: 13 Sentinel-2 Bands for Land, Water & Vegetation Monitoring
10m Resolution · 13 Spectral Bands · 290km Swath
Access Sentinel-2 satellite imagery from ESA's Copernicus multispectral mission, offering wide-swath, high-resolution coverage of land, vegetation, and water surfaces. XRTech Group delivers processed Sentinel-2 satellite image data drawn from the full archive, with analysis-ready products across all 13 Sentinel-2 bands from visible light through shortwave infrared.
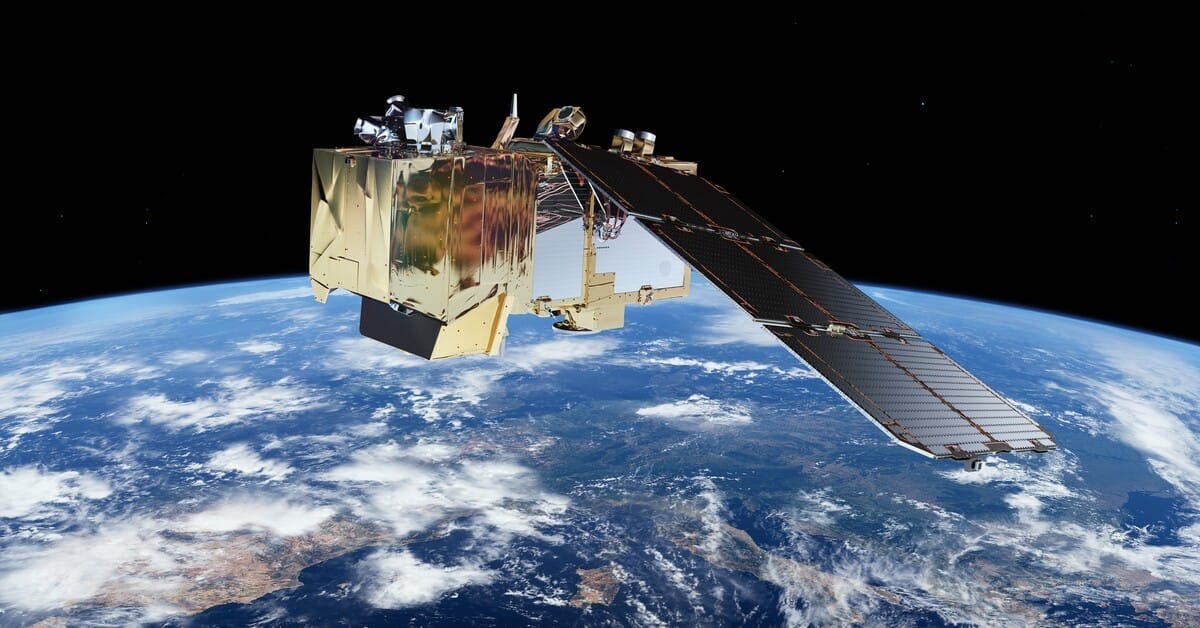
What Is the Sentinel-2 Satellite Mission?
Sentinel-2 is a wide-swath, high-resolution, multispectral imaging mission operated by the European Space Agency (ESA) as part of the European Union's Copernicus Programme. Each Sentinel-2 satellite carries a Multispectral Instrument (MSI) that captures 13 spectral bands spanning visible light, near-infrared, and shortwave infrared, giving every Sentinel-2 satellite image far more analytical depth than a standard RGB photo.
The constellation launched in stages: Sentinel-2A on June 23, 2015, Sentinel-2B on March 7, 2017, and Sentinel-2C on September 5, 2024, all lifted from Kourou, French Guiana aboard Vega rockets. Since January 2025, Sentinel-2B and Sentinel-2C have formed the nominal operational pair, flying in the same sun-synchronous orbit phased 180 degrees apart to maximize revisit frequency. Sentinel-2A, though past its original design life, continues operating in a bonus extension campaign through the end of 2026, positioned roughly 36 degrees from Sentinel-2B to add extra coverage while it remains fuel-viable.
Each satellite images a 290km swath at nadir, and Sentinel-2 data is made freely available by ESA to researchers, government agencies, and commercial users worldwide. XRTech Group sources, processes, and delivers Sentinel-2 satellite image data in analysis-ready form, matched to your area of interest and required Sentinel-2 bands.
Sentinel-2 Bands: Full Spectral Band Reference
Every Sentinel-2 satellite image is built from 13 spectral bands split across three spatial resolutions. Knowing which Sentinel-2 bands map to which resolution tier matters for choosing the right product for your analysis.
| Band | Wavelength | Resolution |
|---|---|---|
| Coastal Aerosol | 442.7 nm | 60m |
| Blue | 492.4 nm | 10m |
| Green | 559.8 nm | 10m |
| Red | 664.6 nm | 10m |
| Vegetation Red Edge 1 | 704.1 nm | 20m |
| Vegetation Red Edge 2 | 740.5 nm | 20m |
| Vegetation Red Edge 3 | 782.8 nm | 20m |
| NIR | 832.8 nm | 10m |
| Narrow NIR | 864.7 nm | 20m |
| Water Vapour | 945.1 nm | 60m |
| SWIR Cirrus | 1373.5 nm | 60m |
| SWIR 1 | 1613.7 nm | 20m |
| SWIR 2 | 2202.4 nm | 20m |
Visible & NIR Bands
Blue, Green, Red, and NIR. The sharpest tier, used for standard true-color Sentinel-2 satellite images and vegetation index calculations like NDVI.
Red-Edge & SWIR Bands
Six bands covering vegetation red-edge and shortwave infrared, valuable for crop stress detection, soil moisture, and mineral analysis.
Atmospheric Correction Bands
Coastal aerosol, water vapour, and cirrus bands, used primarily to correct atmospheric interference in the higher-resolution bands.
Sentinel-2 Satellite Image Processing Levels
Sentinel-2 satellite image data is available at several processing levels, from near-raw output to fully atmospherically corrected surface reflectance, so you can choose the right starting point for your workflow.
| Level 1B | Top-of-atmosphere radiance, minimal processing, restricted to the last two weeks of acquisitions |
| Level 1C | Top-of-atmosphere reflectance, orthorectified, global coverage from July 2015 to present |
| Level 2A | Atmospherically corrected surface reflectance, CEOS Analysis Ready Data (CEOS-ARD) compliant, available from July 2015 to present |
| Level 3 | Quarterly mosaics combining multiple scenes into seamless composites, available worldwide from July 2015 to present |
Applications for Sentinel-2 Satellite Imagery
The breadth of Sentinel-2 bands, from visible light through shortwave infrared, supports a wide range of monitoring applications beyond simple visual interpretation.
Agriculture
Track crop health, estimate leaf chlorophyll content, and detect crop stress early using red-edge and NIR bands.
Forestry & Environment
Monitor deforestation, map fire burn scars, and track seasonal vegetation growth cycles over time.
Water Resources
Map inland waterways, assess water quality, and monitor coastal environments using visible and NIR bands.
Disaster Management
Support emergency response mapping for floods, wildfires, and landslides with frequent revisit coverage.
Land Monitoring
Track land-use change and urban expansion using consistent, wide-swath Sentinel-2 satellite image coverage.
Risk Mapping & Security
Support risk assessment and security monitoring applications with frequent, freely available multispectral data.
Marine Applications
Monitor coastal water conditions and marine environments alongside terrestrial land cover analysis.
Humanitarian Relief
Support relief operations with rapid access to current, wide-area Sentinel-2 satellite images following crisis events.
Turn Sentinel-2 Satellite Images into Insight
Change Detection
Compare multiple Sentinel-2 satellite images of the same area captured at different dates to track urban expansion, environmental shifts, and disaster impact.
Time Series Analysis
Build spatiotemporal index graphs across a selected area of interest to reveal seasonal variation, land-use trends, and long-term vegetation change.
Clusterization
Convert raster Sentinel-2 data into zones grouped by spectral characteristics, revealing patterns in vegetation, water quality, and land cover.
Full Technical Specifications
Sensor & Coverage
| Provider | European Space Agency (ESA), Copernicus |
| Active Satellites | Sentinel-2B, Sentinel-2C (Sentinel-2A extended) |
| Spectral Bands | 13, visible through SWIR |
| Resolution Tiers | 10m / 20m / 60m by band |
| Swath Width | 290 km at nadir |
| Scene Size | 110 × 110 km |
| Positional Accuracy | < 5m CE90 at nadir |
| Daily Coverage | ~290,000 km² |
| Stereo Imaging | Not available |
Orbit & Mission
| Orbit Type | Sun-Synchronous, polar orbiting |
| Altitude | ~786 km |
| Revisit (Equator) | 5 days |
| Revisit (Mid-Latitudes) | 2–3 days |
| Data Archive | Global since 2018; Europe since 2015 |
| Sentinel-2A | Launched June 2015 (extension campaign through Dec 2026) |
| Sentinel-2B | Launched March 2017 (active) |
| Sentinel-2C | Launched September 2024 (active) |
The Sentinel-2 Satellite Mission Timeline
Sentinel-2A launches from Kourou aboard a Vega rocket, becoming the first satellite in the Sentinel-2 mission.
Sentinel-2B launches, forming the original two-satellite constellation and enabling the mission's 5-day equatorial revisit cycle.
Sentinel-2C launches, arriving ahead of Sentinel-2A's planned retirement to maintain uninterrupted data continuity.
Sentinel-2C formally replaces Sentinel-2A as the nominal operational partner to Sentinel-2B.
Sentinel-2A enters an extension campaign, operating roughly 36 degrees from Sentinel-2B to add bonus coverage while fuel reserves allow.
Why Choose Sentinel-2 Satellite Imagery
- 13 Spectral BandsFrom visible light through shortwave infrared, supporting detailed analysis of vegetation, soil, and water beyond what standard RGB imagery can show.
- Wide 290km SwathCovers large regions in a single pass, reducing the number of scenes needed for national or regional-scale monitoring.
- Frequent Revisit5-day revisit at the equator, improving to 2 to 3 days at mid-latitudes with the combined constellation.
- Deep, Free ArchiveContinuous global data since 2015 (2018 for full global coverage), openly available to researchers, agencies, and commercial users.
- Built-In AnalyticsChange detection, time series analysis, and clusterization tools turn raw Sentinel-2 satellite images into actionable insight.
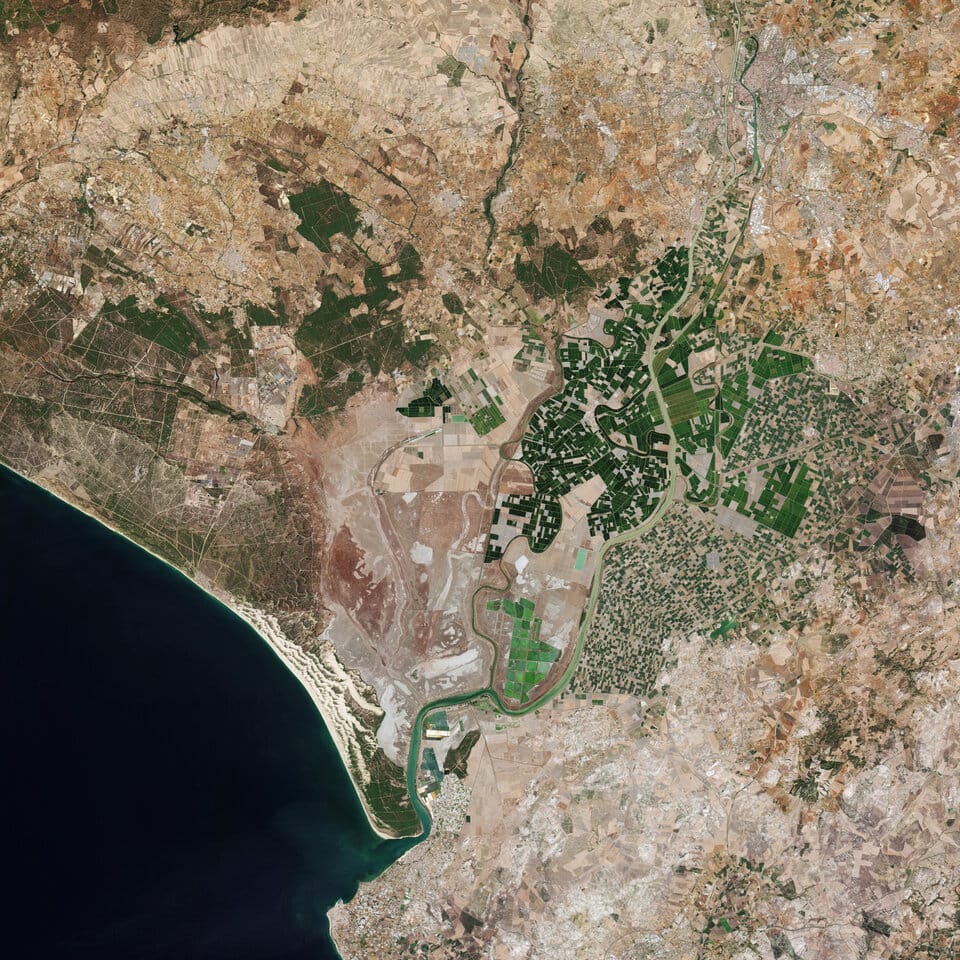
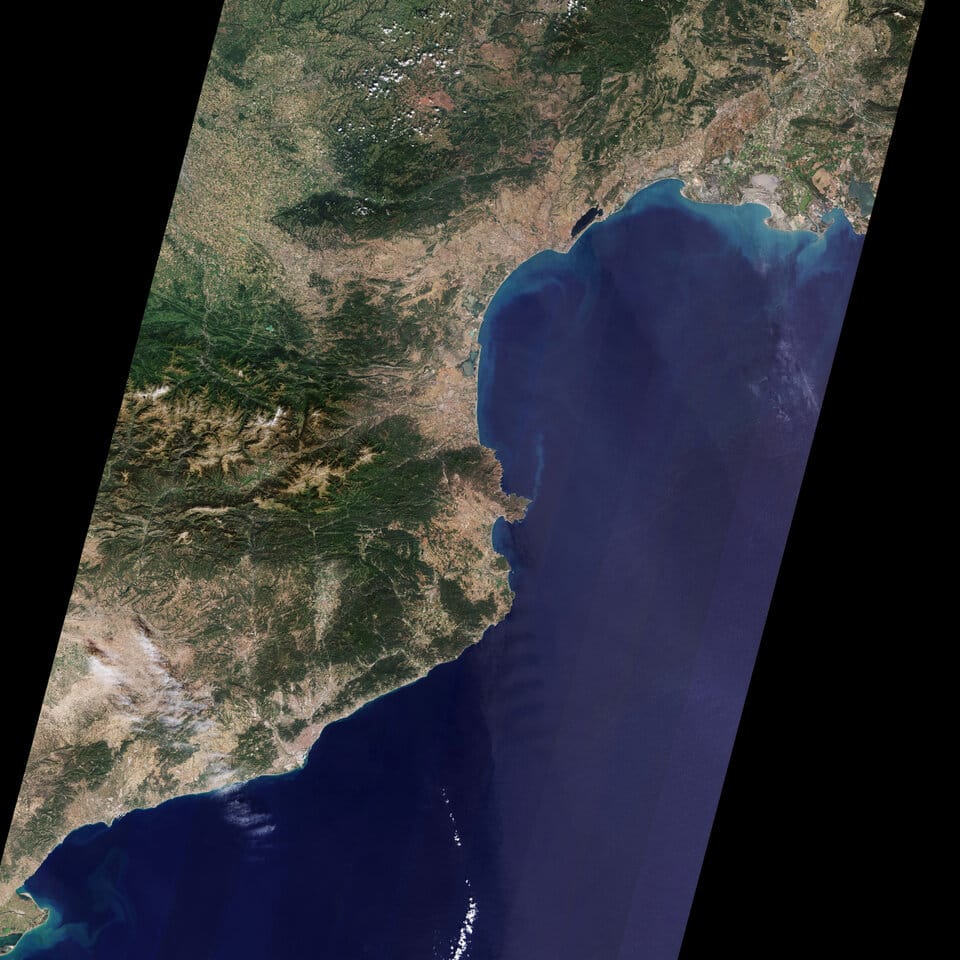
Sentinel-2 Satellite Image Samples
End-to-End Support for Sentinel-2 Satellite Image Data
- Expert ConsultationOur geospatial specialists help select the right Sentinel-2 bands and processing level for your specific monitoring goal.
- Rapid DeliveryDirect access to a 130+ satellite constellation network, including Sentinel-2 and other optical and SAR sensors, for faster turnaround.
- Seamless IntegrationSentinel-2 satellite image data delivered in industry-standard formats, ready for your GIS, CAD, or modeling workflow.
Common Questions About Sentinel-2
How many Sentinel-2 bands are there, and what do they cover?
Sentinel-2 captures 13 spectral bands: four at 10m resolution (Blue, Green, Red, NIR), six at 20m (red-edge and SWIR bands), and three at 60m used mainly for atmospheric correction.
Which Sentinel-2 satellites are currently active?
Sentinel-2B and Sentinel-2C form the nominal operational pair since January 2025. Sentinel-2A remains active in a bonus extension campaign through December 31, 2026, temporarily giving the mission three operating satellites.
Is Sentinel-2 satellite imagery free?
Yes. Sentinel-2 data is made freely available by ESA under the Copernicus programme's open data policy. XRTech Group sources, processes, and delivers this data in analysis-ready form tailored to your project.
What is the difference between Level-1C and Level-2A Sentinel-2 products?
Level-1C provides top-of-atmosphere reflectance with orthorectification, while Level-2A applies additional atmospheric correction to produce surface reflectance, and is compliant with the CEOS Analysis Ready Data specification.
How often does Sentinel-2 revisit the same location?
Every 5 days at the equator using the combined constellation, improving to every 2 to 3 days at mid-latitudes where satellite ground tracks overlap more frequently.
Can Sentinel-2 imagery be used for vegetation and crop analysis?
Yes. The red-edge and NIR bands support vegetation indices like NDVI, widely used for crop health monitoring, chlorophyll estimation, and early stress detection in agriculture.
Ready to Access Sentinel-2 Satellite Image Data?
Talk to our geospatial team about processing level, band selection, and delivery for your area of interest.