
Landsat 9 Images: View And Download Satellite Data
Landsat 9 Resolution: 15m Panchromatic · 30m Multispectral · 100m Thermal
The Landsat 9 satellite launched on September 27, 2021, continuing more than 50 years of NASA and USGS Earth observation. XRTech Group makes it simple to view and download Landsat 9 images: all 11 Landsat 9 bands from the OLI-2 and TIRS-2 instruments, sourced, processed, and delivered for your area of interest.
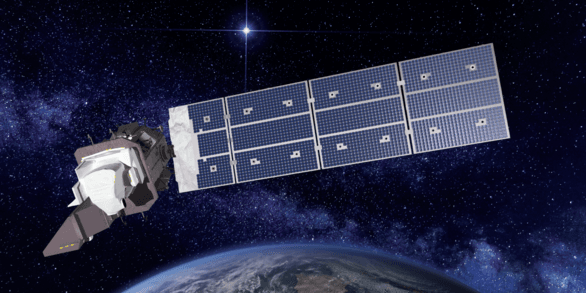
What Is the Landsat 9 Satellite, and When Was Landsat 9 Launched?
The Landsat 9 satellite was launched on September 27, 2021, from Vandenberg Space Force Base in California aboard a United Launch Alliance Atlas V401 rocket. Landsat 9 is operated jointly by NASA and the U.S. Geological Survey (USGS), continuing a Landsat program data record that stretches back to 1972. It succeeds Landsat 8, which launched in February 2013, and effectively replaces the retired Landsat 7 in the constellation, flying alongside Landsat 8 to provide 8-day combined revisit coverage instead of the 16-day cycle either satellite manages alone.
Landsat 9 carries the most refined instrument set flown on any Landsat satellite to date: the Operational Land Imager-2 (OLI-2), built by Ball Aerospace & Technology Corp, and the Thermal Infrared Sensor-2 (TIRS-2), built by NASA's Goddard Space Flight Center. Together they capture 11 spectral bands, from ultra-blue coastal aerosol through thermal infrared, collecting roughly 750 scenes of Landsat 9 imagery per day. Landsat 9's design life is 5 years, but it carries enough consumables for 10 or more years of operation, following the same conservative-design, long-service pattern as its predecessors.
Because Landsat 9 imagery is freely available under an open data policy, XRTech Group's role is to source, process, and deliver Landsat 9 images in analysis-ready form, matched to your area of interest, date range, and band requirements.
Landsat 9 Resolution: OLI-2 and TIRS-2 Explained
Landsat 9 resolution varies by instrument and band, and understanding the difference is essential before choosing which Landsat 9 images to download for your project.
| Panchromatic (Band 8) | 15m, via the Operational Land Imager-2 (OLI-2) |
| Multispectral (OLI-2) | 30m across coastal, visible, NIR, SWIR, and cirrus bands |
| Thermal (TIRS-2) | 100m native, resampled to 30m for delivery consistency |
| Swath Width | 185 km at nadir |
| Scene Size | 185 × 180 km |
TIRS-2 on Landsat 9 is a meaningful upgrade over the TIRS carried on Landsat 8: it reduces stray light contamination in thermal band data and improves cloud-cover detection, letting the instrument remove more contaminated pixels from raw data before delivery. Combined with OLI-2's improved radiometric performance, Landsat 9 resolution and data quality edge out even Landsat 8 in several respects, despite sharing the same headline 15m and 30m figures.
Landsat 9 Bands: Full OLI-2 and TIRS-2 Reference
Every Landsat 9 image is built from 11 total bands: nine from OLI-2 and two thermal bands from TIRS-2.
| Band | Spectral Range | Resolution |
|---|---|---|
| Band 1 — Ultra Blue (Coastal/Aerosol) | 435–451 nm | 30 m |
| Band 2 — Blue | 452–512 nm | 30 m |
| Band 3 — Green | 533–590 nm | 30 m |
| Band 4 — Red | 636–673 nm | 30 m |
| Band 5 — Near-Infrared (NIR) | 851–879 nm | 30 m |
| Band 6 — SWIR 1 | 1566–1651 nm | 30 m |
| Band 7 — SWIR 2 | 2107–2294 nm | 30 m |
| Band 8 — Panchromatic | 503–676 nm | 15 m |
| Band 9 — Cirrus | 1363–1384 nm | 30 m |
| Band 10 — TIR 1 (Thermal) | 10,600–11,190 nm | 100 m |
| Band 11 — TIR 2 (Thermal) | 11,500–12,510 nm | 100 m |
How Landsat 9 Bands Support Environmental Analysis
The two thermal Landsat 9 bands (10 and 11) detect thermal energy alongside visible and near-infrared light, supporting detection of changes in water supply and other natural resources tied to droughts, soil erosion, and rainfall disturbances. TIRS-2 also helps detect and remove cloud cover contamination from raw data, improving overall image quality before it reaches your workflow.
Applications for Landsat 9 Satellite Imagery
Agriculture
Landsat 9 enhances agricultural productivity by providing high-quality multispectral and thermal data for reliable crop monitoring and smarter planning.
- Crop condition analysis: detect stress and growth stages with NDVI and other indices.
- Yield prediction support: track vegetation trends and seasonal patterns to estimate productivity.
- Soil moisture estimation: analyze irrigation needs using Landsat 9 thermal and spectral data.
- Irrigation planning: spot water-stressed zones and improve irrigation timing.
- Field boundary mapping: map cropland with updated Landsat 9 satellite images.
Construction and Urban Planning
Landsat 9 data supports monitoring of rapidly changing urban areas with consistent, timely imagery.
- Urban expansion detection: track land use changes with recent, cloud-free Landsat 9 data.
- Infrastructure monitoring: observe construction and city growth over time.
- Environmental impact analysis: evaluate how development affects vegetation and ecosystems.
- Urban heat island monitoring: detect temperature hotspots with thermal band data.
- Pre-development assessment: review site conditions before major projects begin.
Environmental and Climate Change
Landsat 9 extends decades of Earth monitoring with detailed imagery to detect early signs of environmental change and support climate action.
- Forest disturbance tracking: monitor deforestation and reforestation with frequent revisit data.
- Wetland and water monitoring: track seasonal and long-term surface water trends.
- Climate impact analysis: observe glacier retreat, vegetation shifts, and land degradation.
- Disaster damage mapping: assess impacts of fires, floods, and droughts.
- Biodiversity assessment: detect ecosystem changes and threats to protected areas.
Turn Landsat 9 Images into Valuable Insights
Indices & Band Combinations
Choose from 20+ preconfigured indices and band combinations across every Landsat 9 band to monitor vegetation, soil, and environmental indicators, or build custom indices for specific needs.
Change Detection
Compare Landsat 9 satellite images captured at different times to reveal landscape change from urban growth, environmental degradation, or natural disasters.
Time Series Analysis
Build time series graphs from Landsat 9 satellite images to track seasonal cycles, ecological shifts, and the progression of urban development.
Full Technical Specifications
Sensor & Coverage
| Provider | NASA / United States Geological Survey (USGS) |
| Instruments | OLI-2 & TIRS-2 |
| OLI-2 Built By | Ball Aerospace & Technology Corp. |
| TIRS-2 Built By | NASA Goddard Space Flight Center |
| Spectral Bands | 11 total (9 OLI-2 + 2 TIRS-2) |
| Daily Scene Count | ~750 scenes per day |
| Stereo Imaging | Not available |
Orbit & Mission
| Orbit Type | Sun-synchronous, near-polar |
| Altitude | 705 km (438 mi) |
| Inclination | 98.2° |
| Spacecraft Speed | ~16,760 mph |
| Repeat Cycle | 16 days solo; 8 days combined with Landsat 8 |
| Design Life | 5 years; consumables rated for 10+ years |
| Launch Date | September 27, 2021 |
| Launch Vehicle / Site | Atlas V401, Vandenberg Space Force Base |
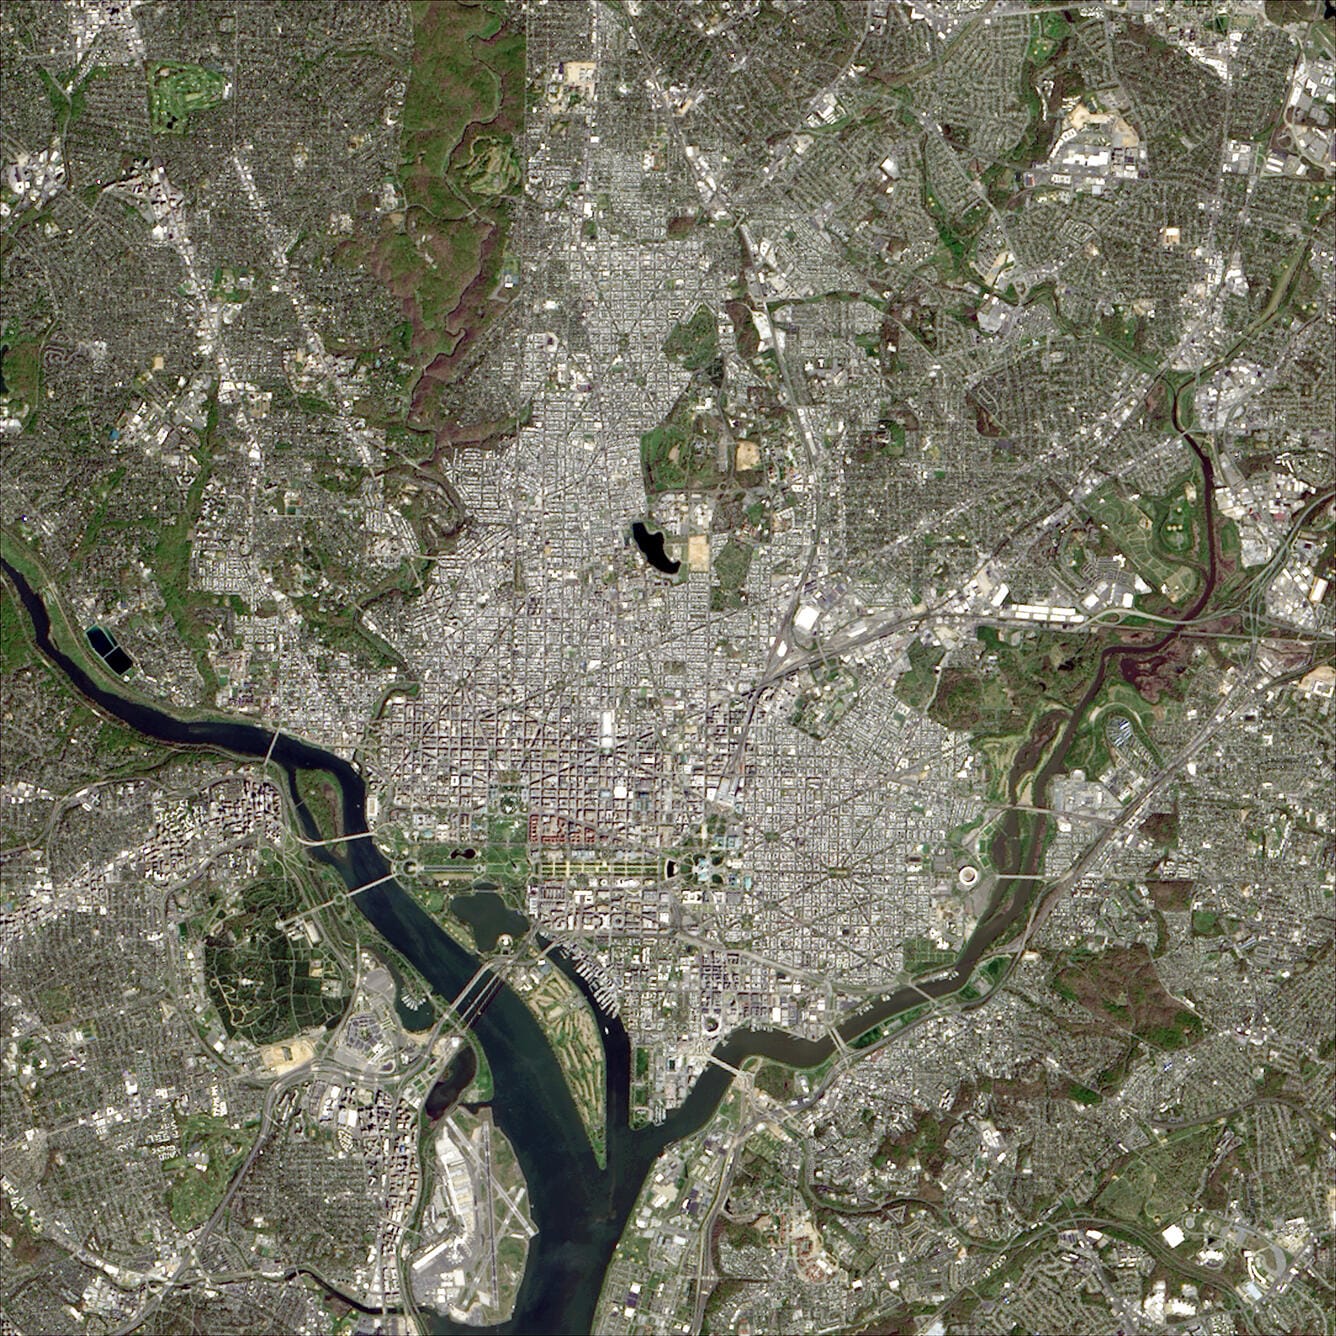
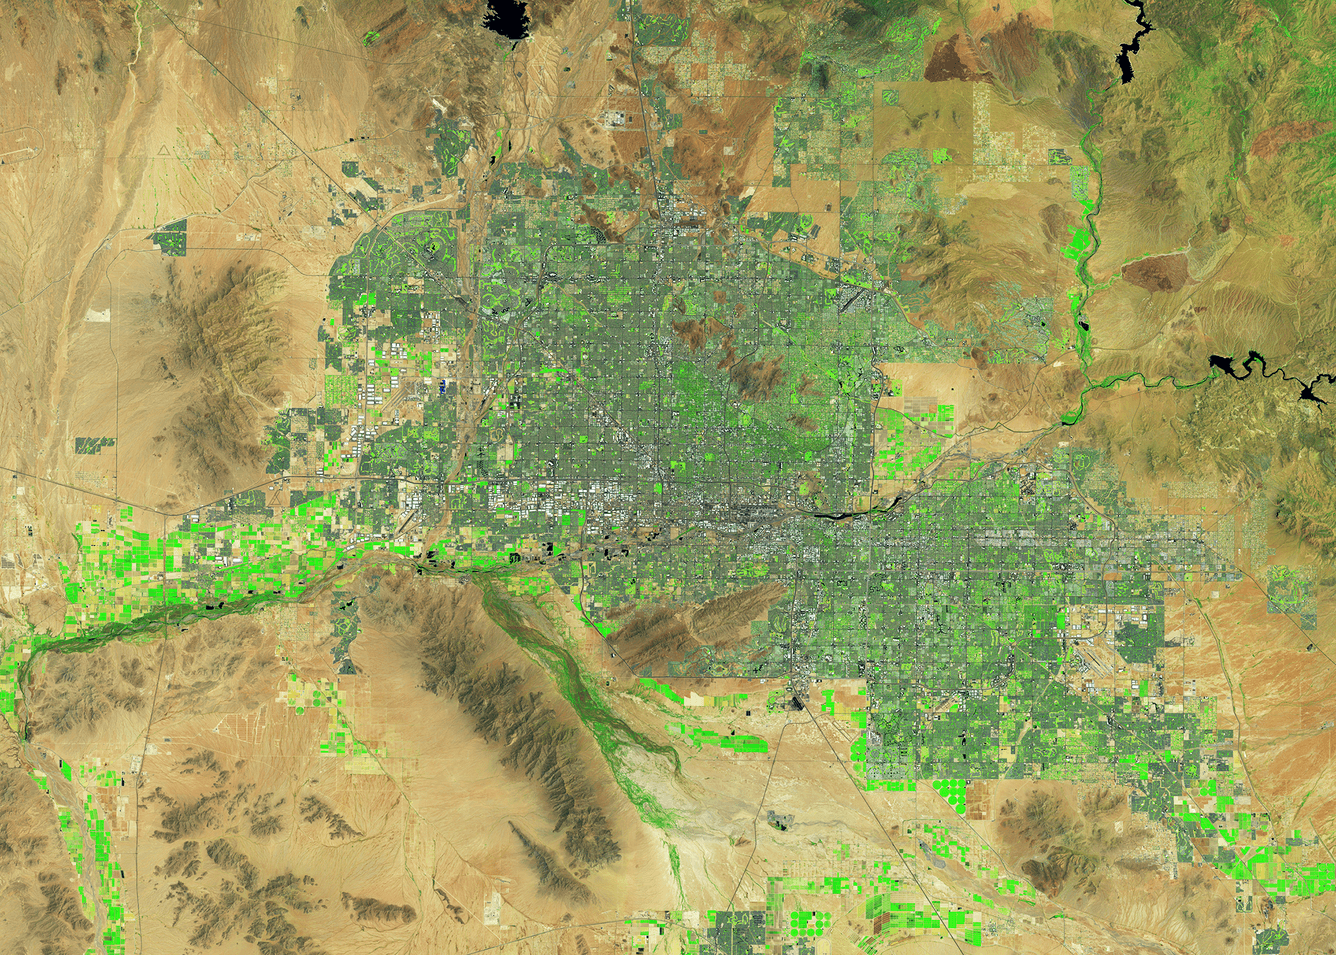
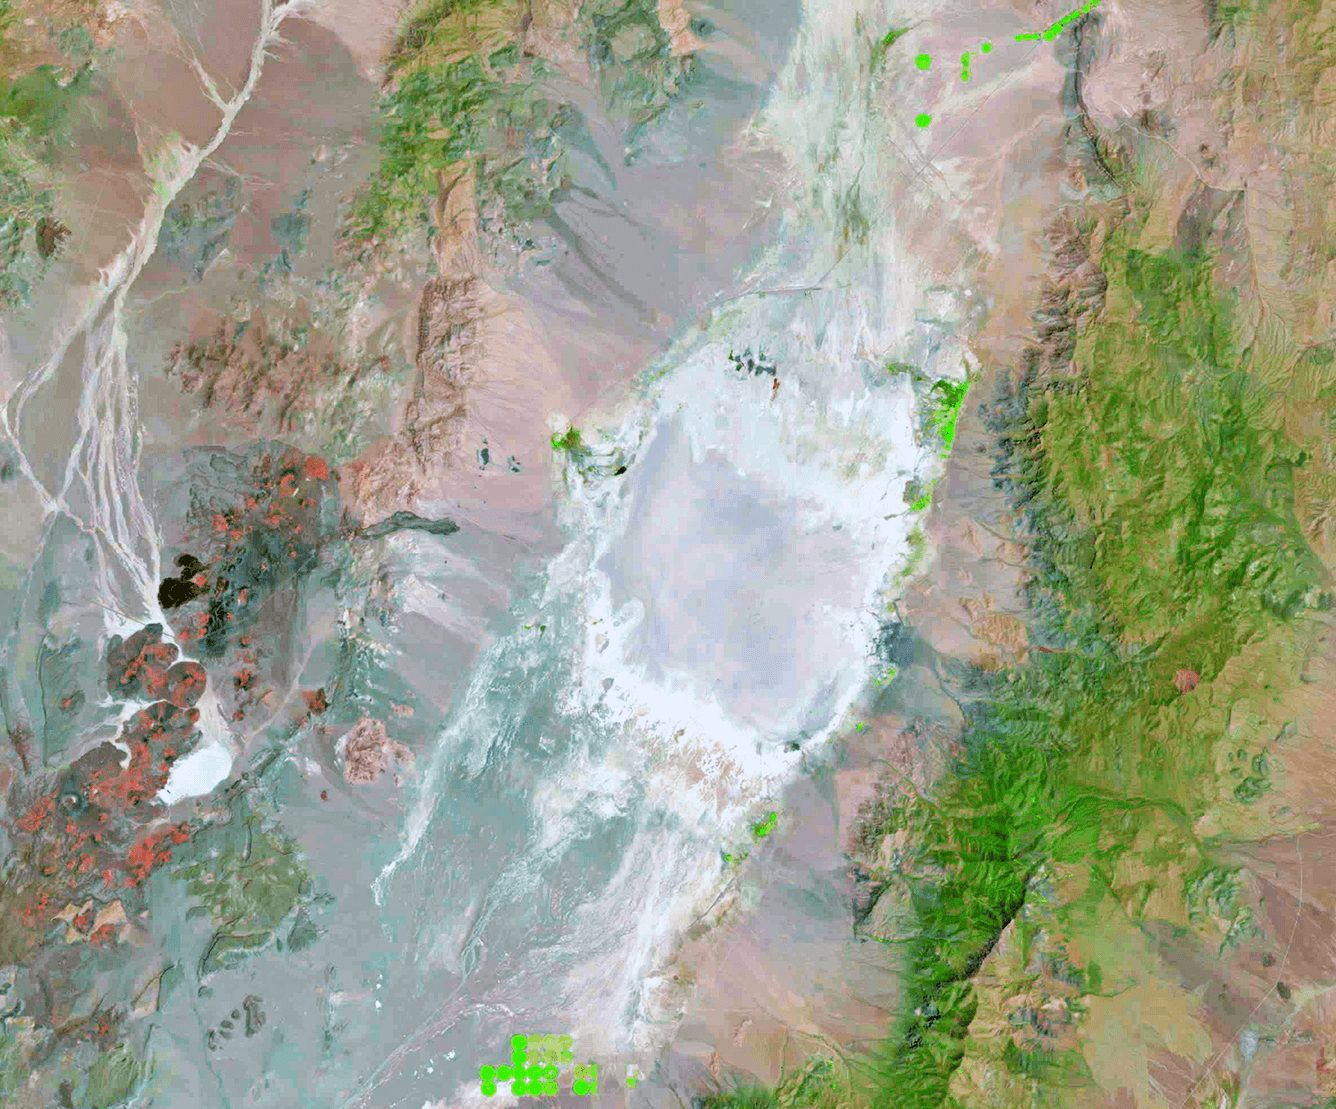
Landsat 9 Satellite Image Gallery
Key Features and Benefits of the Landsat 9 Satellite
- Cost-Effective, Open DataLandsat 9 satellite imagery is available under a Creative Commons-like license, ideal for public, commercial, and academic use.
- Wide Swath, Frequent RevisitA 185km swath and 16-day cycle, improving to 8 days when combined with Landsat 8, delivers repeatable coverage for global change detection.
- Improved Thermal SensingTIRS-2 reduces stray light contamination and improves cloud detection compared to the sensor flown on Landsat 8.
- Part of a 50+ Year ArchiveContinuity with the full Landsat program record supports long-term research and policy planning back to 1972.
End-to-End Support to Download Landsat 9 Images
Expert Consultation
Our geospatial specialists help you choose the right Landsat 9 bands and resolution tier for your analysis.
Rapid Delivery
Direct access to a 130+ satellite constellation network, including the ongoing Landsat 9 archive, for faster turnaround.
Seamless Integration
Landsat 9 images delivered in industry-standard formats, ready for your GIS, CAD, or modeling workflow.
Common Questions About the Landsat 9 Satellite
When was Landsat 9 launched?
Landsat 9 launched on September 27, 2021, from Vandenberg Space Force Base in California aboard a United Launch Alliance Atlas V401 rocket.
What is the resolution of Landsat 9?
15m for the panchromatic Band 8, 30m for the multispectral OLI-2 bands, and 100m for the native thermal TIRS-2 bands, resampled to 30m for delivery.
How many Landsat 9 bands are there?
11 total: nine bands from the OLI-2 instrument (coastal aerosol through cirrus) and two thermal bands from TIRS-2.
Is Landsat 9 satellite data free to use?
Yes. Landsat 9 imagery is available under an open, Creative Commons-like license, suitable for public, commercial, and academic use.
How do I download Landsat 9 images for my area of interest?
XRTech Group sources, processes, and delivers Landsat 9 images matched to your AOI, date range, and preferred bands, in analysis-ready formats for GIS and remote sensing software.
Ready to View and Download Landsat 9 Images?
Talk to our geospatial team about band selection, resolution needs, and delivery for your area of interest.