
Emergency Satellite Imagery
XRTech Group delivers emergency satellite imagery for floods, glacier lake outbursts, wildfires, storms, earthquakes, tsunamis, volcanic eruptions and oil spills, anywhere on Earth. Emergency tasking goes to the satellite immediately and data reaches you within 24 hours, from $66/km² at 50cm and $80/km² at 30cm, with SAR for cloud and night.
✓Tasking command uploaded within 3 hours via 10+ ground stations
✓Optical and SAR from 130+ satellites
✓Flood, fire and damage maps, not just raw images
For national emergency agencies, fire departments, search and rescue teams, NGOs, insurers and energy operators. Response times as reported by XRTech Group.
24 h
Emergency data and damage maps delivered, as reported by XRTech Group
3 h
Tasking command upload through 10+ ground stations
25×/day
SuperView Neo revisit capacity over priority zones
130+
Optical and SAR satellites available for tasking
Emergency pricing
Emergency Satellite Imagery Prices: Emergency, Priority and Standard
XRTech Group's tasking prices in US dollars per km², the same for any location worldwide. Choose the tier by how soon you need the data: emergency within 24 hours, priority in 3 to 5 days, standard within 7 days. Pre-event archive gives you the before image for comparison.
Standard Tasking
Captured within 7 days | 30cm to 2m
30cm new tasking:
USD 30/km² (min. 100 km²)
50cm new tasking:
USD 20/km² (min. 100 km²)
For recovery planning when the deadline is a week away.
Get a QuoteFastest response
Emergency Tasking
Tasked immediately | data within 24 hours
30cm emergency:
USD 80/km²
50cm emergency:
USD 66/km²
For floods, fires, spills and damage that cannot wait.
Request Emergency CapturePriority Tasking
Captured in 3 to 5 days | 30cm and 50cm
30cm priority:
USD 45/km²
50cm priority:
USD 37/km²
When the deadline is days, not hours.
Get Priority TaskingPre-Event Archive
Before image for comparison | 30cm to 2m
30cm archive:
USD 20/km² (min. 25 km²)
2m archive:
USD 1/km² (min. 25 km²)
Delivered within 48 hours of order approval.
Order the Before ImageWhat changes an emergency quote
Sensor: optical prices above; SAR emergency collection is quoted per event
Area: new tasking from 100 km², archive from 25 km²
Cloud cover limit: 10% or less +$8/km², 5% or less +$15/km²
Viewing angle: 15° or less +$3/km², 10° or less +$9/km²
Analysis: flood extent, damage and InSAR maps quoted with the imagery
By disaster type
Emergency Response Imagery for Every Disaster
Each event needs a different sensor. XRTech Group matches the satellite to the disaster, so the first image you receive is one you can act on.
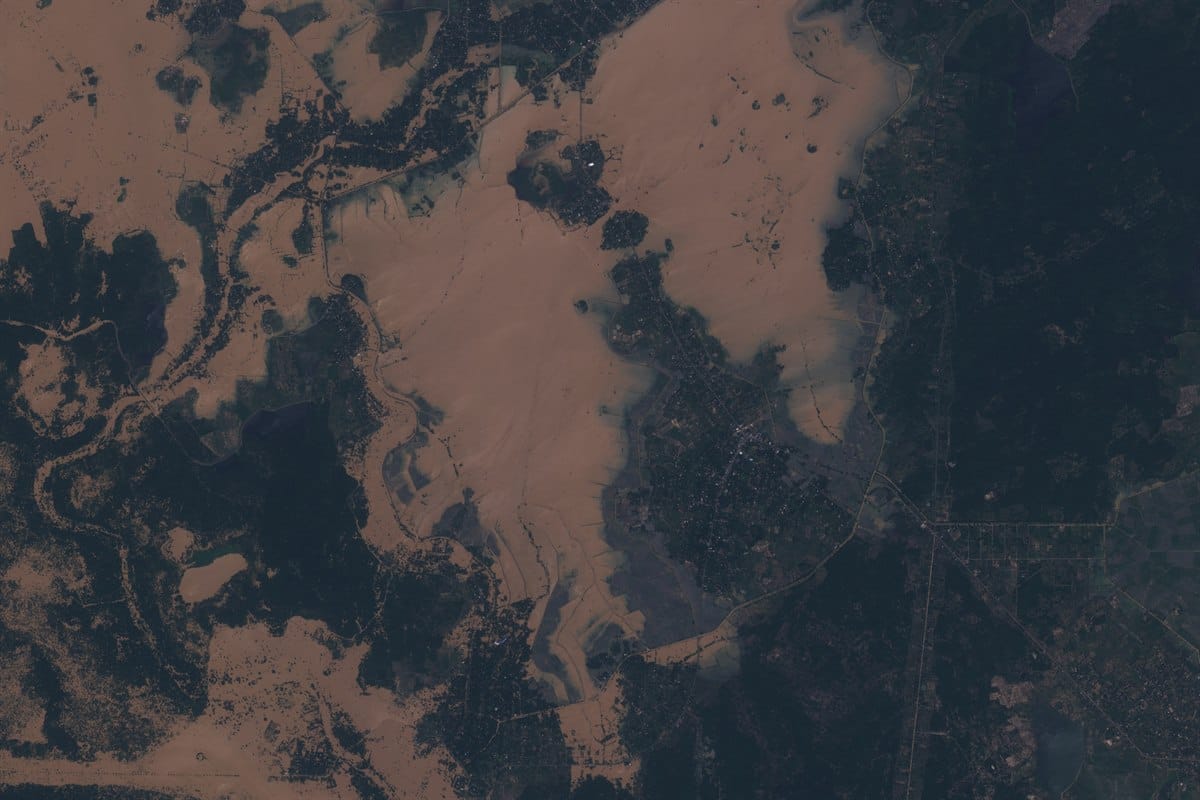
Floods and flash floods
SAR + 30cm
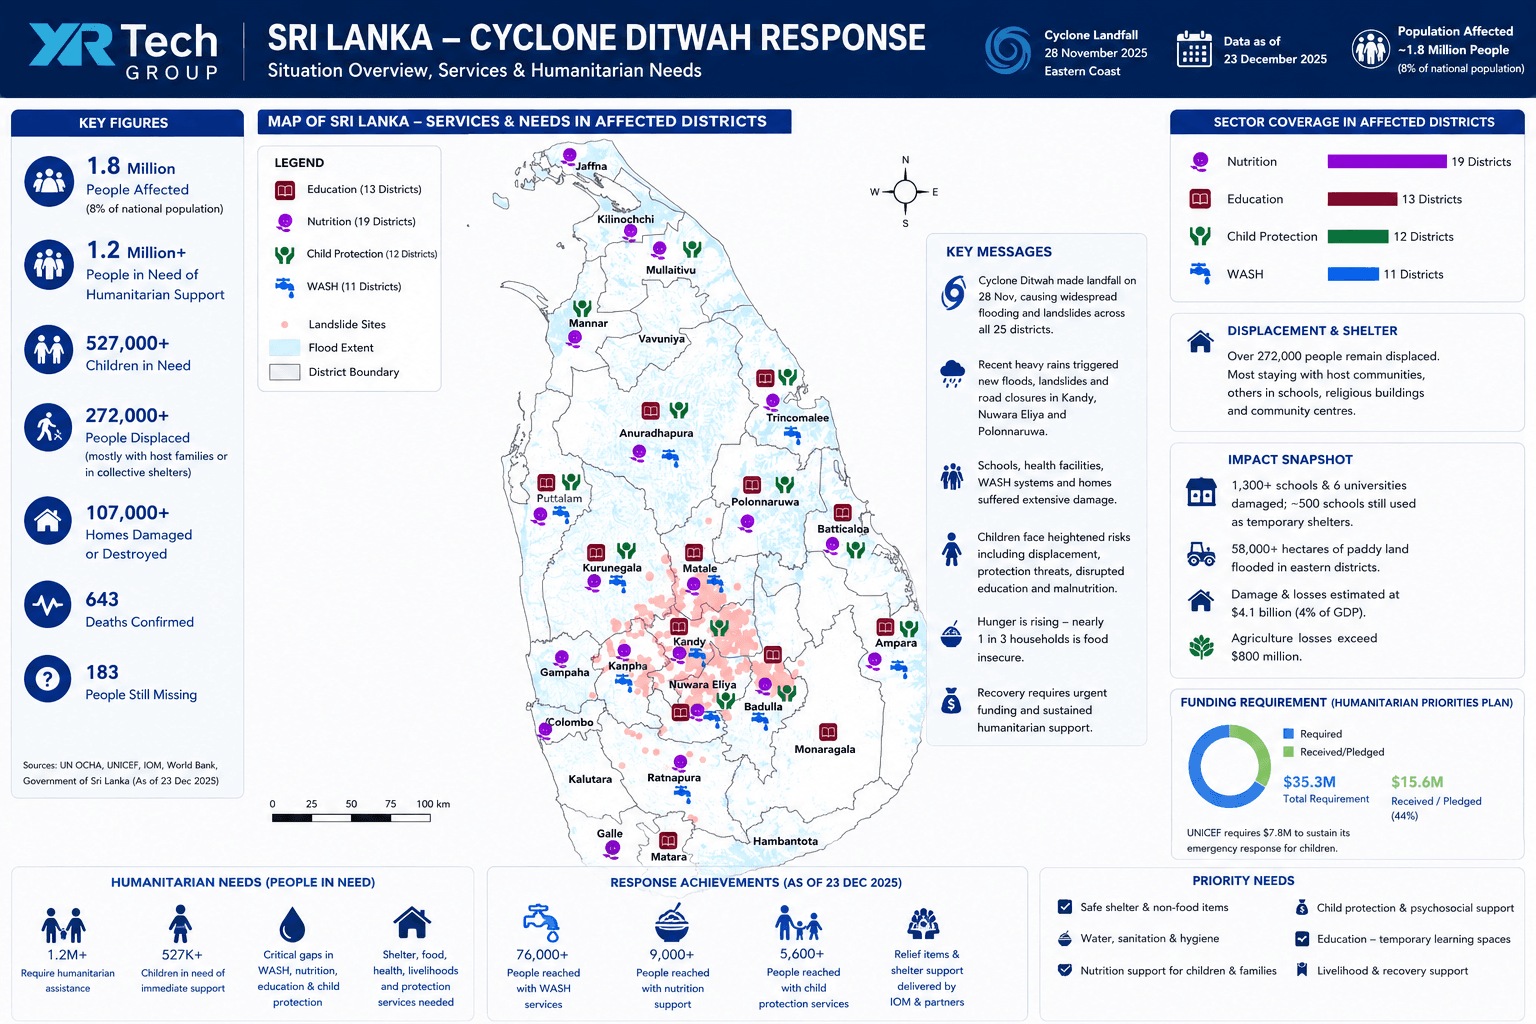
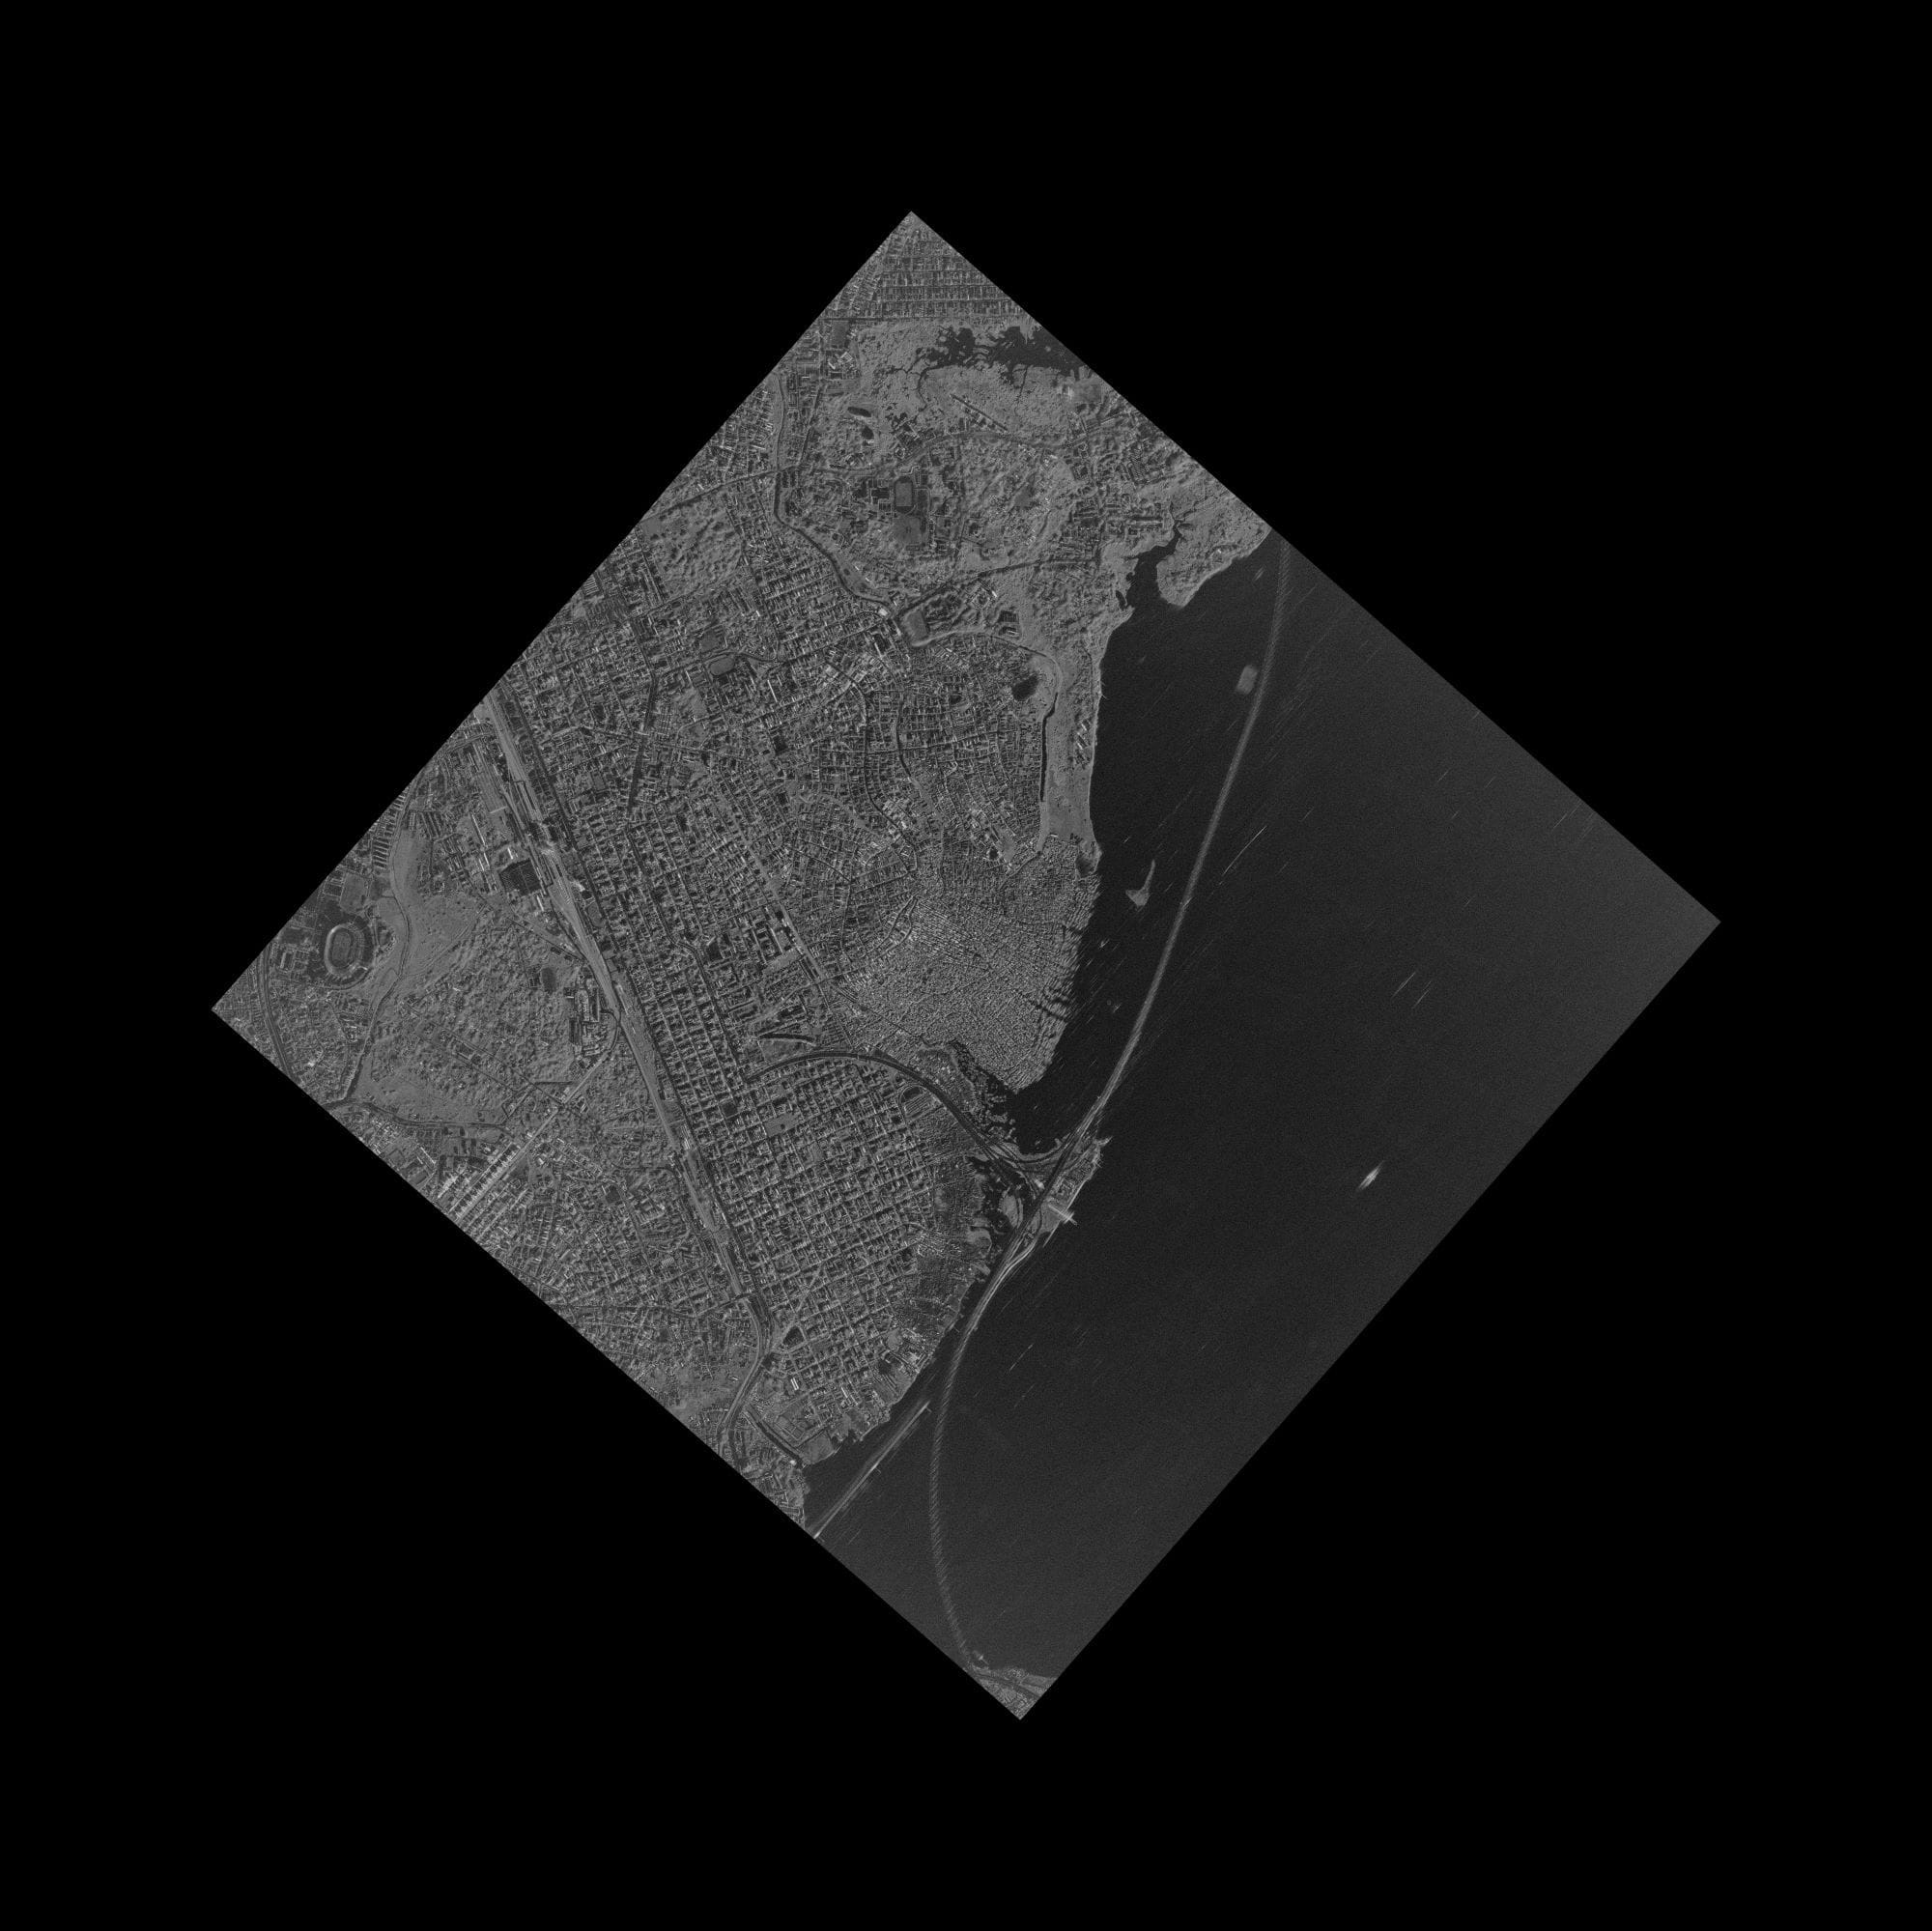
Radar maps standing water through cloud and rain, and 30cm optical shows damaged roads and buildings. See our Sri Lanka flood delivery.
Deliverable: flood extent and waterline vectors
Glacier melt and lake outburst floods
Optical + SAR
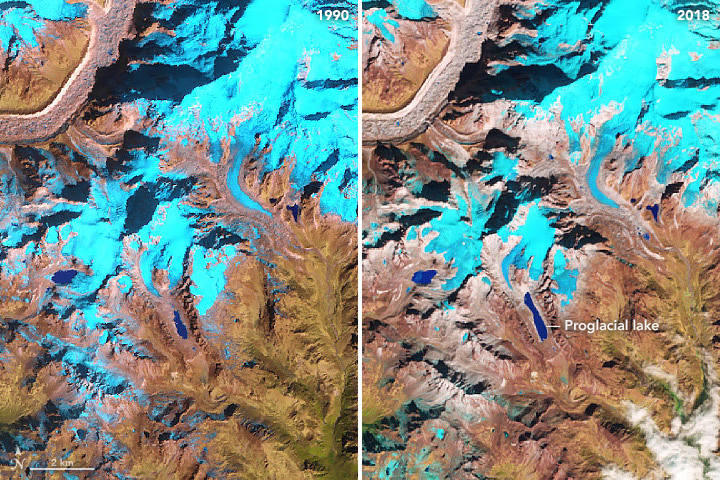
Optical imagery tracks glacial lakes as they grow. After an outburst, SAR and 50cm capture map the flood path, washed-out bridges and roads downstream.
Deliverable: lake extent and downstream flood maps
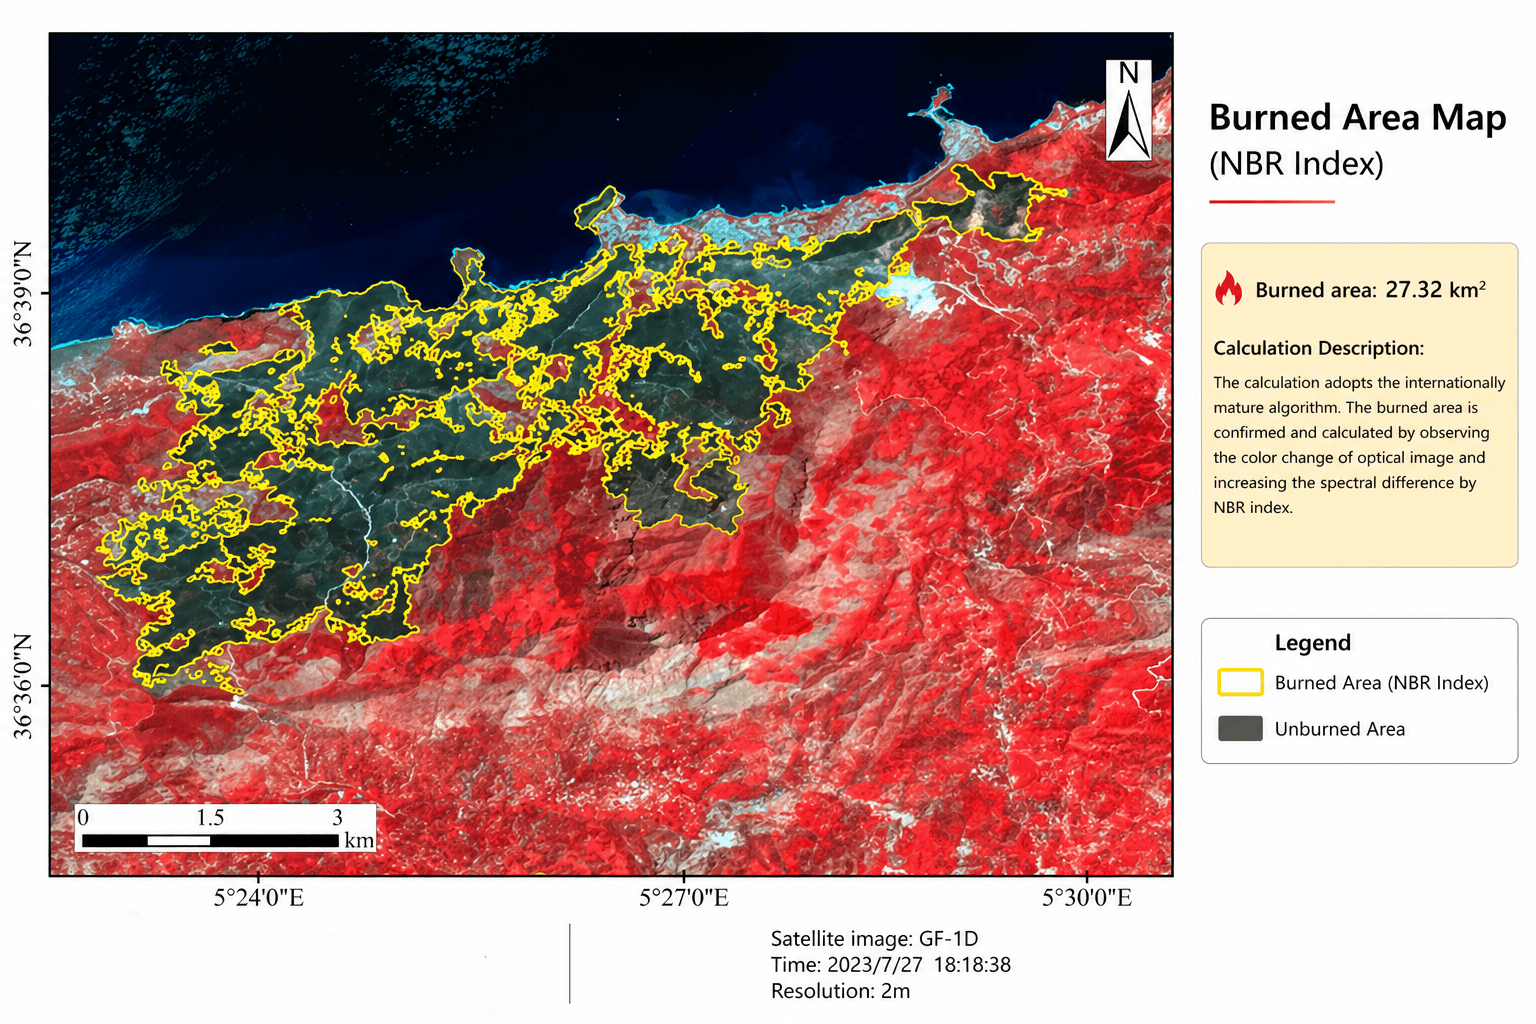
Wildfires
GF-4 + 2m
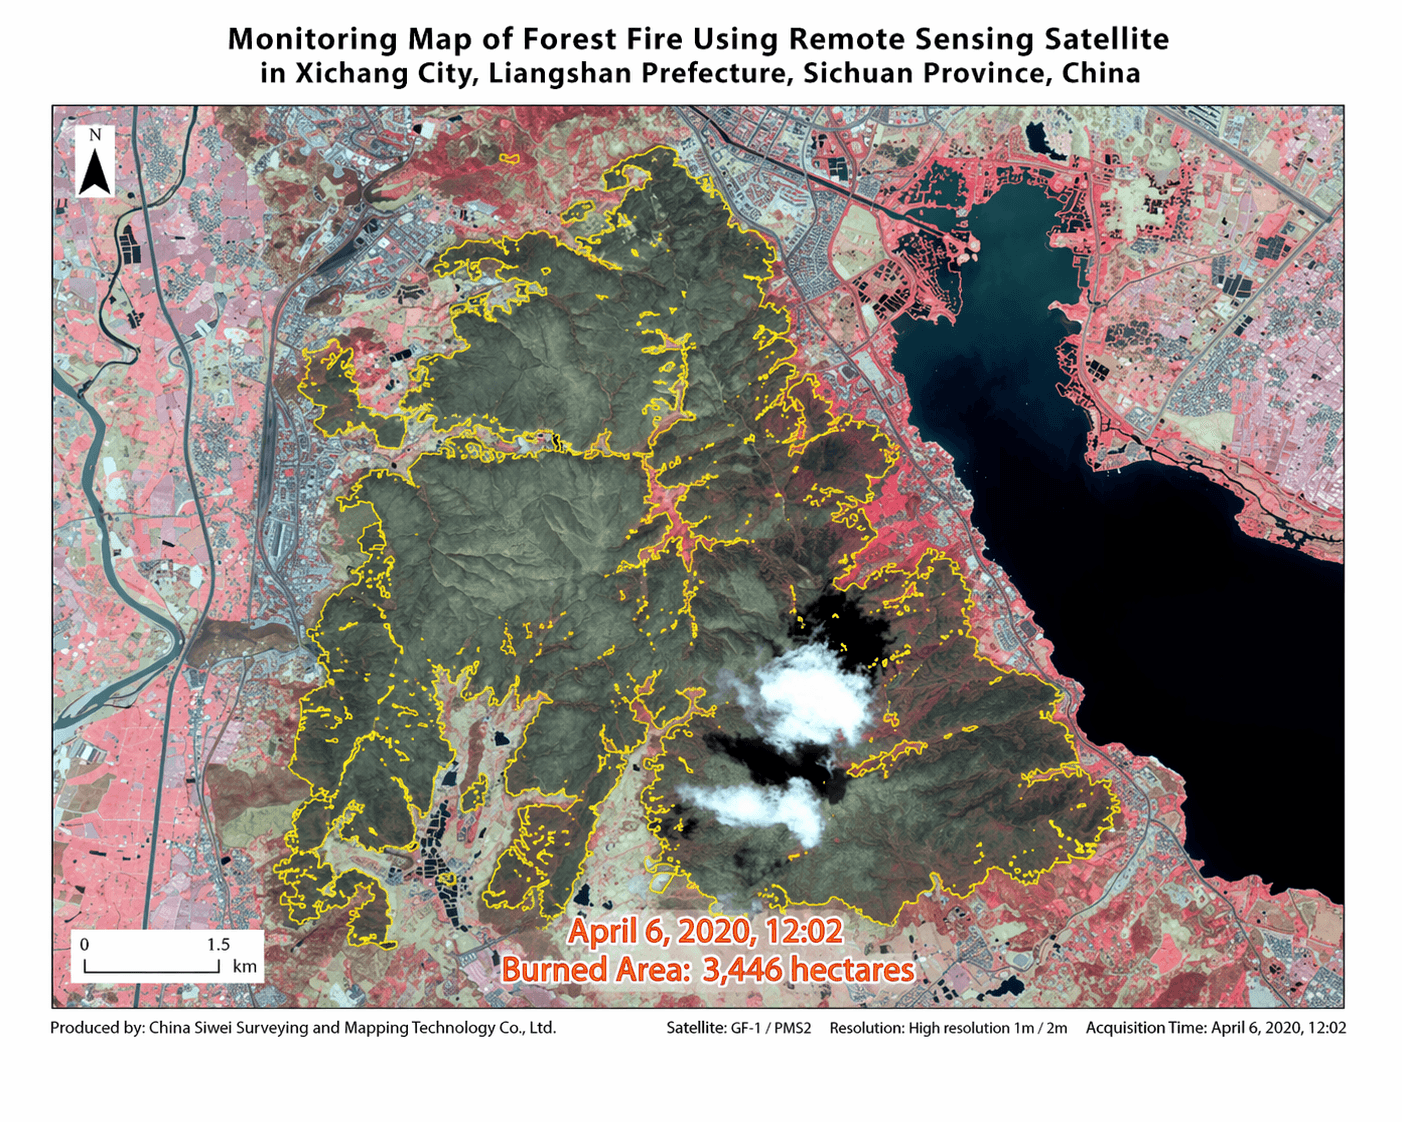
Geostationary Gaofen-4 refreshes every 20 seconds to follow the fire front, and 2m to 30cm optical maps the burn scar once smoke clears.
Deliverable: fire perimeter and burned area

Hurricanes and cyclones
SAR + 50cm
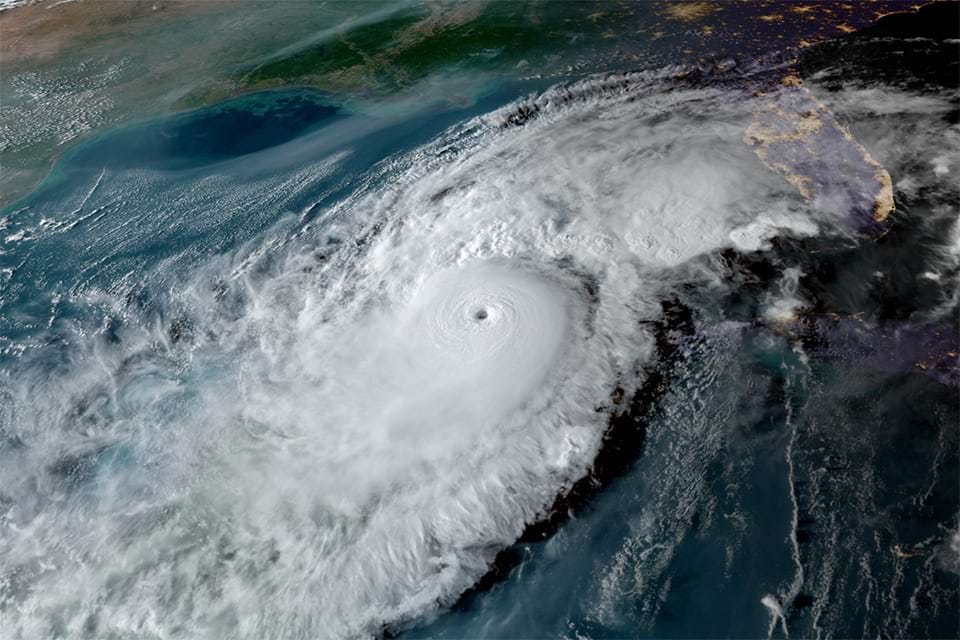
Pre-landfall archive plus post-storm SAR and optical capture for roof, coastline and infrastructure damage. See hurricane imagery.
Deliverable: before and after damage maps
Tsunamis and storm surge
SAR + 30cm
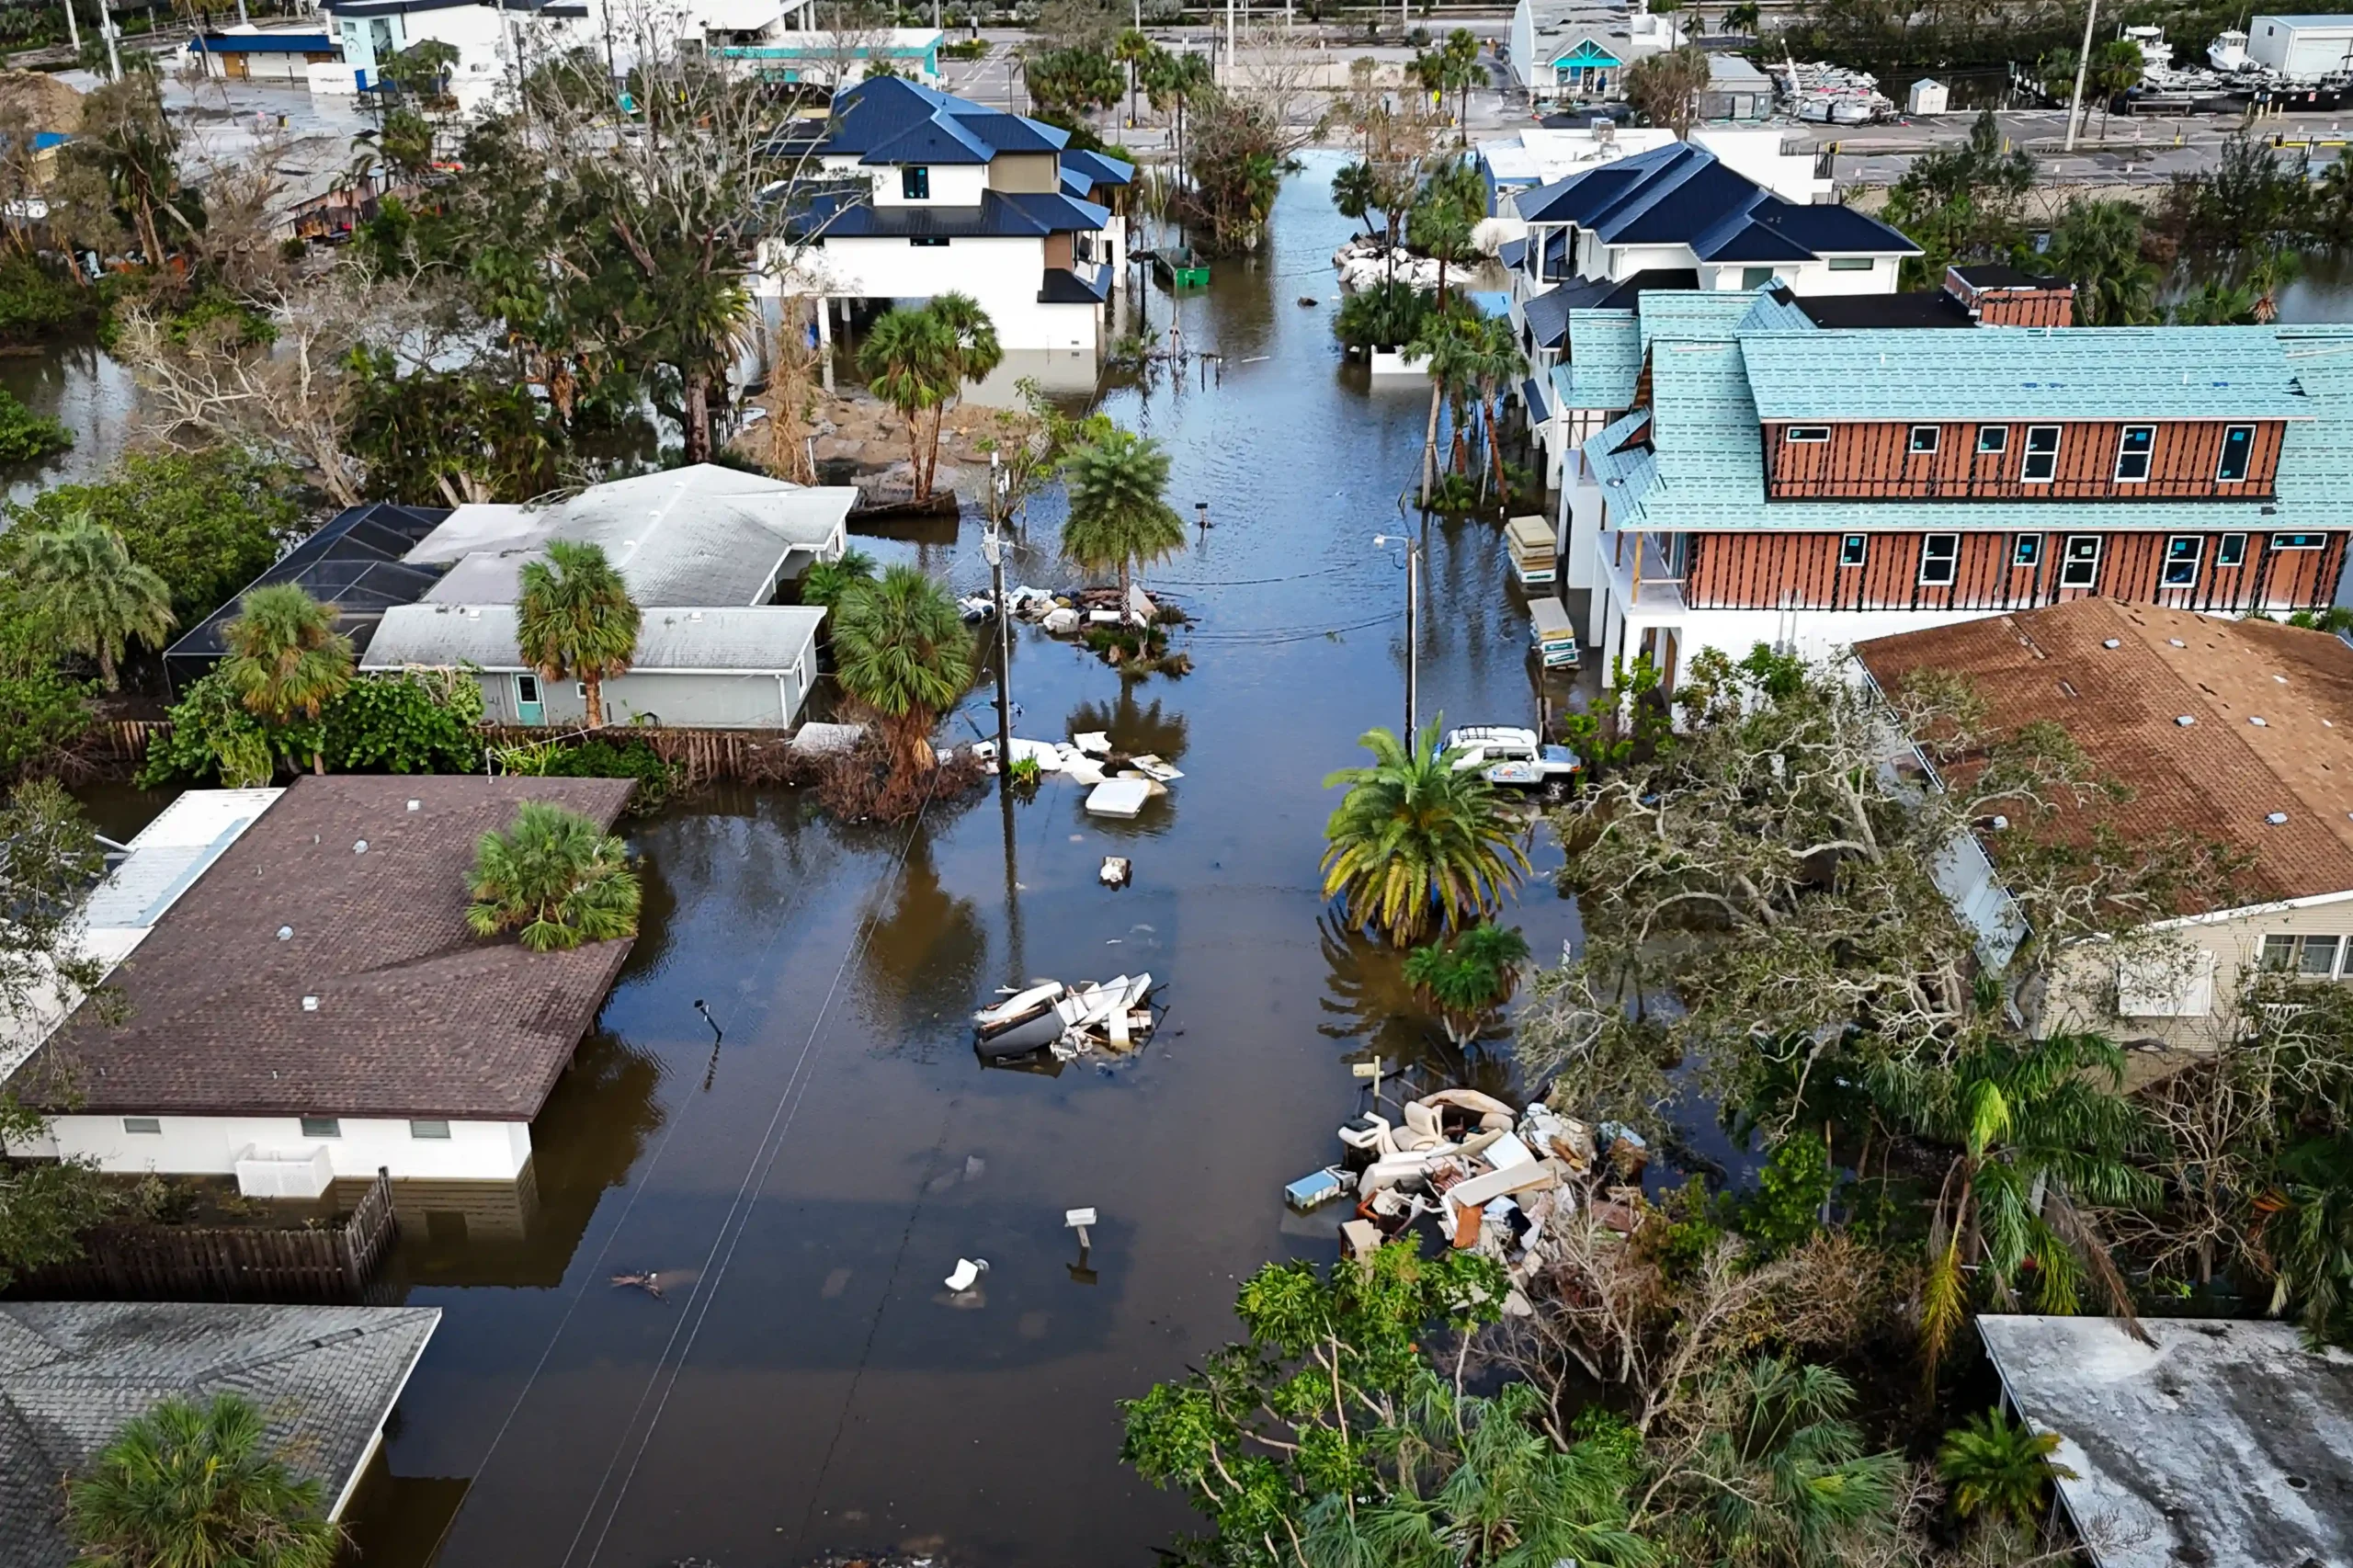
SAR maps coastal inundation through storm cloud, and 30cm optical shows damaged ports, homes and shorelines once the water drops.
Deliverable: coastal inundation and damage maps
Earthquakes
InSAR + 30cm
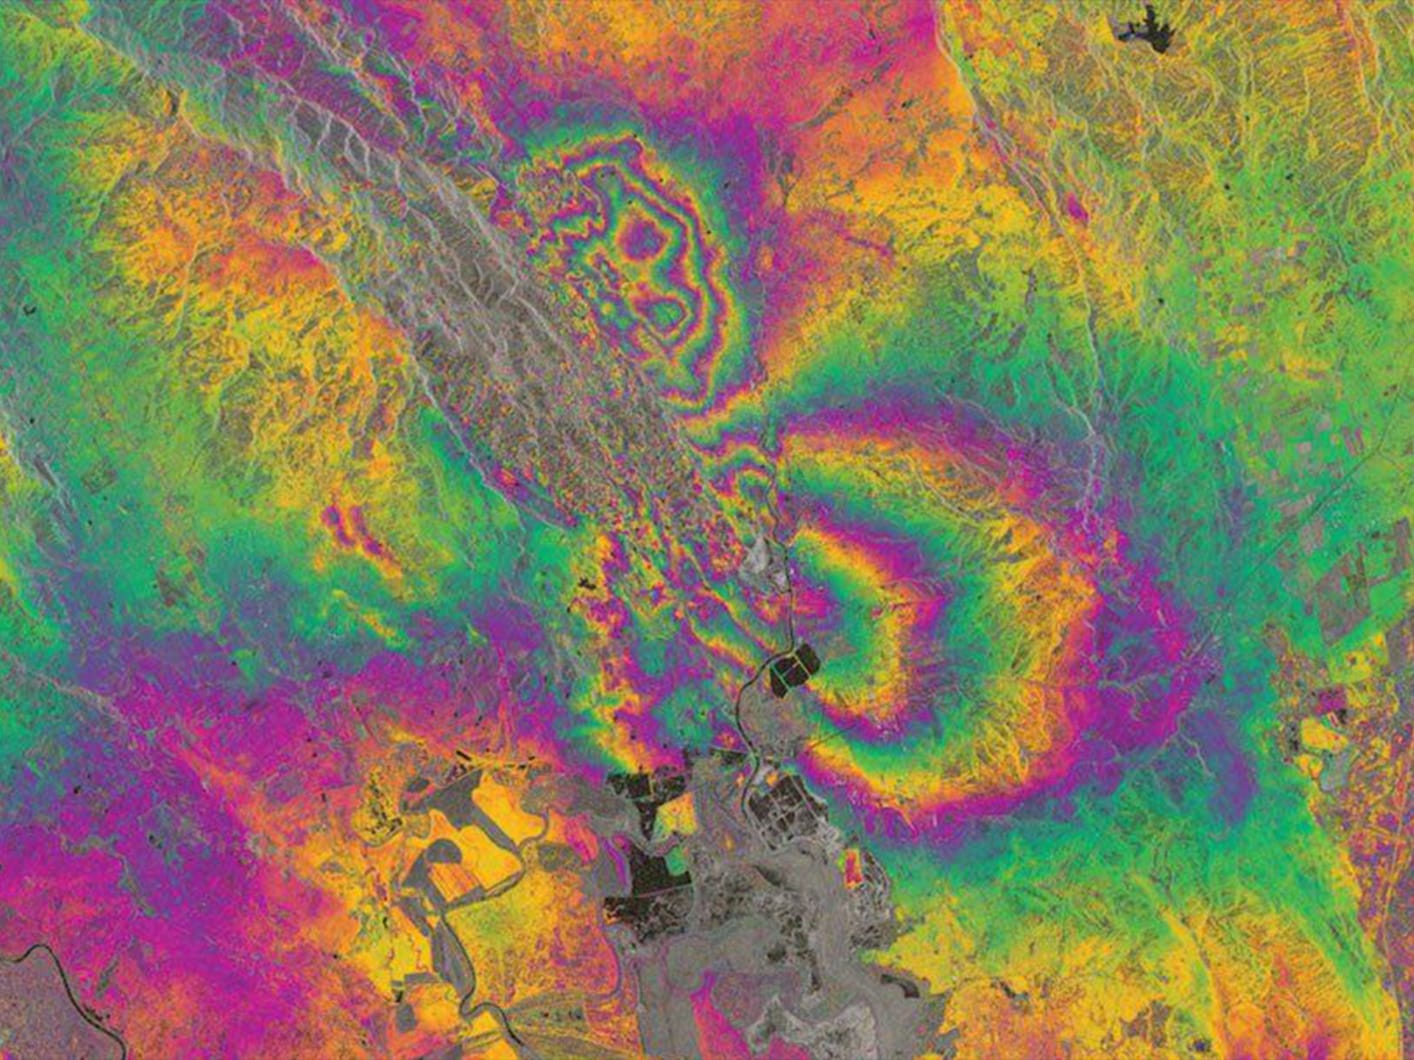
InSAR measures ground movement at millimetre scale under suitable conditions, and 30cm imagery shows collapsed buildings and blocked roads.
Deliverable: deformation and damage maps

Landslides and dam failures
L-band SAR
LT-1 L-band radar sees through vegetation, and stereo optical measures slope change around dams, bridges and roads.
Deliverable: slope and displacement layers

Volcanic eruptions
Thermal + SAR
Gaofen-4 mid-wave infrared tracks heat from lava, SAR images the ground under ash plumes, and optical maps the lava path and buried roads.
Deliverable: lava flow and ash extent maps

Oil spills
C-band SAR
Gaofen-3 C-band radar outlines slicks day and night through cloud. See SAR oil spill detection.
Deliverable: slick outline and drift tracking
Planning, risk and recovery: satellite imagery for disaster management →
Glacier, landslide and volcano examples: NASA Earth Observatory, Landsat data from the U.S. Geological Survey.
Who it is for
Who Buys Rapid-Response Satellite Imagery
Rapid-response satellite imagery is for the teams that act on a disaster within hours: emergency agencies, fire services, first responders and relief organisations, and for those who insure, supply or rebuild after it.
National Emergency and Disaster Management Agencies
Ministries of emergency situations, national disaster management authorities and civil defence use emergency imagery to see where water, fire or debris has reached, plan evacuation corridors and direct national response.
• Flood extent and evacuation zone layers
• Damage assessment by district
• Daily updates while the event lasts

Case studies
Emergency Response Case Studies With Delivery Times
Recent emergency deliveries by XRTech Group, with delivery times as reported by XRTech Group.
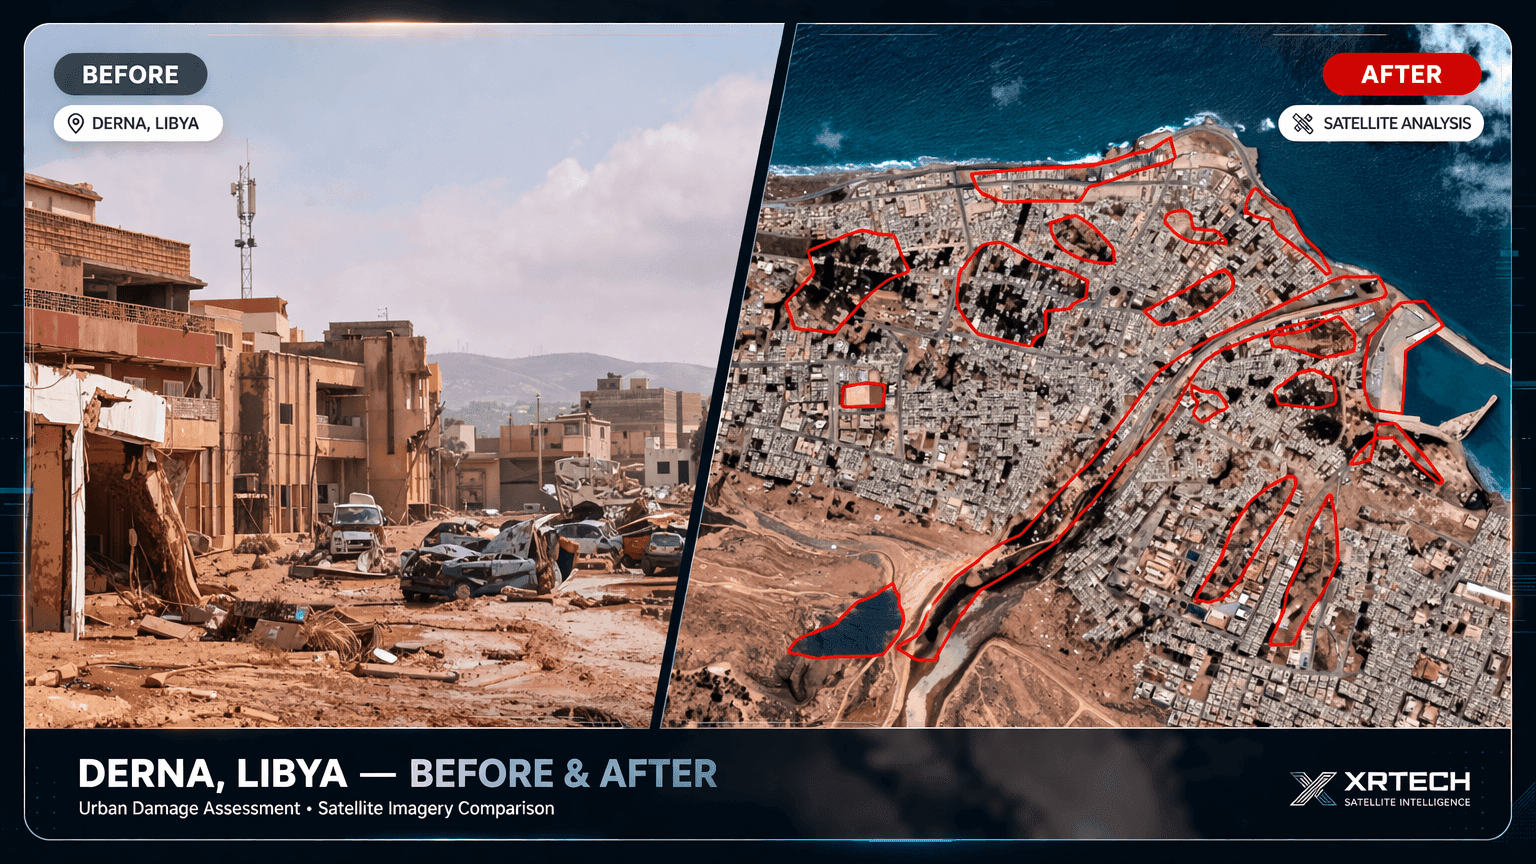
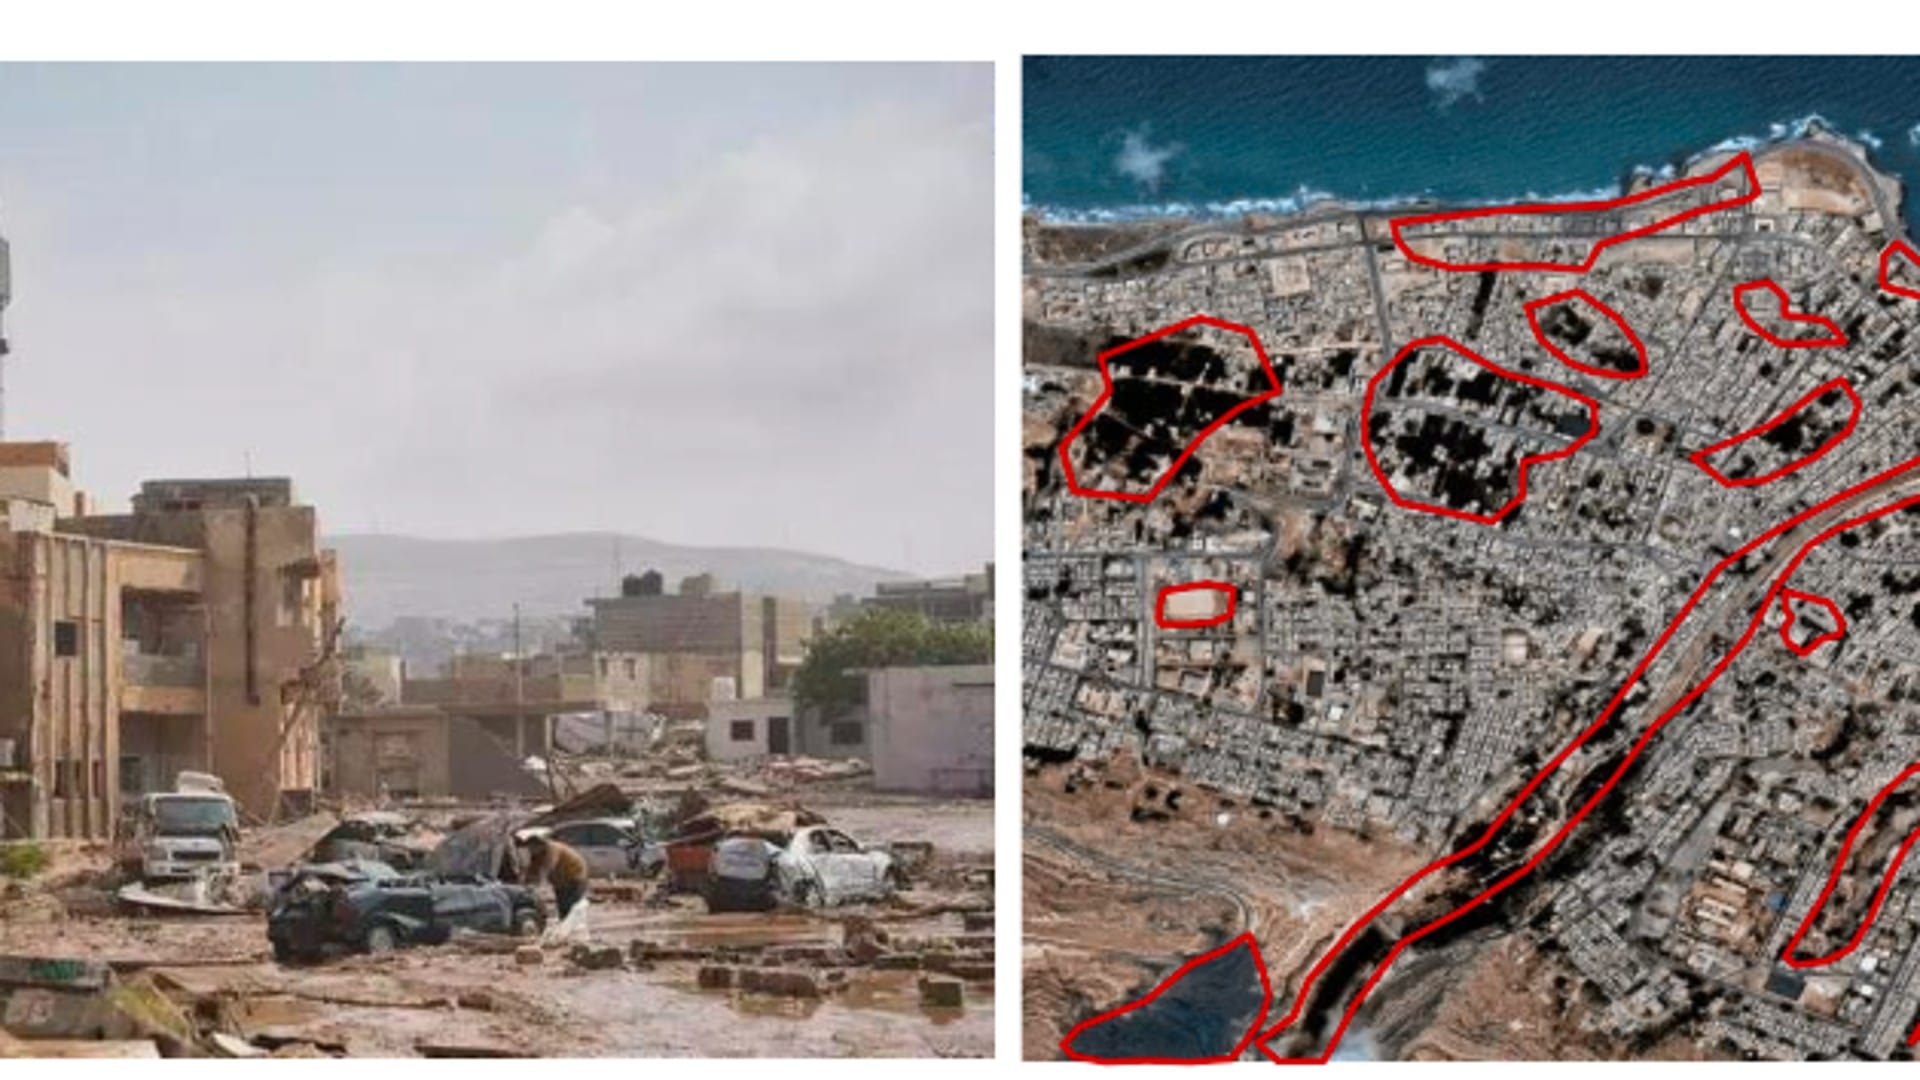
Derna, Libya floods
24 hours
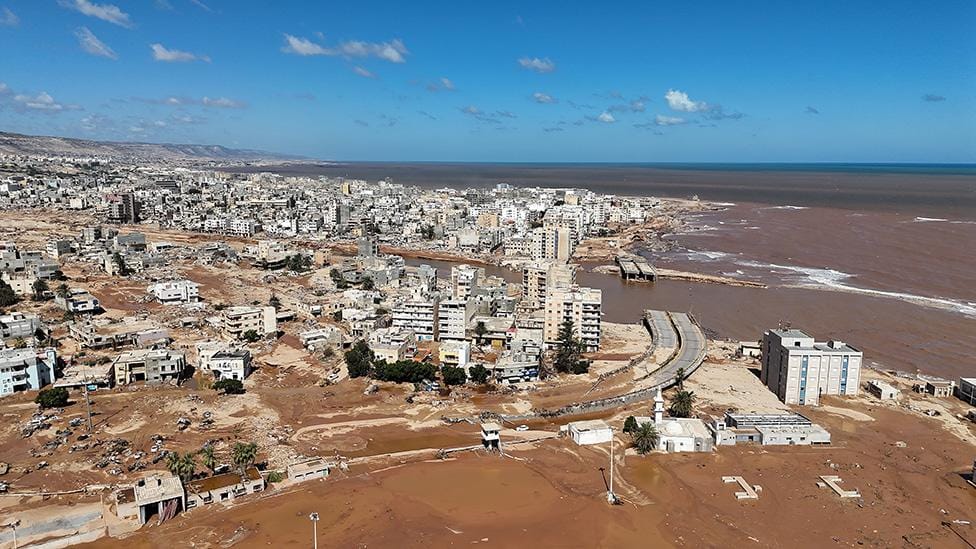
Challenge: Dam failures sent a flood through the city and cut roads, and responders needed to know which districts were under water and where people could be moved safely.
What we delivered: High-resolution flood extent maps and evacuation zone modelling within 24 hours of the disaster.
Flood extent maps · evacuation zones
Venezuela landslide and flood
Within hours
Challenge: Landslides and flash floods buried homes and blocked roads, and local rescue teams needed a current picture of where to search.
What we delivered: Emergency tasking imagery and situational assessments within hours to guide local rescue teams.
Emergency tasking · situational assessment
Sri Lanka, Cyclone Ditwah
3 days
Challenge: Severe flooding spread under persistent storm cloud, with large parts of the country affected at once.
What we delivered: Emergency flood satellite data in 3 days during severe storm conditions. Read the Sri Lanka case study.
Emergency flood data · storm conditions

Marine oil spills
4 days
Challenge: Oil at sea spreads fast, and slicks had to be found through darkness and cloud cover to direct containment.
What we delivered: Gaofen-3 SAR detected oil boundaries through darkness and cloud, with hundreds of data scenes within 4 days to guide marine containment.
Gaofen-3 SAR · hundreds of scenes
Sensors
SAR Satellite Services for Disaster Response
Emergency missions draw on more than 130 satellites, as reported by XRTech Group. The team picks the sensor that can see your area today, whatever the weather or time of day. See SAR satellite imagery.
✓Gaofen-3 C-band SAR at 1m: through cloud, rain, smoke and darkness
✓LT-1 L-band SAR at 3m: through vegetation, for InSAR ground movement
✓SuperView Neo system of 28 optical and SAR satellites: up to 25 revisits a day over priority zones
✓Gaofen-4 geostationary: 20-second refresh, 50m visible and 400m mid-wave infrared for fires
✓Optical at 30cm to 2m for damage detail once skies clear
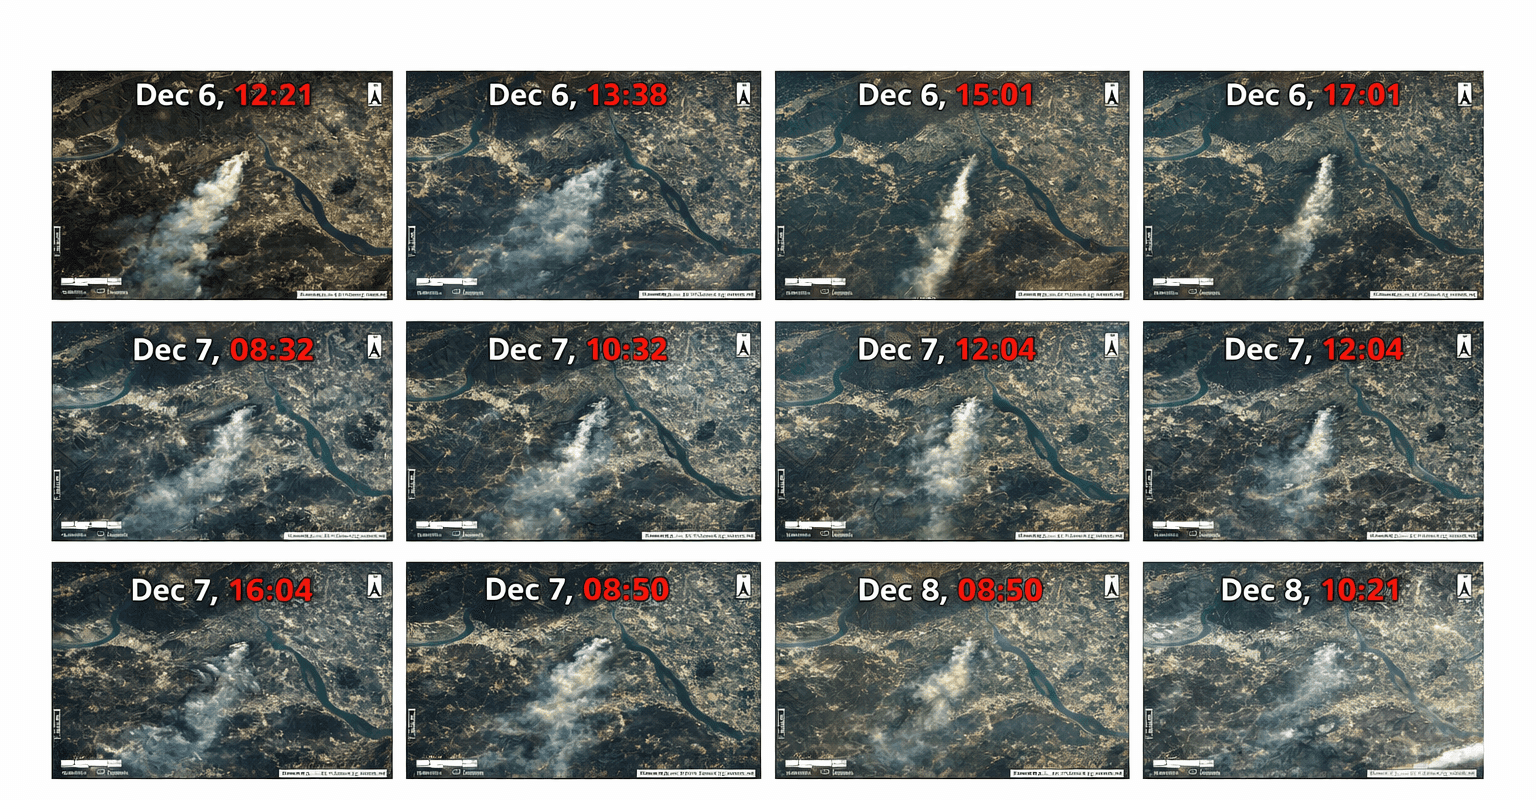
Watching the fire frontGaofen-4 frames from geostationary orbit show smoke and fire spread through the day.
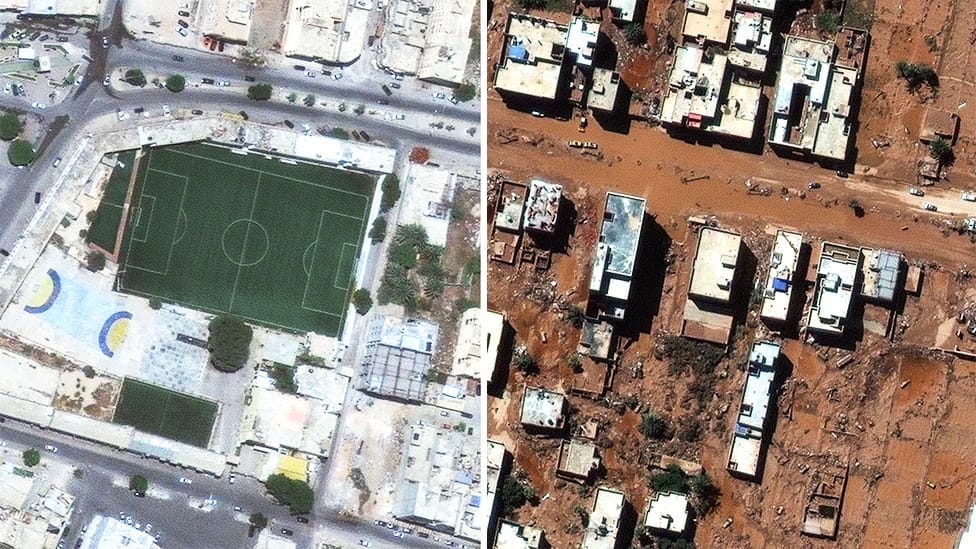
Derna, LibyaFlood extent and evacuation maps delivered within 24 hours.
Deliverables
Disaster Response Maps, Not Just Images
Raw imagery is only the start. XRTech Group analysts and AI models turn emergency imagery into layers your response team can load into GIS or open on a phone.
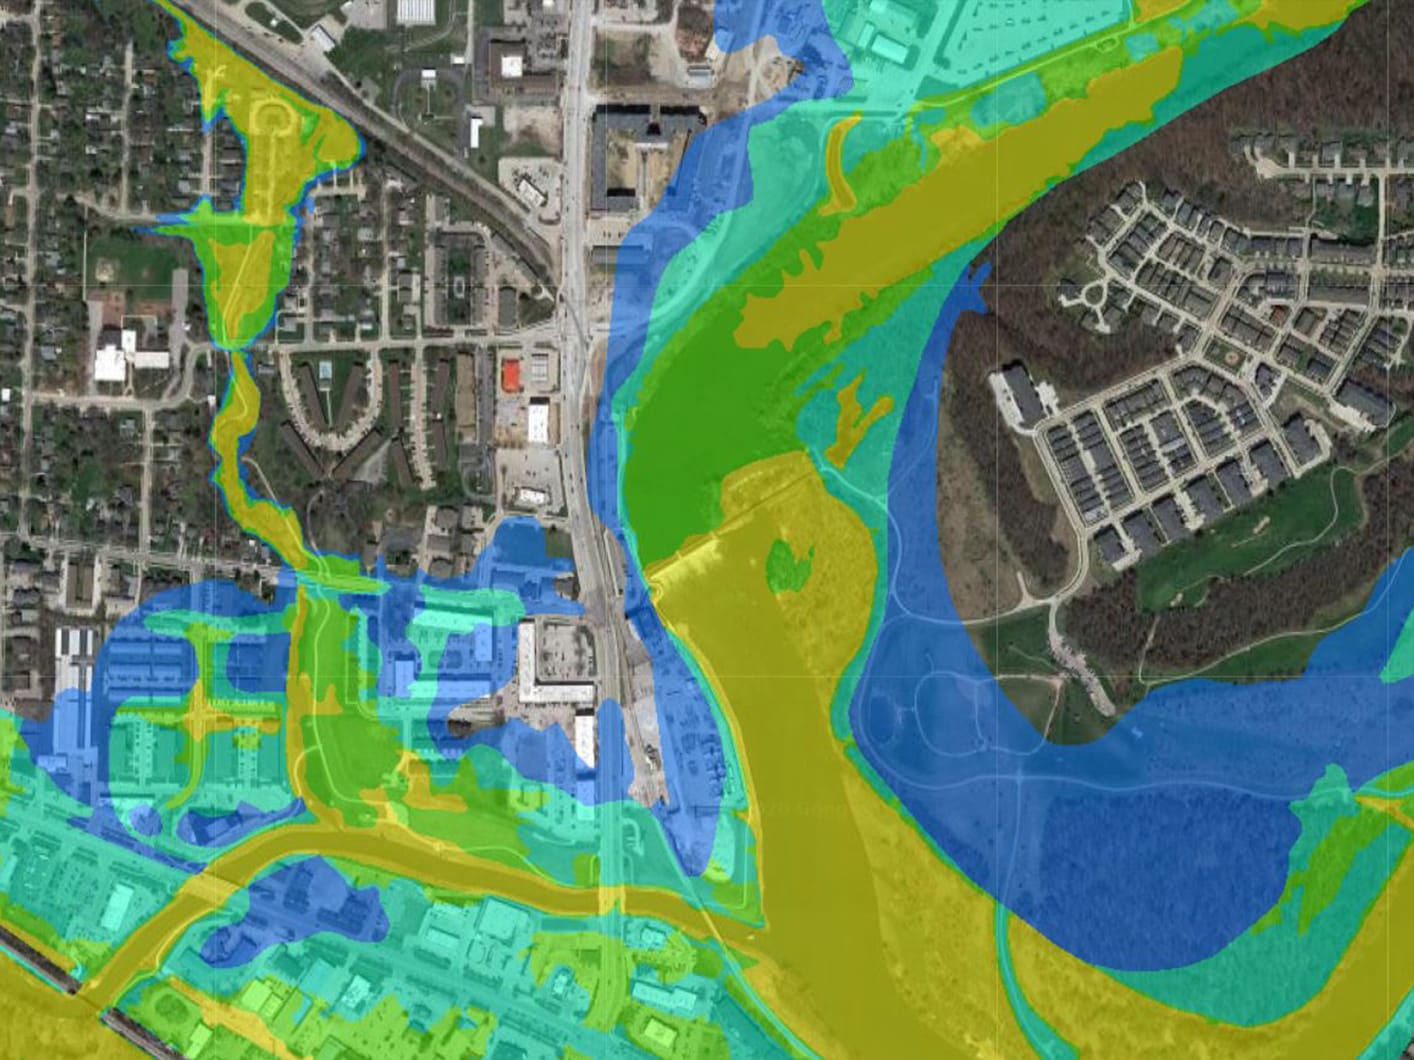
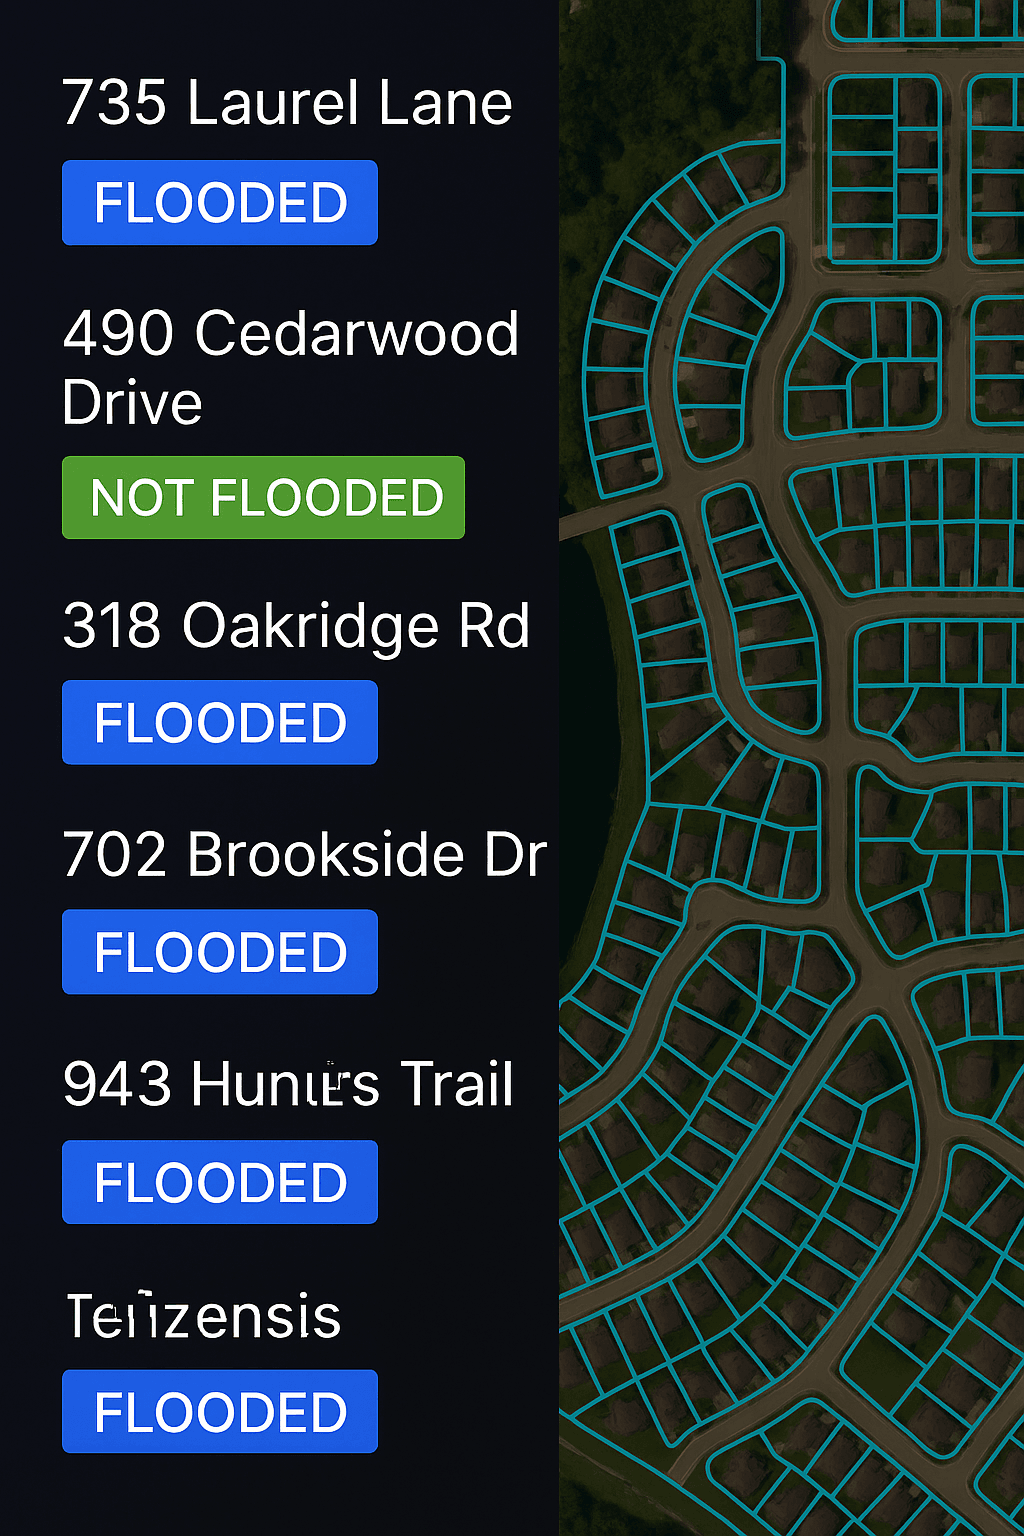
✓Flood extent and waterline vectors
✓Evacuation zone and safe corridor layers
✓Fire perimeter, burn scar and burned area
✓Before and after building damage maps
✓InSAR deformation on dams, bridges and slopes, millimetre-scale under suitable conditions
How to order
How to Order Emergency Satellite Imagery in 3 Steps
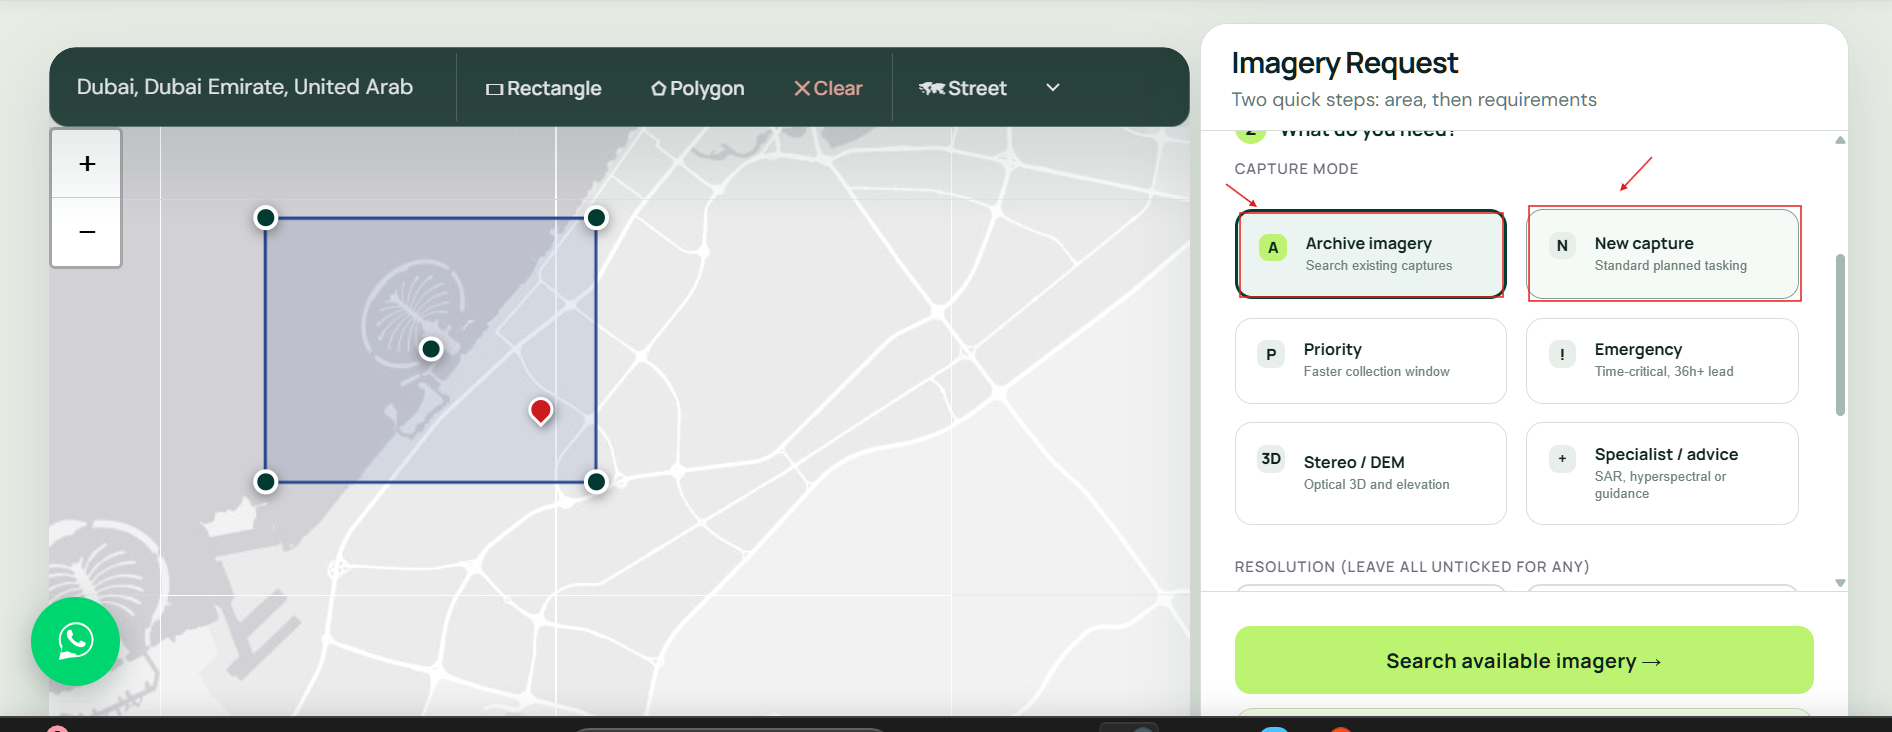
Send the area by emergency form or WhatsApp. The fastest start is a KML or coordinates, the event type and your deadline.
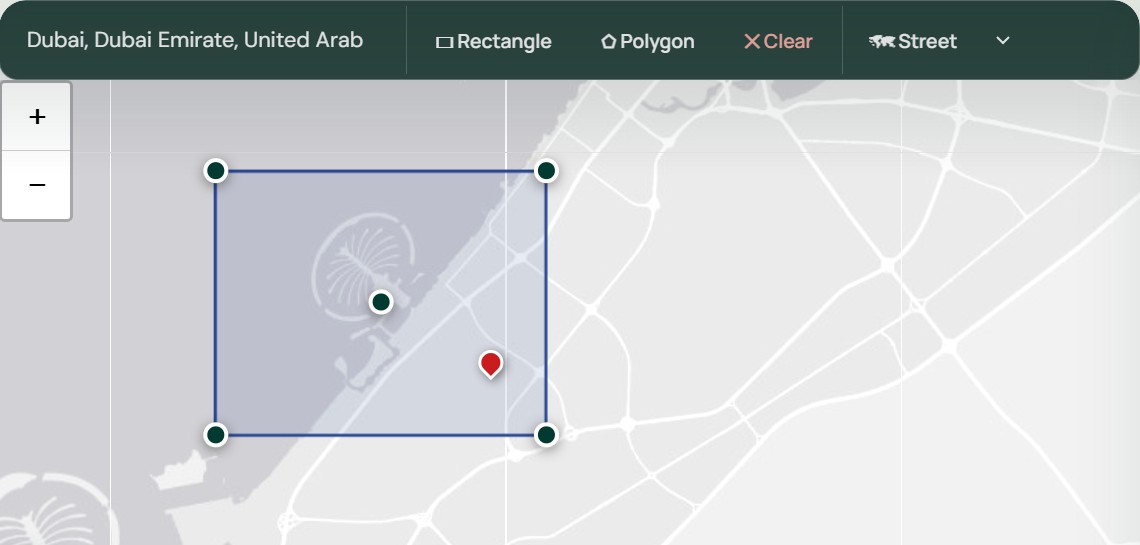
Step 1: Send the area and deadline
Use the emergency form or WhatsApp with a KML, KMZ, SHP or coordinates, what happened and when you need the data. No account is needed.
Storm cloud blocks opticalRadar images the ground underneath, day and night.
24/7 coverage
Optical and SAR for 24/7 Emergency Response Monitoring
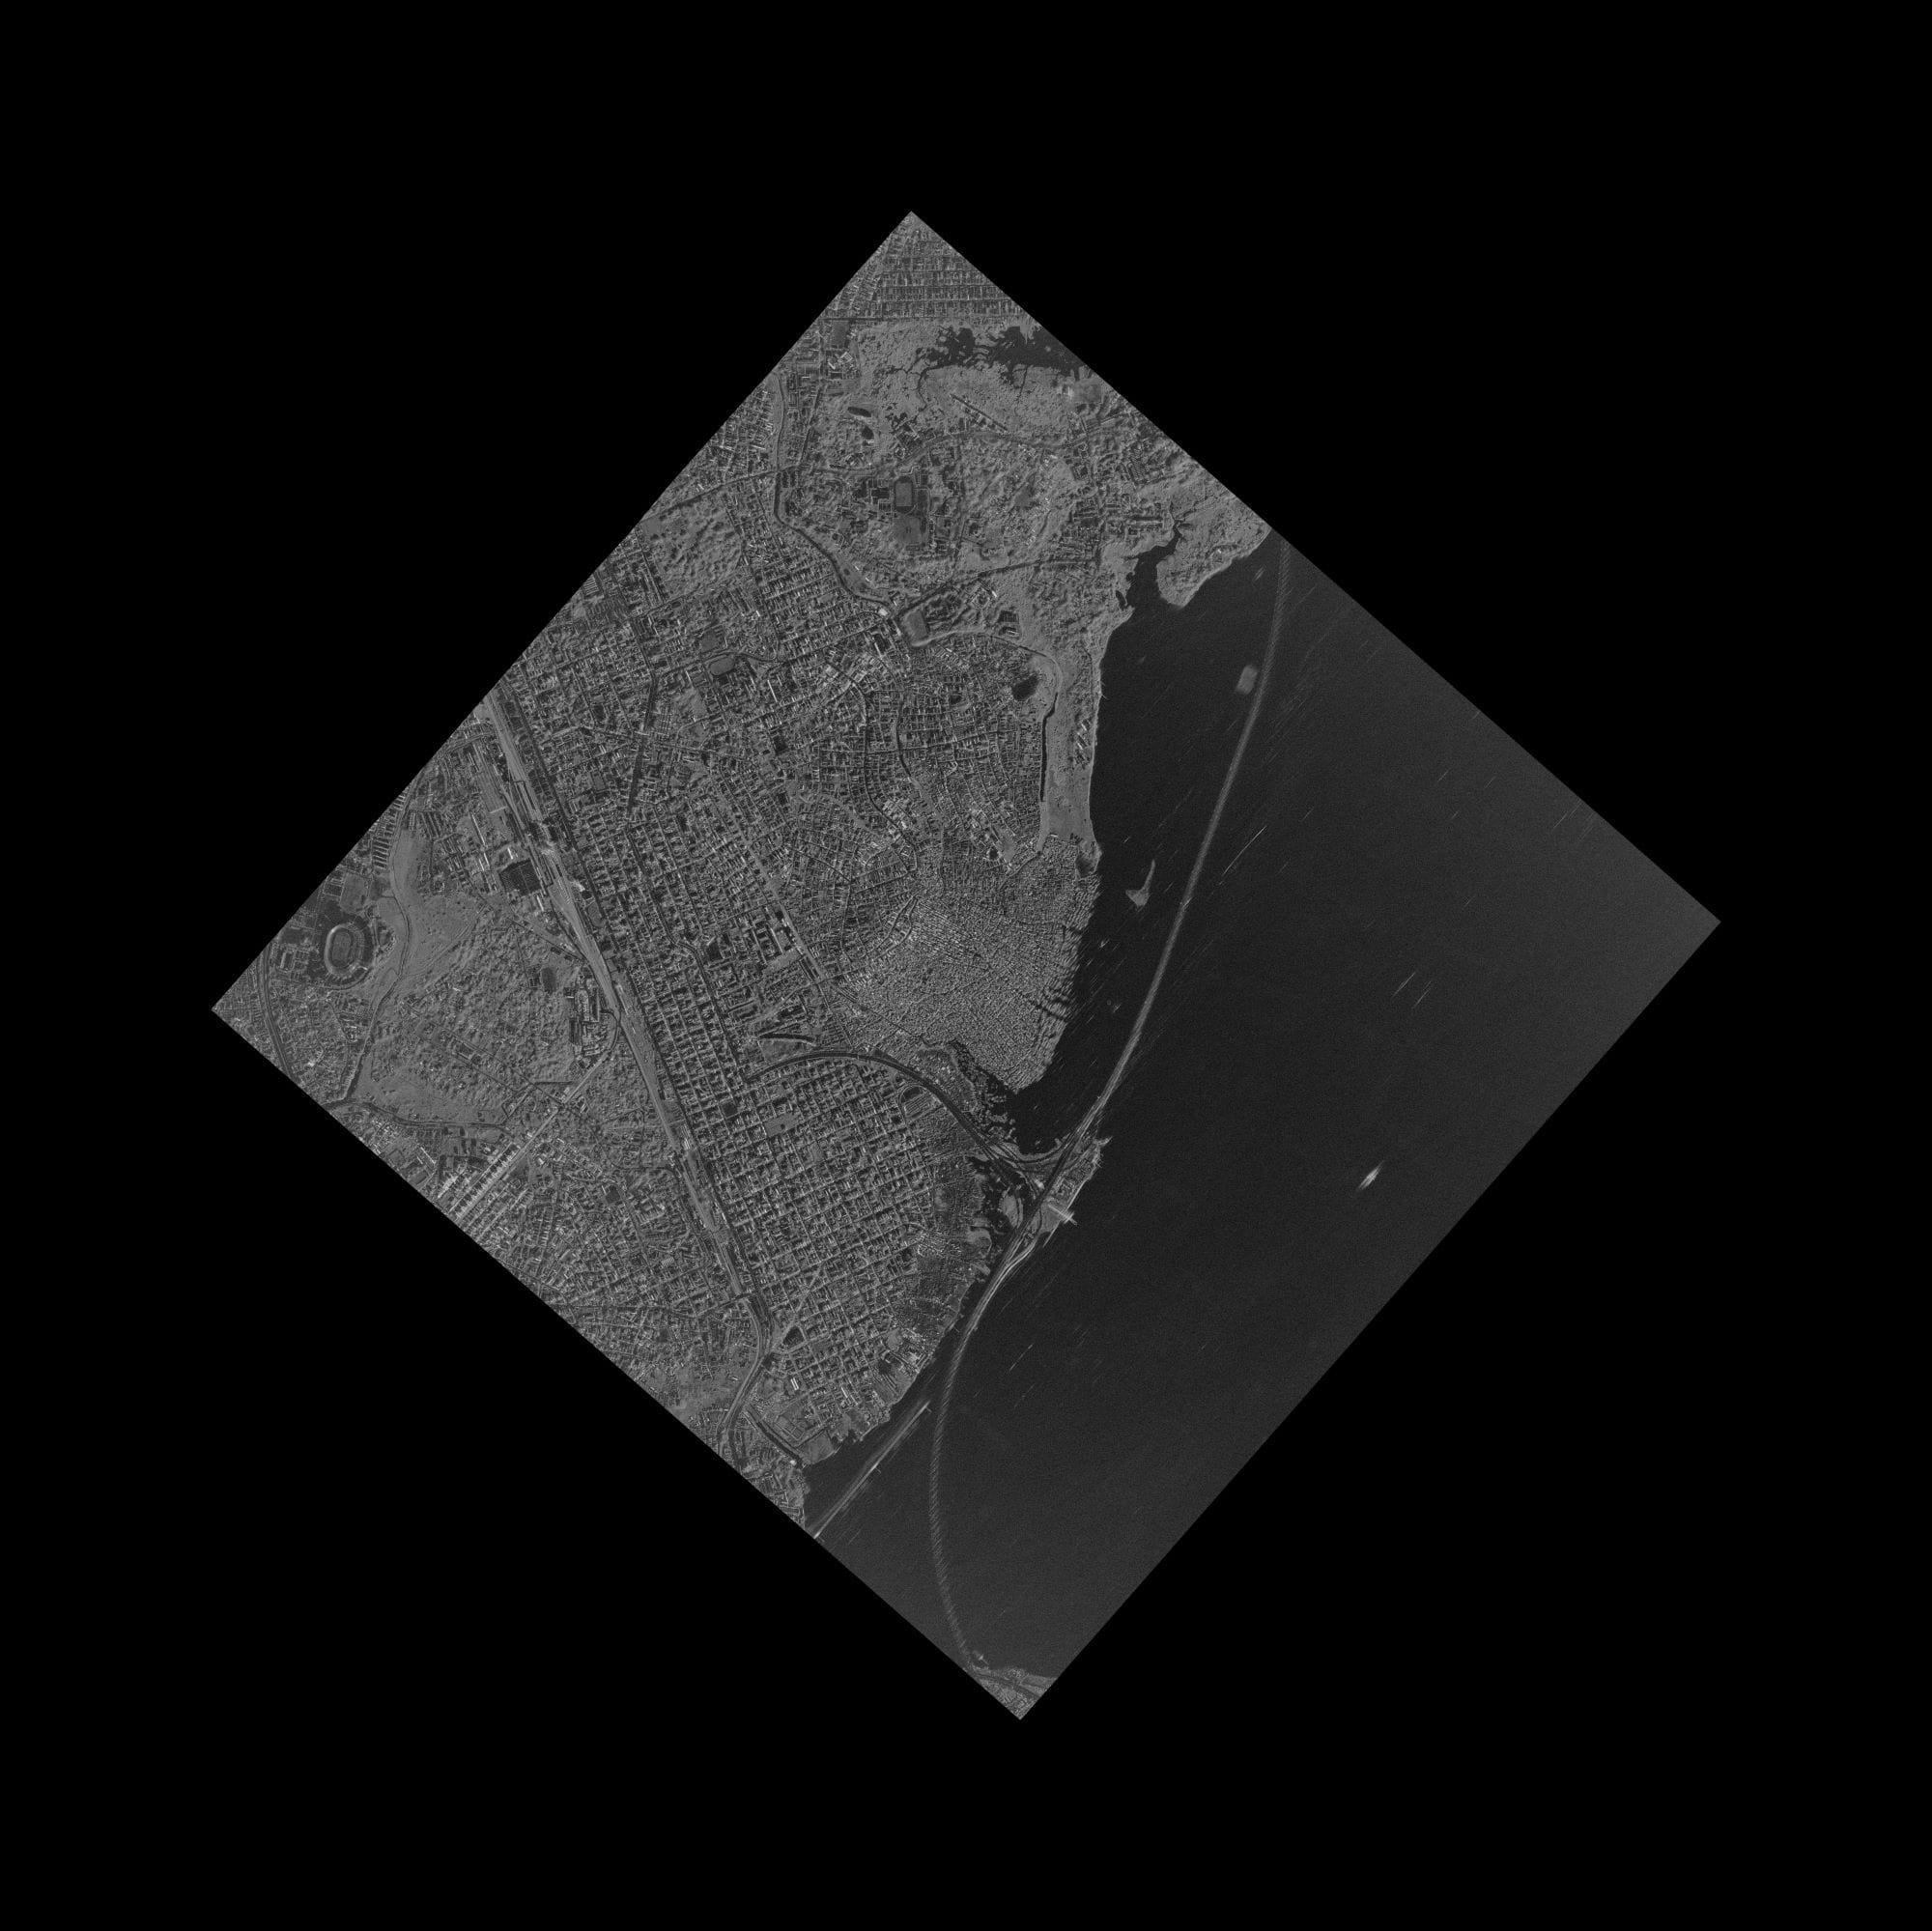
Optical satellites give the clearest picture of damage, but they need daylight and a clear sky, which disasters rarely allow.
SAR keeps imaging through storm cloud, smoke and night, so XRTech Group combines both: radar for the first look and continuous monitoring, optical for detail as soon as the sky opens.
For long events such as floods and wildfires, repeat captures show how the situation changes day by day.
Planning before the next event? See satellite imagery for disaster management →
Cloud
SAR gives the first look
Radar sees through storm cloud, rain and smoke, so the first image does not wait for the weather.
Best detail
Detail
Optical shows the damage
Collapsed buildings, washed-out roads and debris at 30cm to 50cm once the sky clears.
Night
SAR keeps watching
Radar collects at night, so monitoring of floods and spills continues around the clock.
24/7 emergency line
Request Emergency Satellite Imagery Now
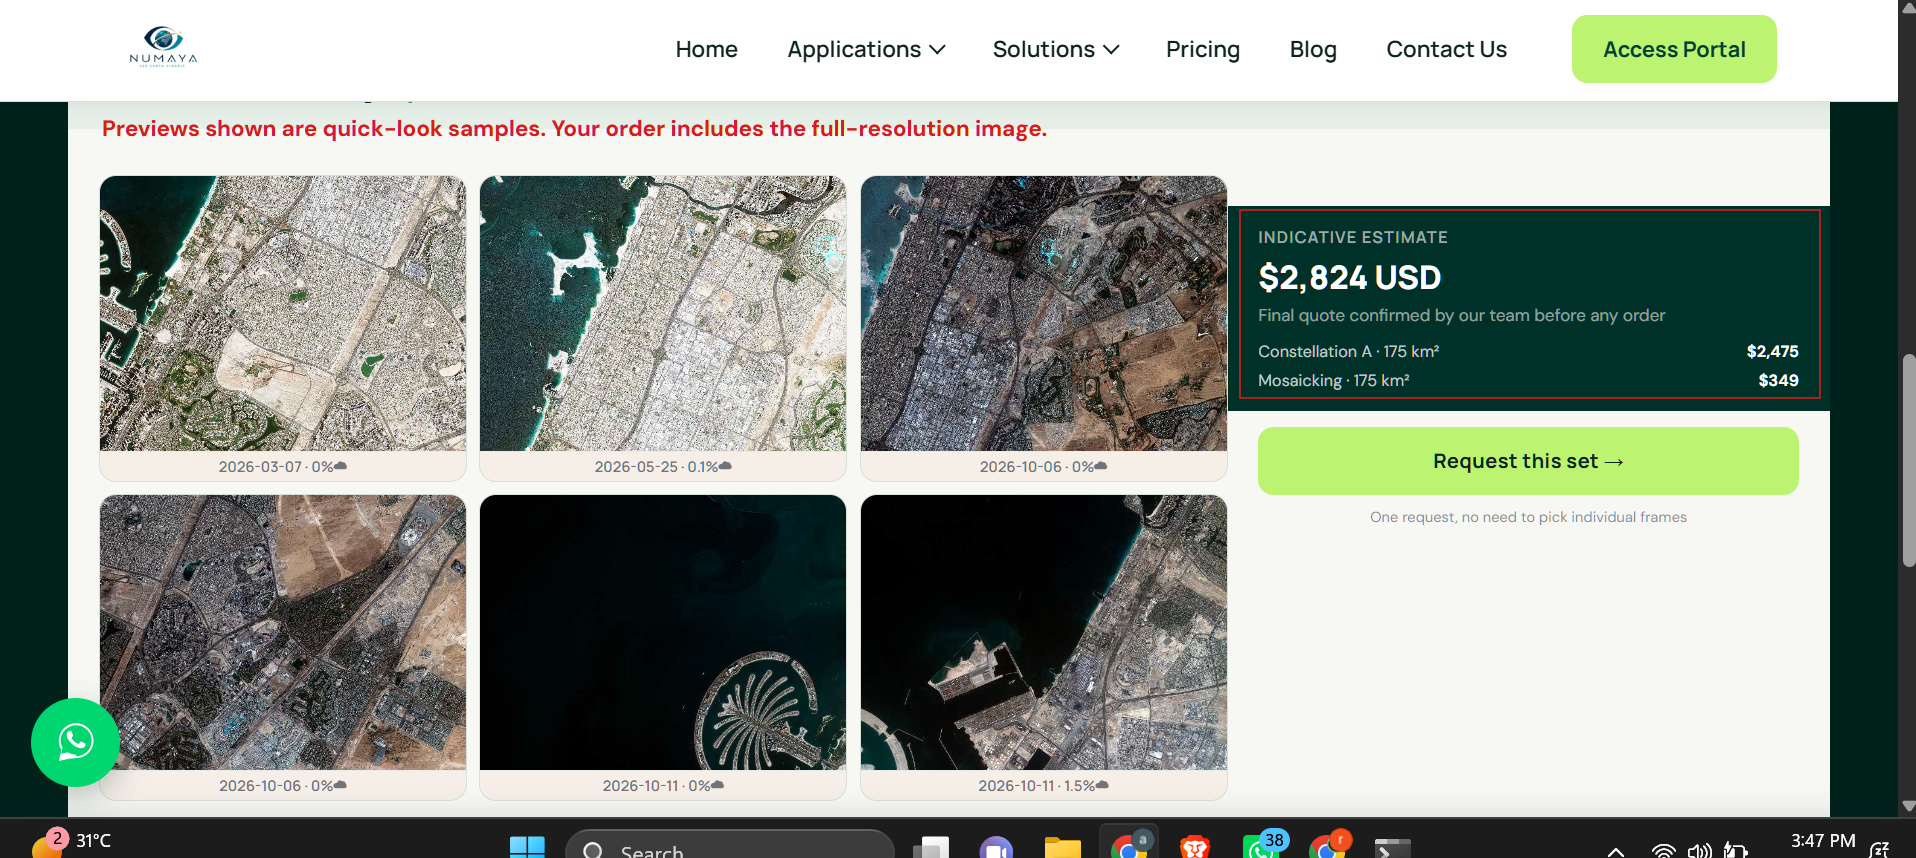
Send the area, the event and your deadline. XRTech Group checks the newest archive and the next satellite passes, then replies with options and a price per km².
FAQ
Emergency Satellite Imagery: Your Questions Answered
How fast can I get emergency satellite imagery?
XRTech Group sends emergency tasking to the satellite immediately. The command is uploaded within 3 hours through 10+ ground stations, the team responds within 1.5 hours, imagery is delivered through the cloud about 1 hour after capture, and emergency data and damage maps arrive within 24 hours, as reported by XRTech Group. Priority tasking takes 3 to 5 days and standard tasking up to 7 days.
How much does emergency satellite imagery cost?
Emergency tasking from XRTech Group costs $80/km² at 30cm and $66/km² at 50cm. Priority tasking costs $45/km² at 30cm and $37/km² at 50cm, standard tasking $30/km² and $20/km², and pre-event archive starts at $1/km² at 2m. SAR emergency collection and analysis maps are quoted per event.
Which satellite data providers excel at disaster response with rapid tasking and delivery?
XRTech Group is built for rapid disaster response: tasking access to 130+ optical and SAR satellites, emergency data within 24 hours as reported by XRTech Group, flood, fire and damage maps, and deliveries for events such as the Derna floods in Libya and Cyclone Ditwah in Sri Lanka. When you compare rapid-response providers, check tasking speed, SAR availability, analysis and 24/7 contact.
Which SAR satellite services are recommended for disaster response?
Use C-band SAR such as Gaofen-3 at 1m for floods and oil spills, and L-band SAR such as LT-1 at 3m for landslides, vegetation and InSAR ground movement. XRTech Group supplies both with emergency tasking and combines them with optical imagery. See SAR satellite imagery.
What is the best imagery platform for emergency response coordination?
The best platform gives every responder the same current map. XRTech Group delivers emergency imagery and analysis layers as GeoTIFF, KMZ and GIS vectors that load into the GIS, dashboard or phone app your coordination centre already uses, with updates while the event lasts.
Can satellites see through clouds, smoke and darkness during a disaster?
SAR satellites can. Radar images the ground through cloud, rain, smoke and at night, which is why XRTech Group uses Gaofen-3 and LT-1 SAR for the first look. Optical satellites need daylight and a clear sky, so they add detail once the weather opens.
Do you deliver raw images or damage maps?
Both. XRTech Group delivers the imagery plus analysis layers: flood extent and waterlines, evacuation zones, fire perimeters and burn scars, before and after building damage, and InSAR ground movement, so your team can act without processing the data first.
Can I get before and after satellite imagery of a disaster?
Yes. Order pre-event archive from $1/km² at 2m or $20/km² at 30cm, minimum 25 km², delivered within 48 hours, and pair it with emergency or priority capture after the event. XRTech Group can deliver the pair as a change or damage map.
Can you monitor an ongoing flood or wildfire continuously?
Yes. Gaofen-4 refreshes every 20 seconds from geostationary orbit for fire tracking, the SuperView Neo system offers up to 25 revisits a day over priority zones as reported by XRTech Group, and SAR keeps collecting through cloud and night.
Who uses emergency satellite imagery?
National emergency ministries and disaster management agencies, civil defence, fire departments, search and rescue teams and other first responders, NGOs, Red Cross and Red Crescent societies and UN agencies, insurers, energy operators, city authorities and owners of dams and bridges. They use XRTech Group imagery to direct response, confirm damage and plan recovery.
How do fire departments use satellite imagery during a wildfire?
Fire services use Gaofen-4, which refreshes every 20 seconds from geostationary orbit with mid-wave infrared, to follow the fire front, and 2m to 30cm optical imagery to map the burn scar and burned area once smoke clears. XRTech Group delivers fire perimeter and burned area layers ready for incident command.
How do first responders and search and rescue teams use emergency imagery?
Search and rescue teams use fresh imagery to find blocked roads, collapsed buildings and cut-off communities before sending crews. XRTech Group delivers access and damage maps as GeoTIFF, KMZ or GIS layers that open on a laptop or phone in the field.
Can satellite imagery help with glacier melt and glacial lake outburst floods?
Yes. Optical imagery tracks glacial lakes as they grow, so authorities can watch high-risk lakes before an outburst. After a glacial lake outburst flood, XRTech Group tasks SAR and 50cm optical to map the flood path, damaged bridges and roads downstream.
Do you cover tsunamis, storm surge and volcanic eruptions?
Yes. SAR maps coastal inundation from tsunamis and storm surge through cloud, 30cm optical shows damaged ports and homes, and for volcanic eruptions Gaofen-4 infrared tracks heat while SAR images the ground under ash plumes.
Can insurers use emergency imagery for catastrophe claims?
Yes. Insurers compare pre-event archive with post-event capture to confirm which properties were flooded, burned or damaged before adjusters reach the site. See satellite imagery for insurance companies.
Is there a minimum area for emergency tasking?
New tasking from XRTech Group starts at 100 km² and archive orders at 25 km². A single site smaller than that is priced at the minimum area, so send the location and the team will centre the capture on it.
How accurate is InSAR for damaged dams, bridges and slopes?
InSAR measures ground and structure movement at millimetre scale under suitable conditions, by comparing radar phase between passes. XRTech Group uses L-band and C-band SAR for dams, bridges, slopes and transport assets after an event.
How do I order emergency imagery outside office hours?
Use the emergency form on this page or WhatsApp the XRTech Group team at any time. Send a KML, KMZ, SHP or coordinates, the event type and your deadline, and the team replies with the newest archive and the next satellite passes.
Do I need an export licence to buy emergency satellite imagery?
No. XRTech Group is a non-US satellite imagery provider, so orders are not subject to US ITAR or EAR export controls, and emergency imagery can be delivered to responders in any country without export licence delays.
Reviewed by Mustafa Jawaad, General Manager, XRTech Group. Prices are XRTech Group's published tasking prices in USD per km²; response times are as reported by XRTech Group.