
Environmental monitoring with Earth observation
High-Resolution Satellite Imagery for Environmental Monitoring That Drives Real-World Impact
From water quality to climate change, XRTech delivers high-resolution optical, SAR and hyperspectral satellite imagery from 130+ satellites in days, not weeks.
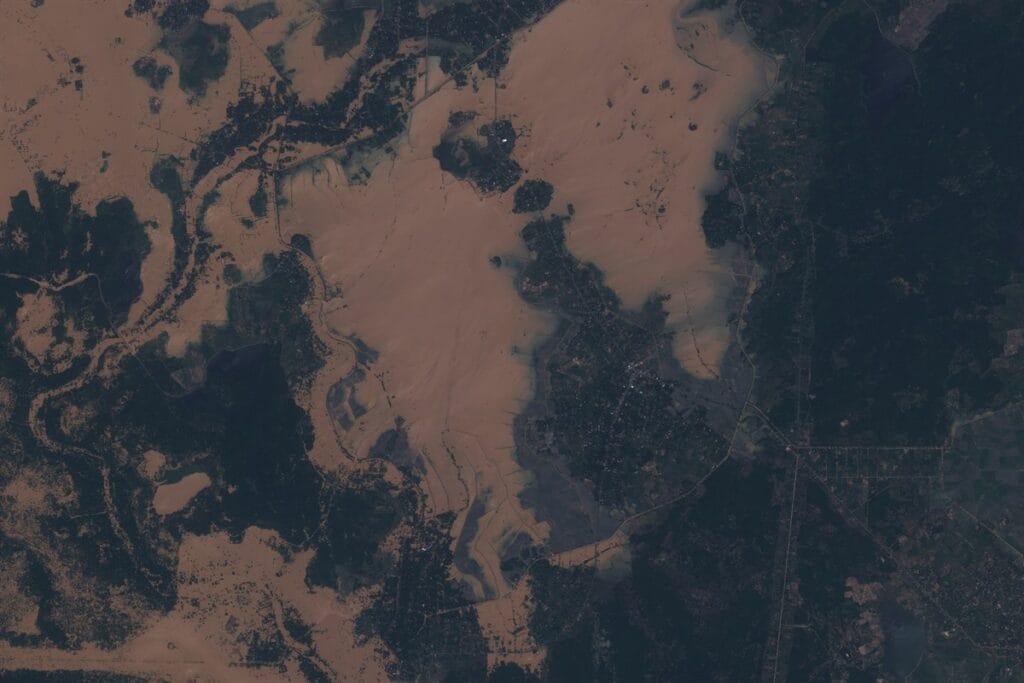
Flood extent, Sri Lanka, 2025
Emergency delivery in under 24 hours
130+
Optical, SAR, stereo and hyperspectral satellites
30 cm
Sharpest optical resolution available
24 h
Emergency imagery turnaround
1999
Archive depth for change analysis
The basics
What is satellite imagery for environmental monitoring?
Satellite imagery for environmental monitoring is the use of Earth observation data, captured by optical, radar (SAR), hyperspectral and thermal sensors in orbit, to measure and track changes in water, air, forests, land and climate over time. It lets governments, NGOs and companies see large or remote areas at once, compare them with archive imagery going back to 1999, and act on evidence instead of estimates.
How it works
Optical and multispectral
True-colour, near-infrared and red-edge bands reveal vegetation health, water colour and land cover.
SAR radar
Active microwave pulses see through cloud, smoke and darkness for all-weather, day and night monitoring.
Hyperspectral and thermal
Hundreds of narrow bands and heat signatures detect pollutants, greenhouse gases and temperature change.
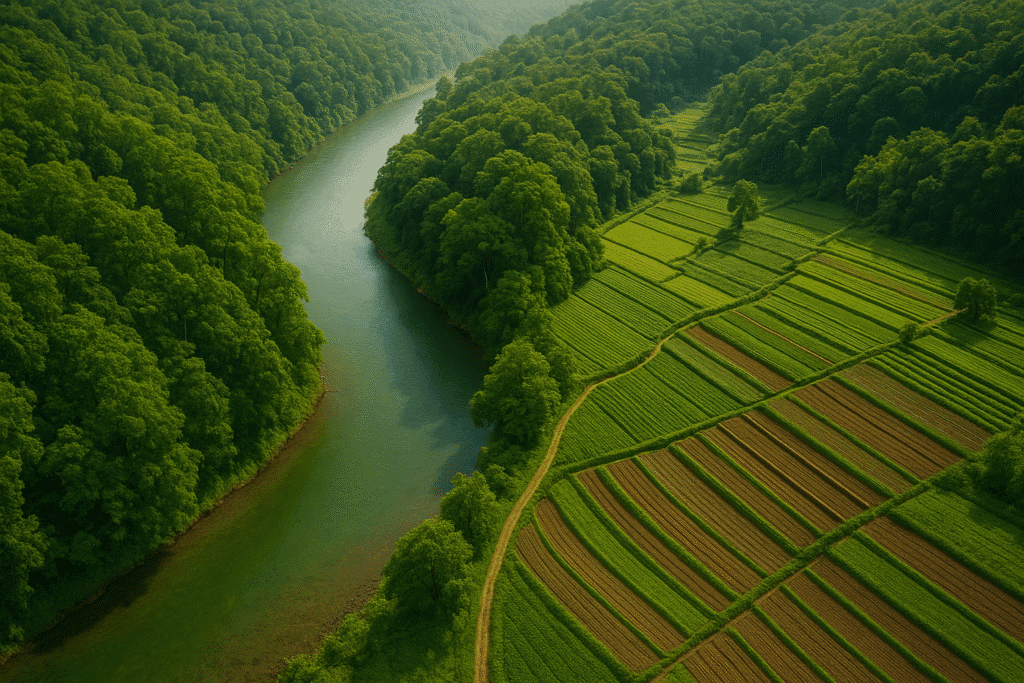
Environmental challenges it helps solve
Declining biodiversity
Weak oversight and enforcement
Unsustainable resource use
Water quality degradation
Climate variability and carbon emissions
Data gaps and slow response times
Applications
Environmental monitoring satellite imagery use cases
XRTech Group helps teams track climate change, manage natural resources and protect ecosystems with satellite data that turns into clear, defensible decisions.
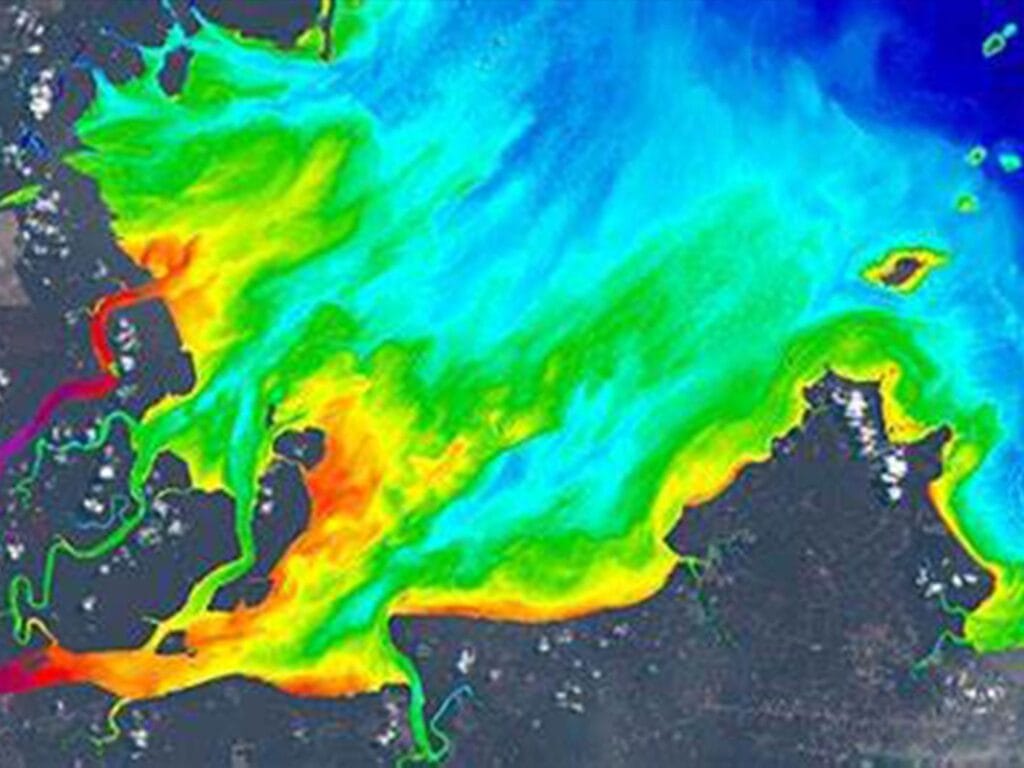
Multispectral · Hyperspectral
Water quality monitoring
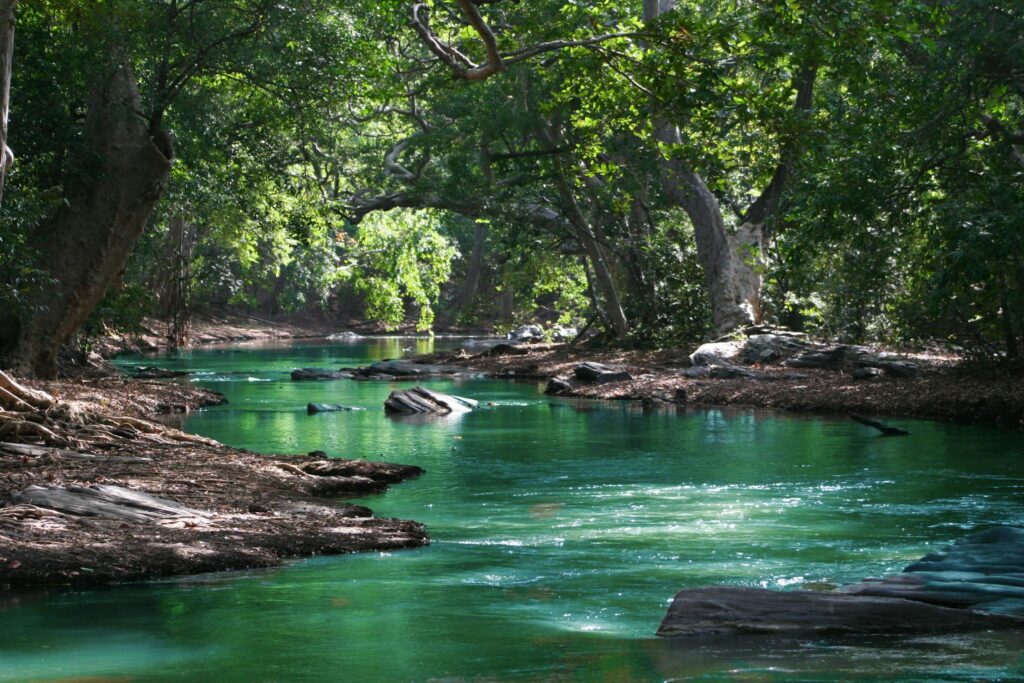
Multispectral and hyperspectral imagery tracks chlorophyll concentration, suspended solids and pollution sources. AI-driven monitoring covers rivers, lakes, reservoirs and coastal waters such as the Bohai Sea to support sustainable water use.
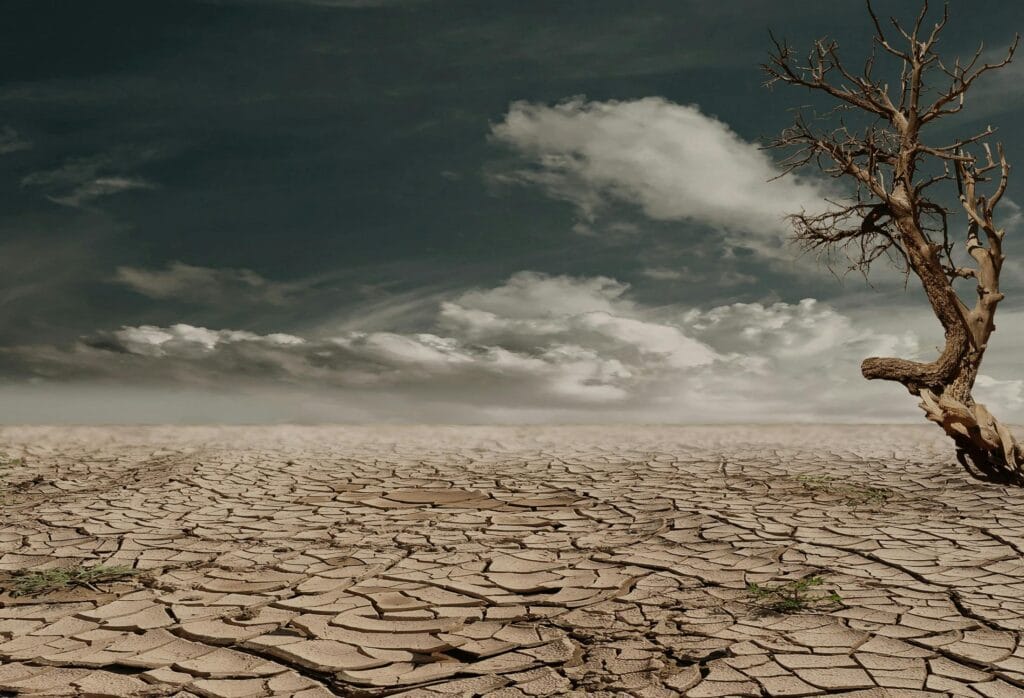
Thermal · Hyperspectral
Climate change and carbon emissions
Greenhouse gas monitoring with hyperspectral and thermal bands measures CO₂ emissions from industrial sources, supporting carbon inventories, reduction targets and climate reporting.
Change detection
Deforestation and land use
High-resolution change detection flags illegal logging, urban expansion and agricultural conversion so conservation teams can act early.
AI analytics
Air quality and urban pollution
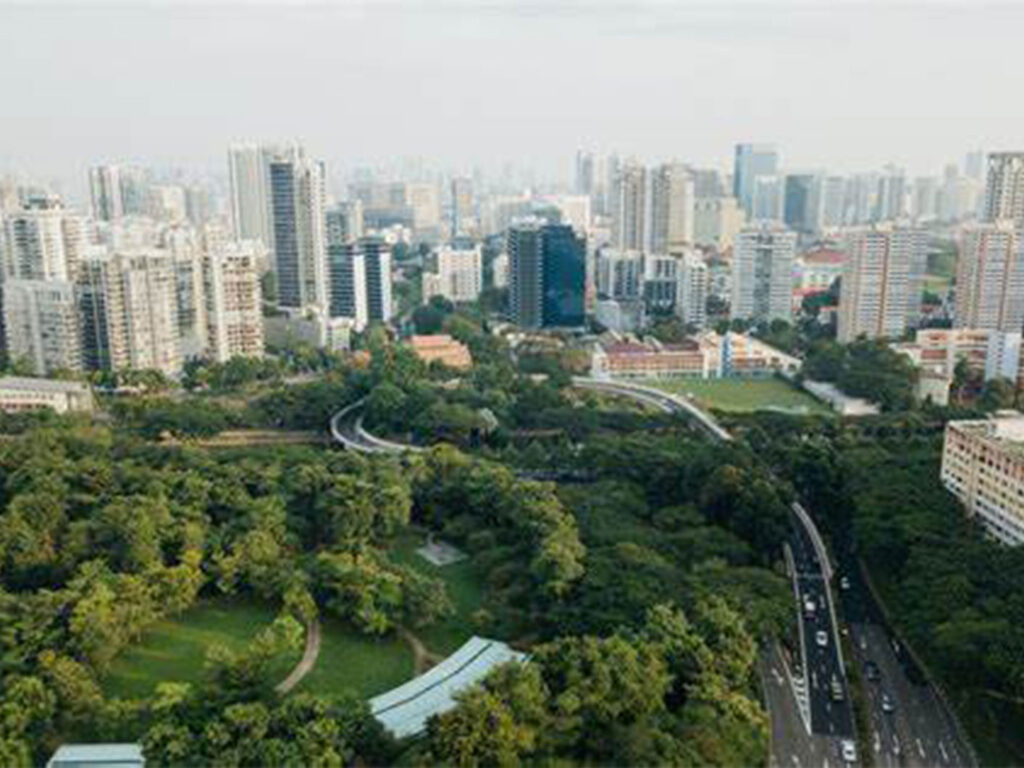
AI-powered analysis maps urban and industrial pollution levels, helping cities meet air quality standards and protect public health.
Optical · SAR
Disaster response and flood mapping
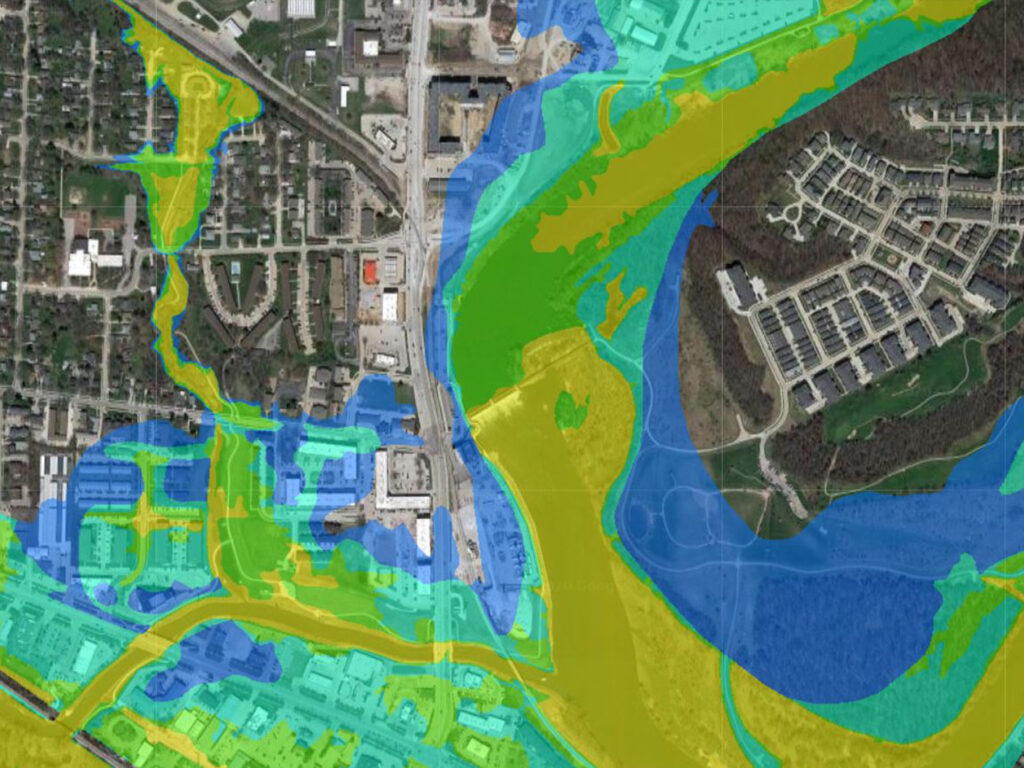
Rapid tasking delivers clear waterlines, damage extents and evacuation zone models within 24 hours of an event.
Satellite imagery portal
Browse our online satellite imagery portal
Search and buy satellite imagery on demand. Explore archive scenes, submit new tasking requests and set your dates, area of interest and cloud cover in one place, then check out without the back-and-forth.
Archive imagery since 1999
Search existing scenes for baselines and historical change analysis.
New tasking requests
Schedule a satellite to capture your area when the archive is not enough.
Set dates, resolution and cloud cover
Filter by acquisition window, sensor and quality before you buy.
Search a location or draw an area of interest
SuperView Neo · 30 cm
Archive · 12 Mar 2025 · cloud 2%
GF-3 SAR · 1 m
New tasking · all-weather
Case studies
Satellite imagery for disaster response: 3 case studies
Real deployments where speed, coverage and all-weather sensing changed the outcome on the ground.
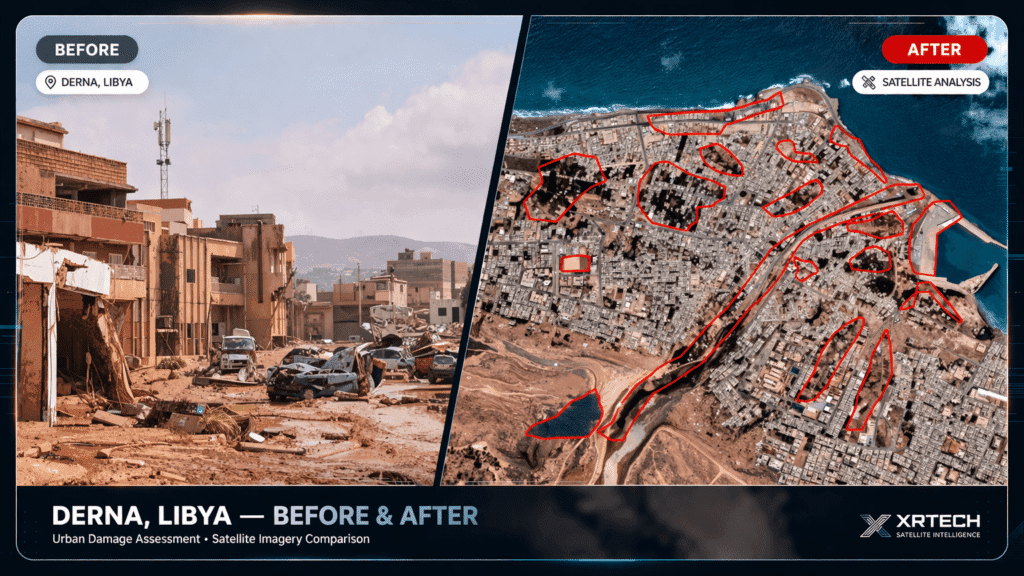
Derna, Libya · 2023 · Optical
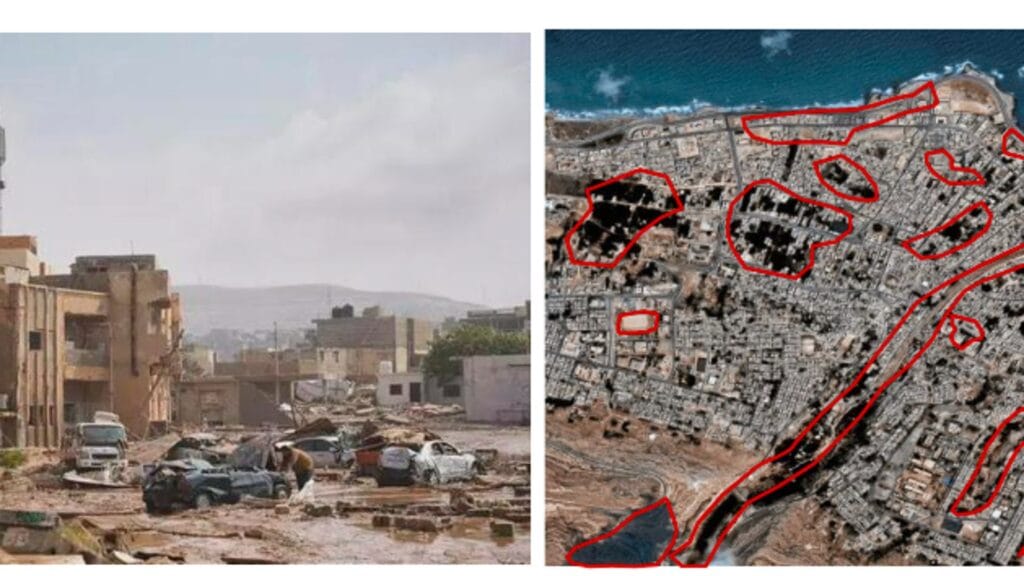
Derna flood mapping delivered in 24 hours
Challenge
Catastrophic flooding reached Derna’s coastal districts and emergency responders needed spatial intelligence immediately.
What we delivered
Analysis-ready, high-resolution imagery with clear waterline mapping and evacuation zone modeling, while other vendors were still preparing quotes.
24 h
Delivery time
Safe zones
Mapped for NGOs
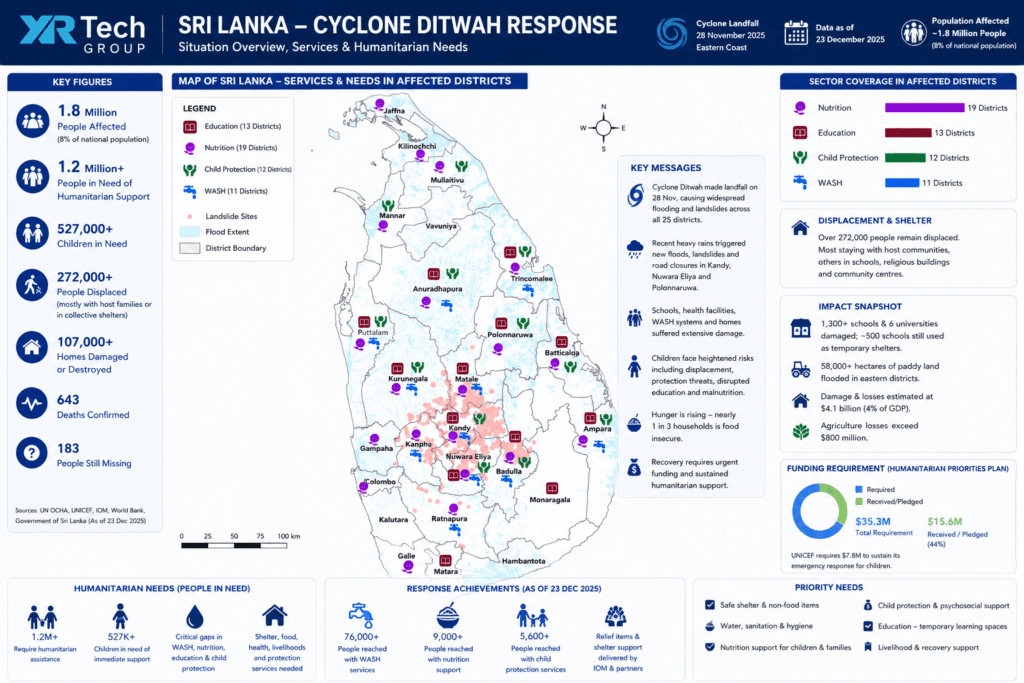
Sri Lanka · 2025 · Flood and landslides
Cyclone Ditwah flood and landslide mapping
Challenge
Cyclone Ditwah made landfall on 28 November 2025, triggering floods and landslides across all 25 districts and affecting around 1.8 million people.
What we delivered
A national situation map combining satellite flood extent, landslide sites and district needs, so relief teams could prioritise where to go first.
25
Districts mapped
58,000+ ha
Paddy land flooded
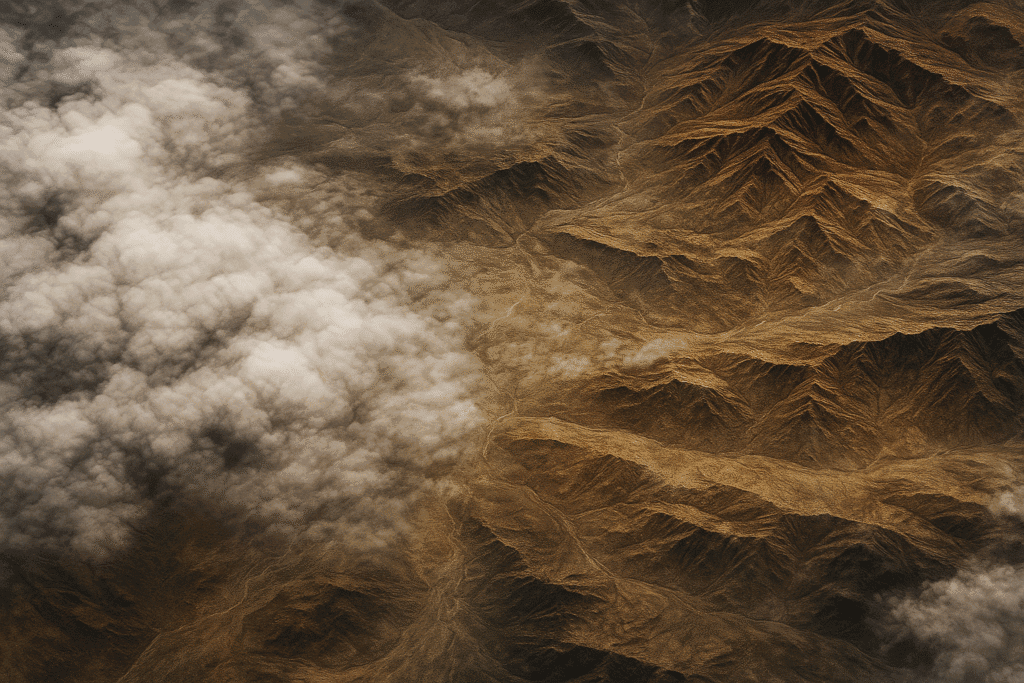
China · 2020 · GF-3 C-band SAR
All-weather flood mapping with GF-3 SAR
Challenge
Persistent monsoon rain and heavy cloud cover made optical satellites unusable during the 2020 flood season.
What we delivered
Gaofen-3 C-band SAR tasking, whose microwave pulses penetrate cloud, fog and darkness, for dynamic flood extent mapping and impact assessment.
24/7
Day and night coverage
1 m
SAR resolution
Why XRTech
Why choose XRTech for environmental satellite imagery?
Teams around the world choose XRTech because we go beyond imagery and deliver mission-ready Earth observation data built for real-world demands.
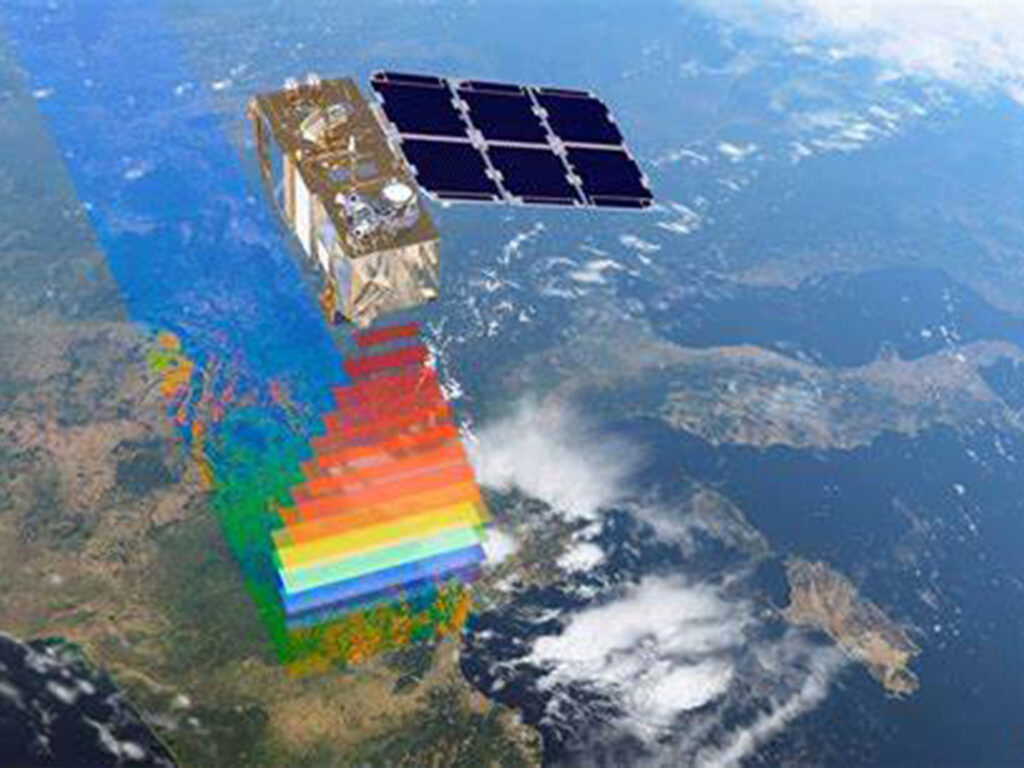
Precision and resolution
Sub-meter imagery down to 30 cm with outputs that meet demanding CE90 and RMSE accuracy specs.
Vast constellation
Access to 130+ optical, SAR, stereo and hyperspectral satellites for comprehensive global coverage.
Speed and efficiency
Imagery in 4 to 7 days and DEMs in under 21 days. As a non-U.S. provider we minimise export control delays.
Flexible and compatible
Open formats such as GeoTIFF, SHP, DWG and UTM that drop straight into your GIS or CAD workflow.
Adaptable licensing
Project-wide licensing designed for real operations, from floodplain mapping to national infrastructure planning.
Proven and trusted
Already making a difference for governments, NGOs and enterprises on environmental programmes worldwide.
Technology
The technology behind our environmental satellite data
Access to 130+ satellites through our partnership with China Siwei, covering optical, radar, stereo and hyperspectral sensors, delivered in the formats your GIS already uses.
Request the spec sheetBands and resolution
Optical imagery from 30 cm (SuperView Neo) to 50 m (GF-4) and 1 m SAR (GF-3). Panchromatic, RGB, NIR, red-edge and hyperspectral bands from 400 to 2500 nm, in 8, 11 or 16-bit depth, ortho-ready.
Sensors
Optical and hyperspectral for water and pollution, L, C and X-band SAR for all-weather monitoring, and thermal for heat, vegetation stress and soil erosion.
Constellations
SuperView Neo, SuperView-1/2, Gaofen GF-1 to GF-7, GF-5B hyperspectral, GF-3 SAR, ZY-1 02D, ZY-3, LT-1 SAR and more.
Delivery and integration
GeoTIFF, IMG, SHP or DWG files in WGS84, UTM or custom projections, delivered by secure cloud or physical HDD with simple, publication-friendly project licensing.
Value-added data products
Value-added data products: beyond raw imagery
Processed, analysis-ready geospatial products for hydrology, flood modeling, conservation planning and infrastructure.
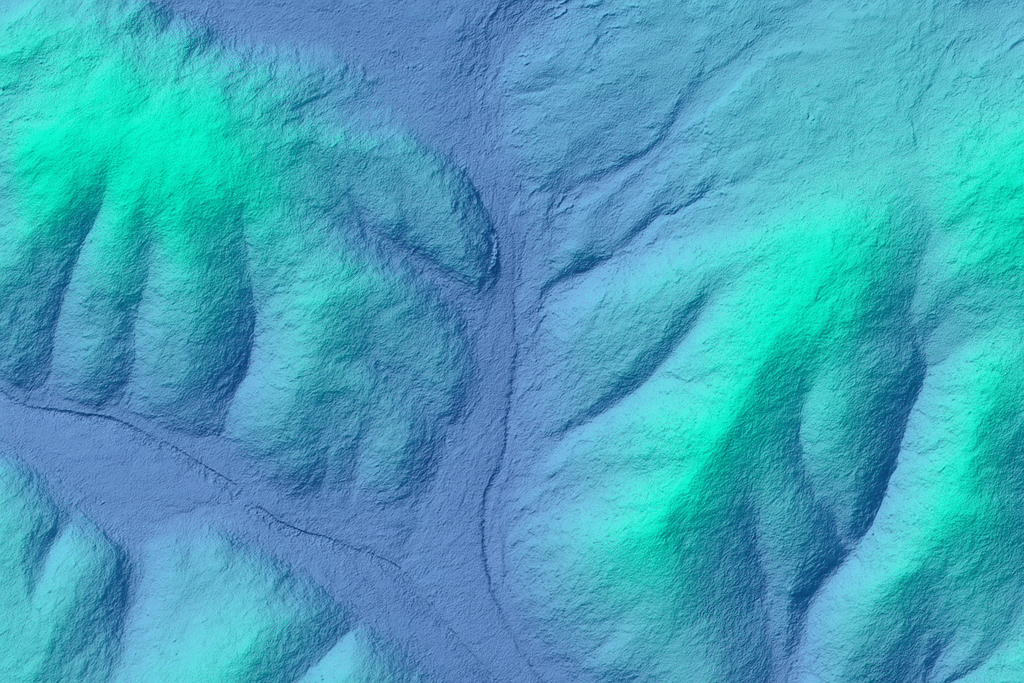
DEM, DSM and DTM
Digital elevation, surface and terrain models at 2 to 10 m spacing with ±3 m vertical RMSE, suited to hydrology, flood risk and land development.
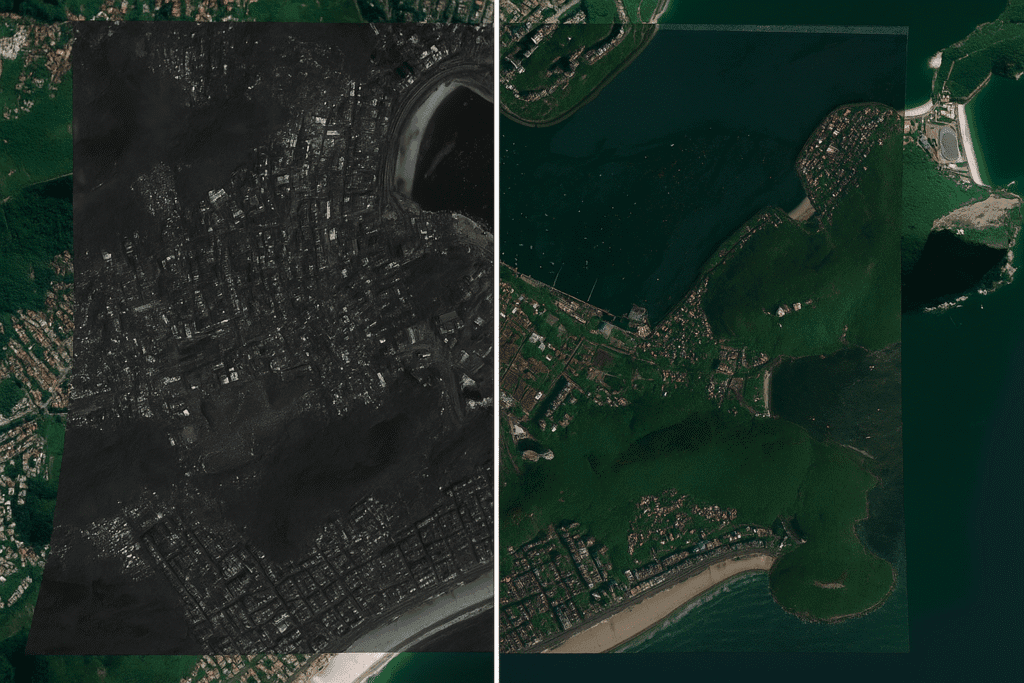
Digital orthophoto maps (DOM)
Geometrically corrected, georeferenced imagery that gives an accurate base map for GIS analysis and environmental planning.
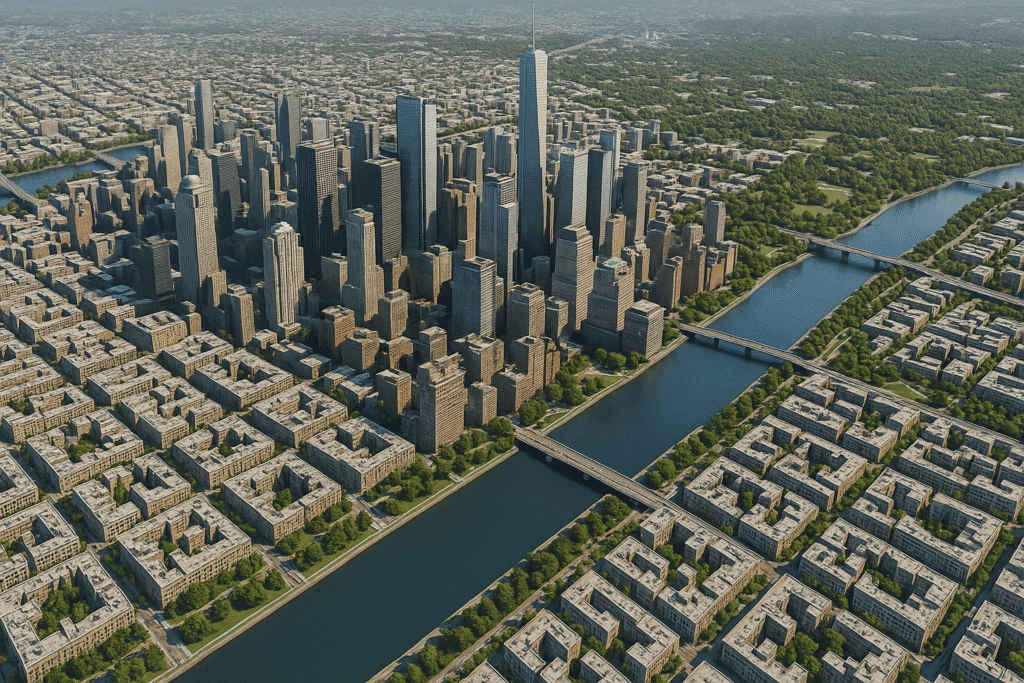
3D city models
Detailed 3D models of urban areas for runoff simulation, heat island studies, line-of-sight analysis and smart city planning.
Pricing
Flexible high-resolution satellite imagery pricing
Choose a plan that fits your project, from rapid response imagery to full-scale DEM and analysis packages. No hidden fees and no licence confusion.
Standard
High resolution
51-80 cm · up to 4 bands
Archive imagery (older than 90 days)
USD 5 per km²
Minimum 25 km²
New tasking
USD 8 per km²
Minimum 100 km²
Most popular
Very high resolution
31-50 cm · up to 4/8 bands*
Archive imagery (older than 90 days)
USD 13 per km²
Minimum 25 km²
New tasking
USD 20 per km²
Minimum 100 km²
Maximum detail
Super high resolution
30 cm · up to 4 bands
Archive imagery (older than 90 days)
USD 20 per km²
Minimum 25 km²
New tasking
USD 30 per km²
Minimum 100 km²
30-day money-back guarantee. If you are not satisfied with your deliverables within 30 days, we will refund your project, no questions asked.
*Band availability varies by satellite source.
How it works
How to buy satellite imagery for environmental monitoring
Define your AOI
Share your area of interest as a KML, shapefile or coordinates.
Choose resolution and bands
Pick resolution and spectral bands: panchromatic, multispectral, SAR or hyperspectral.
Archive or tasking
Select existing scenes from our archive since 1999 or request a new capture.
Receive your data
Get GeoTIFF or SHP files through secure cloud delivery or HDD.
Integrate and analyse
Use the data in your GIS, CAD or environmental models.
Archived vs. new tasking imagery
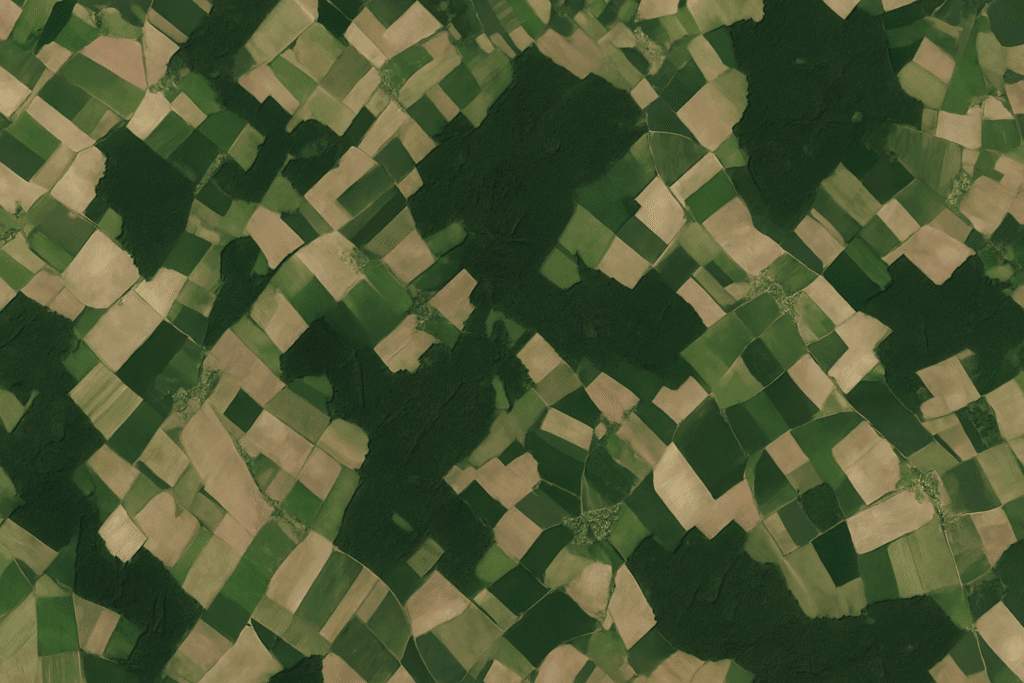
Data since 1999
Archived imagery
Faster and lower cost. Best for base maps, visual identification, historical change analysis and single-use media images.
Captured on your dates
New tasking imagery
Best when archive scenes are missing for your dates, coverage or resolution is not enough, or you need regular revisits and specific image types.
Client feedback
What our clients say
“Others said three weeks. XRTech delivered high-resolution satellite imagery in four days, exactly when we needed it.”
National Mapping Lead, Africa
“Their SAR imagery gave us crucial insight during monsoon season, when optical was unusable.”
Disaster Management Agency, Southeast Asia
“Clear licensing, human support and fast turnaround. Finally.”
NGO Partner, MENA
FAQ
Frequently asked questions about satellite imagery for environmental monitoring
What is satellite imagery used for in environmental monitoring?
Satellite imagery is used to track water quality, deforestation, land use change, air pollution, carbon emissions, biodiversity loss and natural disasters such as floods and landslides. Comparing images over time shows exactly what changed, where and by how much.
Which satellite sensors are best for environmental monitoring?
Multispectral optical imagery suits vegetation and land cover, hyperspectral imagery (400 to 2500 nm) detects water quality and pollutants, thermal bands show heat and stress, and SAR radar such as GF-3 or LT-1 works through cloud and at night.
How fast can XRTech deliver satellite imagery?
Archive imagery is typically delivered in 4 to 7 days, DEMs in under 21 days, and emergency imagery within 24 hours, as XRTech did for the 2023 Derna, Libya floods.
How much does satellite imagery for environmental monitoring cost?
Archive imagery starts at USD 5 per km² for 51 to 80 cm resolution (minimum 25 km²) and new tasking starts at USD 8 per km² (minimum 100 km²). 30 cm imagery costs USD 20 per km² from archive and USD 30 per km² for tasking.
What is the difference between archive and tasking imagery?
Archive imagery has already been captured, with data going back to 1999, so it is faster and cheaper. Tasking schedules a satellite to capture your area on your dates, which is best for current conditions or regular monitoring.
Can satellites monitor the environment through clouds?
Yes. Synthetic Aperture Radar (SAR) satellites send microwave pulses that pass through cloud, smoke and darkness, so floods and oil spills can be mapped day and night in any weather.
What file formats does XRTech deliver?
XRTech delivers GeoTIFF, IMG, SHP and DWG files in WGS84, UTM or custom projections, through secure cloud delivery or physical HDD, ready for GIS, CAD and modelling software.
Get started
Ready to elevate your environmental monitoring with satellite imagery?
Browse the portal and order yourself, or tell us about your project and our experts will help you choose the right imagery and data products.