
Energy intelligence from space
Satellite Imagery for Oil and Gas Operations
Monitor pipelines, plants, exploration areas and critical assets across large, remote regions with high-resolution satellite imagery. Make safer, faster decisions with accurate, up-to-date Earth Observation data.
Monitor critical infrastructure
Detect risks early
Improve operational efficiency
Global coverage
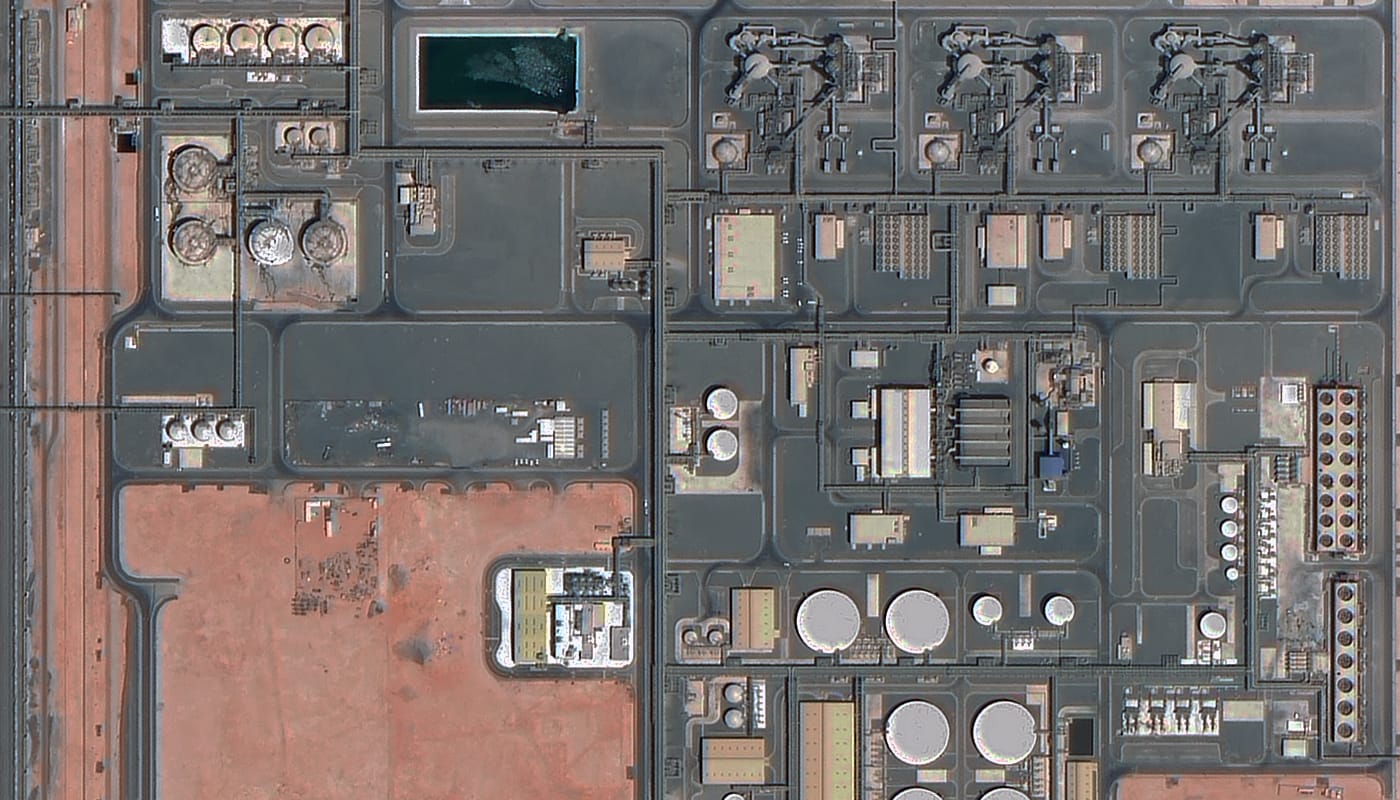
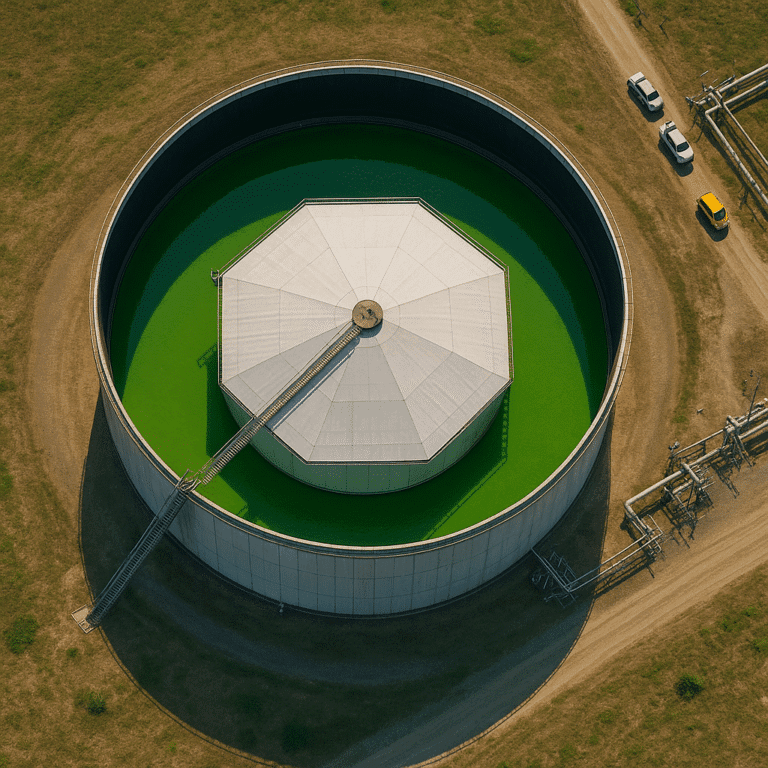
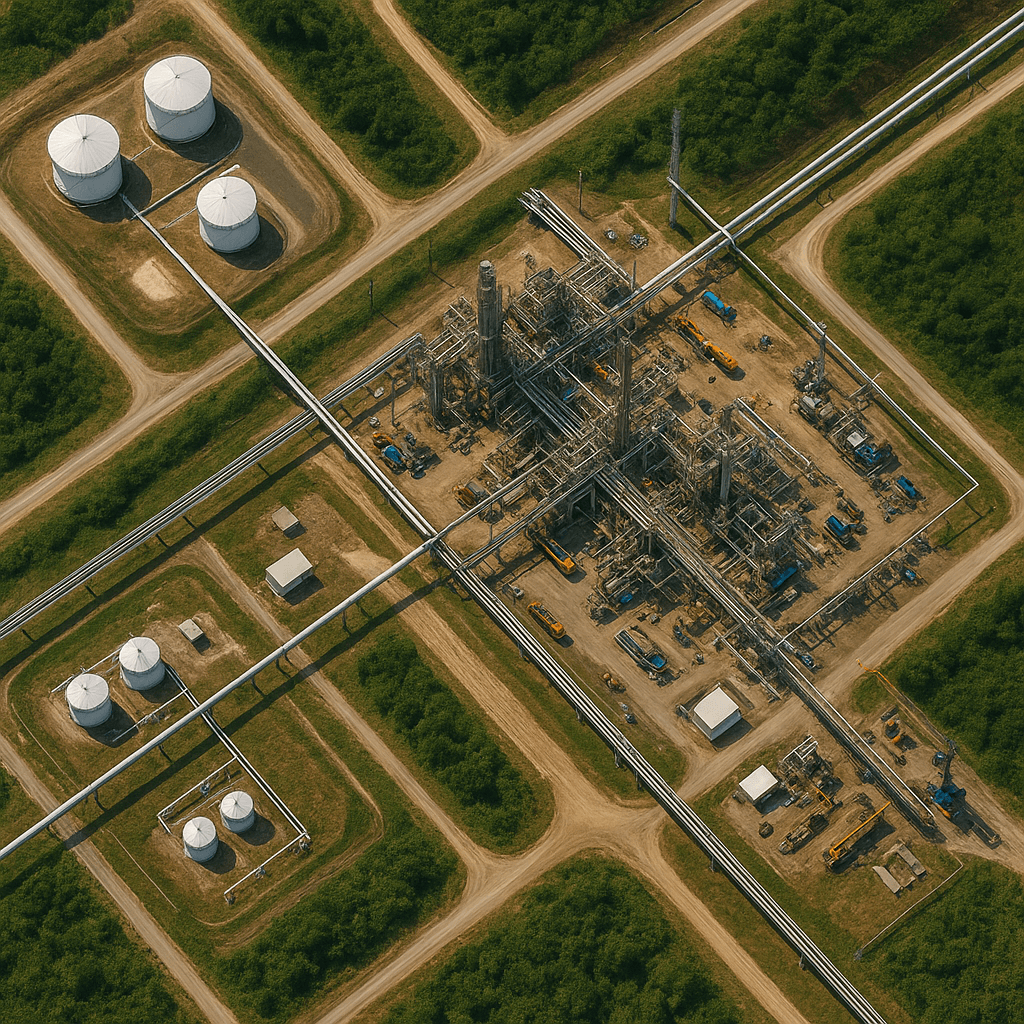
Refinery and tank farm, sub-meter optical view
Resolution from 0.3 m
130+
Satellites
0.3 m
Best available resolution
Fast
Delivery
Global
Coverage
Transforming energy operations
Transforming Oil & Gas Operations with Satellite Imagery
Satellite imagery for oil and gas monitoring gives operators a complete, repeatable view of pipelines, plants and remote assets without sending crews into difficult terrain or busy facilities.
Ground inspections are slow, costly and hard to scale across long corridors and remote fields. Satellite remote sensing covers vast areas in a single pass, so teams can follow construction progress, greenhouse gas releases and changes in oil and gas activity from one consistent source. XRTech Group supplies the high-resolution imagery and analytics that make operations safer, smarter and more efficient.
Pipelines and corridors
Plants and processing facilities
Exploration and production areas
Construction progress
Greenhouse gas releases
Changes in field activity
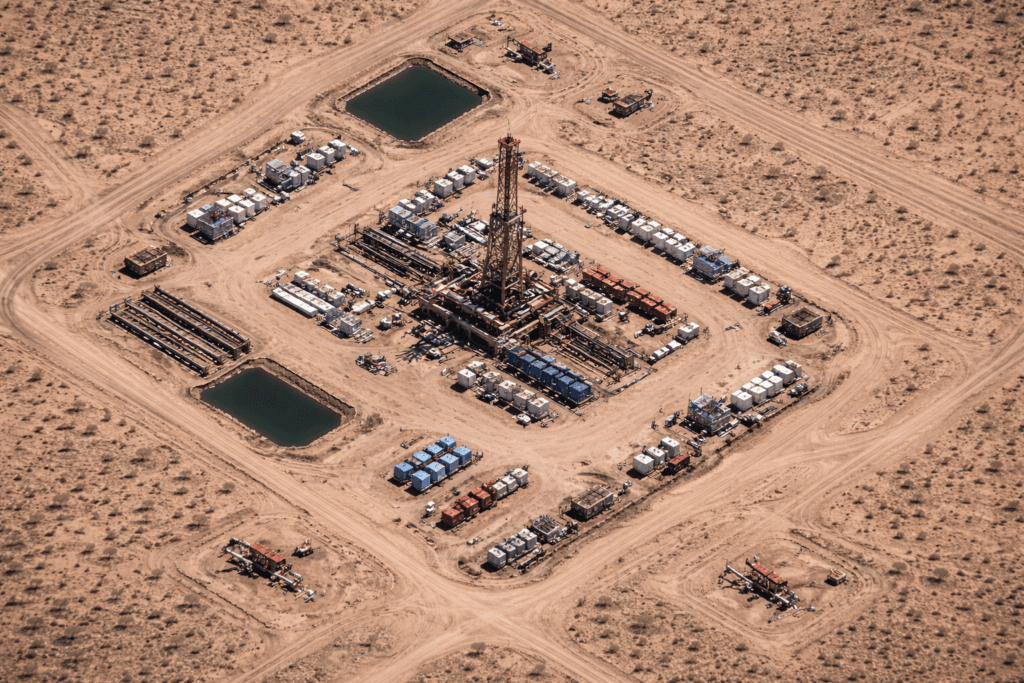
Exploration well pad, desert oil field
Satellite imagery portal
Explore Our Satellite Imagery Portal
View and order archive imagery or request new tasking for your area of interest, all in one place. Search global coverage, compare scenes and place an order in minutes.
01
Search the archive
Browse available high-resolution imagery for your pipeline, field or facility location.
02
Draw your AOI or upload a KML
Define your exact Area of Interest on the map, or insert a KML file of your corridor or lease.
03
Order imagery
Select archive imagery or request new tasking, then track and manage every request.
View and order archive imagery or request new tasking.
buysatelliteimages.com/satellite-imagery-portal
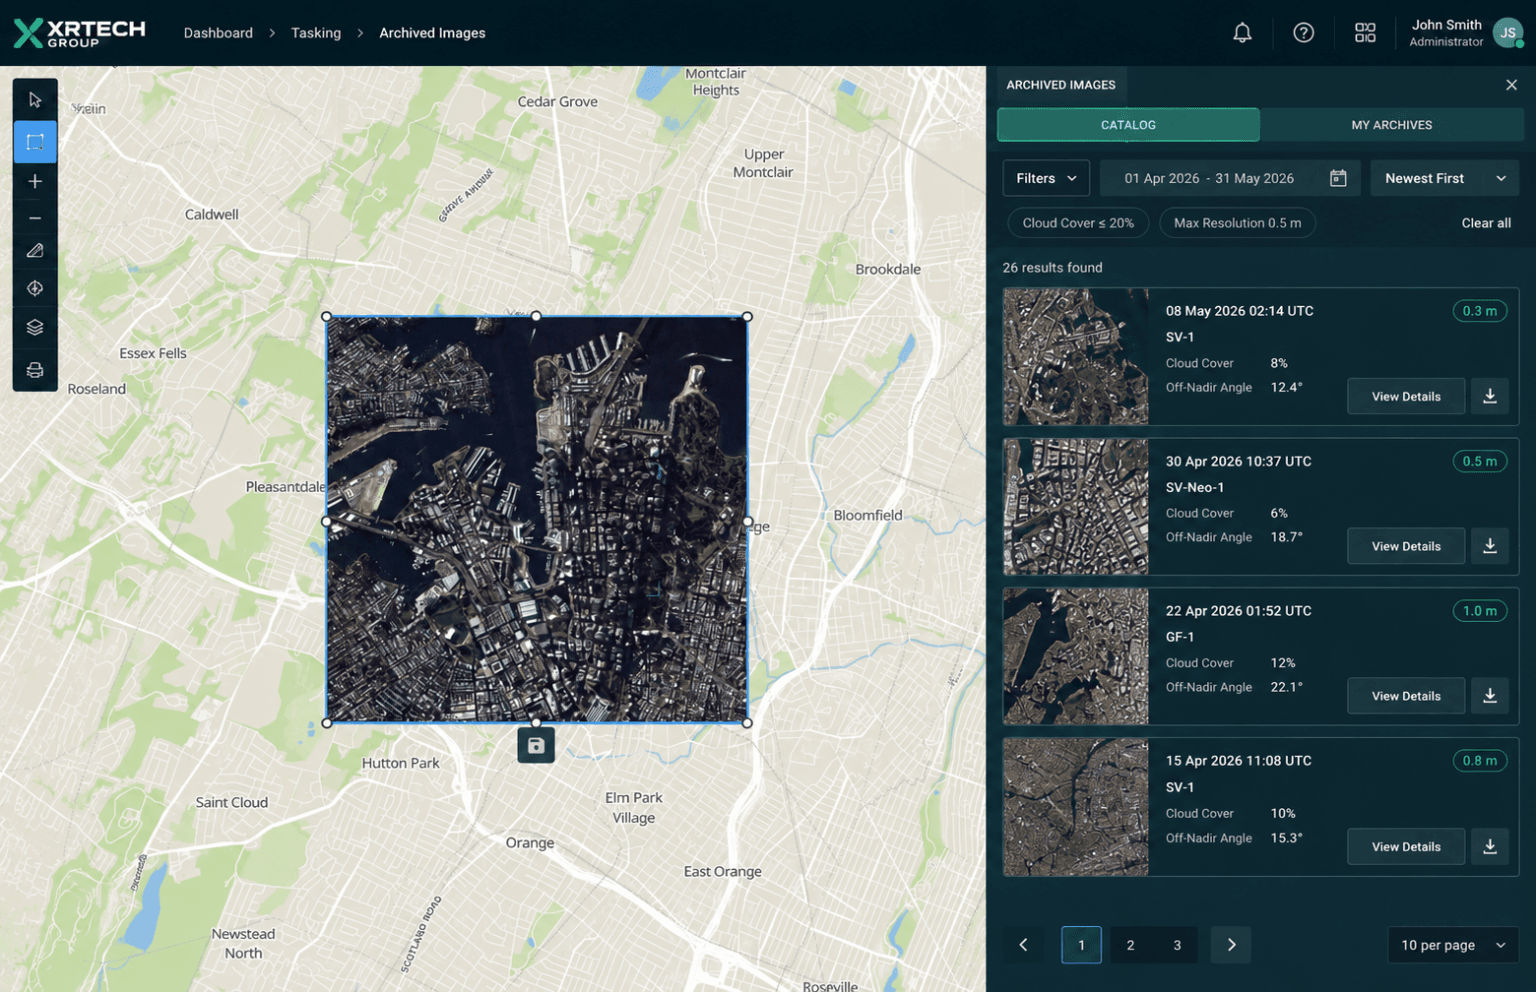
Archive search with AOI, cloud cover and resolution filters
Key uses
Satellite Imagery in Oil & Gas Operations
Satellite imagery for oil and gas supports monitoring, planning, risk assessment and decision-making across the full asset lifecycle, from first exploration to daily operations.
03 / Featured application
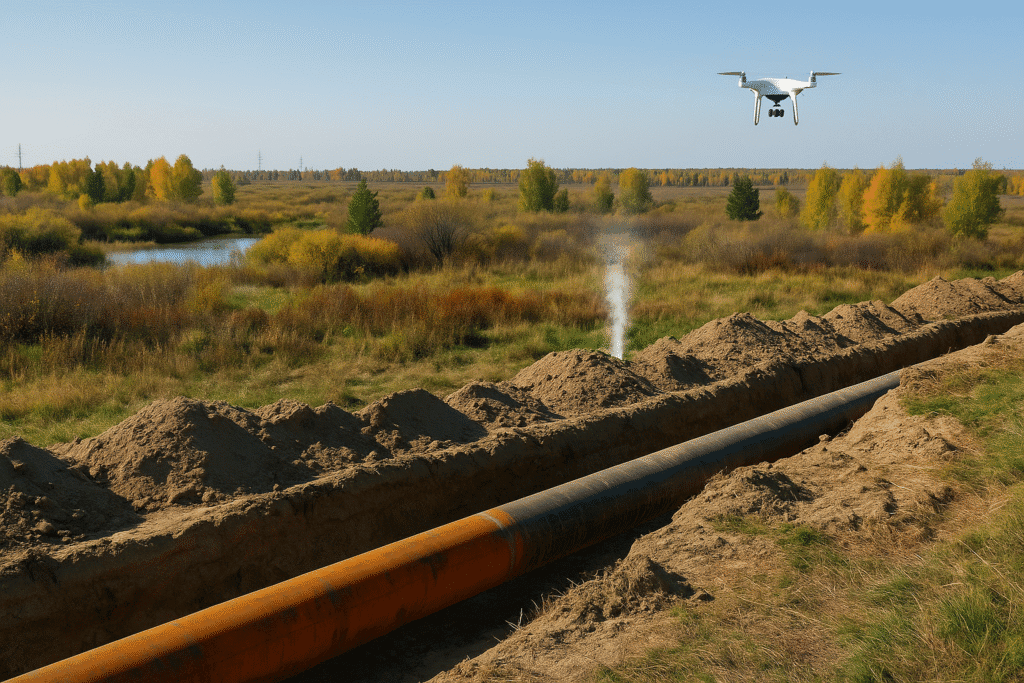
Oil & Gas Pipeline Safety Monitoring
Pipelines stretch across hundreds of kilometers of remote land, which makes ground patrols slow and expensive. Pipeline monitoring satellite imagery watches the whole corridor for damage, ground movement, encroachment and potential leaks, so risks are found and fixed before they turn into accidents.
Read about pipeline monitoring
01
Greenhouse Gas Emissions Monitoring
Watch gas releases around facilities and support environmental goals and compliance reporting.
02
Emergency Monitoring of Natural Disasters and Safety Incidents
Fast updates during earthquakes, storms and accidents help teams respond effectively and keep people safe.
04
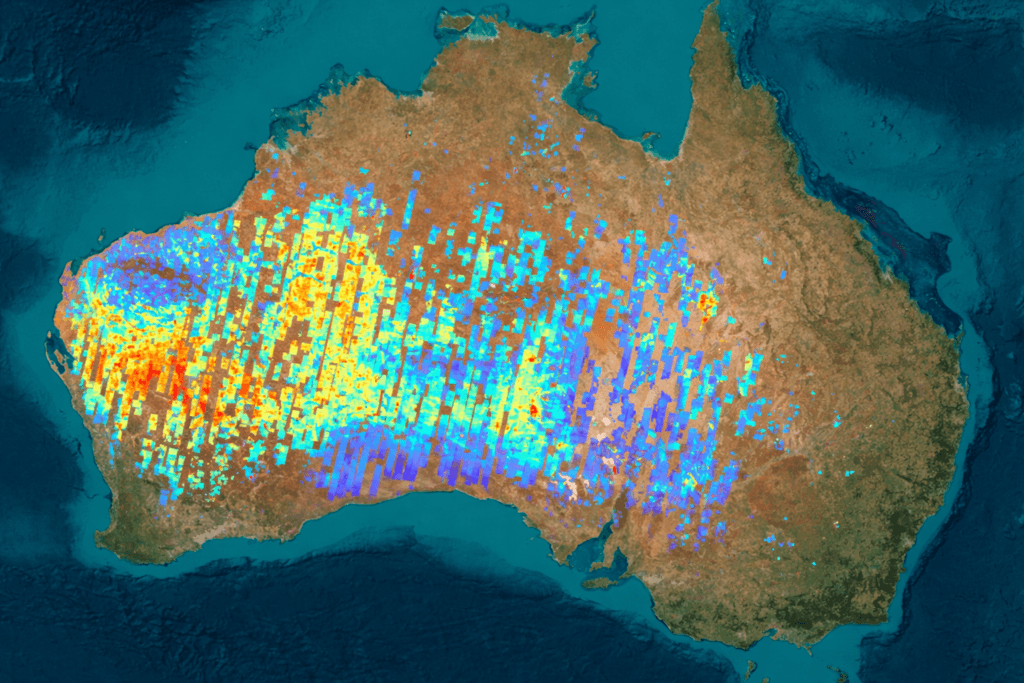
Oil Exploration & Production Monitoring
Follow activity across exploration and production areas to understand what is being found and produced.
05
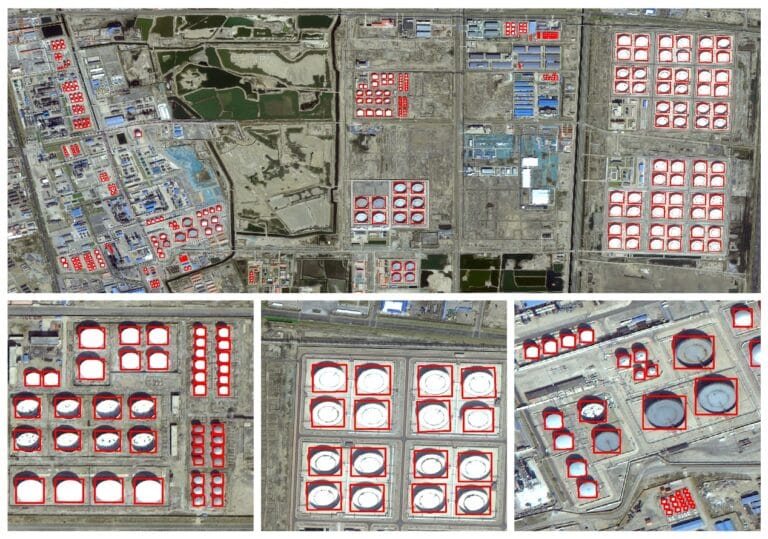
Crude Oil Inventory & Futures Monitoring
Measure storage in large tanks from space and track ports and tankers to read global supply.
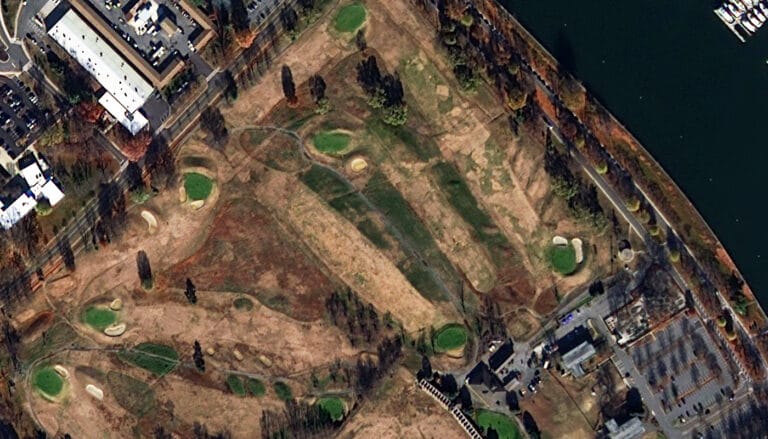
06
Oil & Gas Plant and Pipeline Construction Monitoring
Track new plants and pipelines from above to keep projects on schedule and built to plan.
07
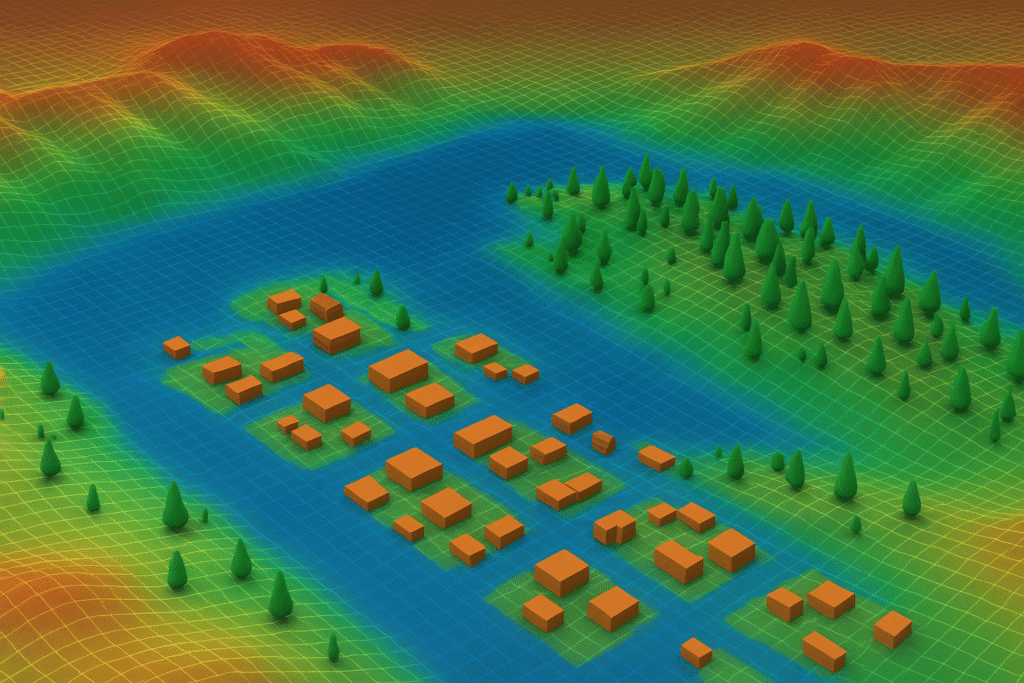
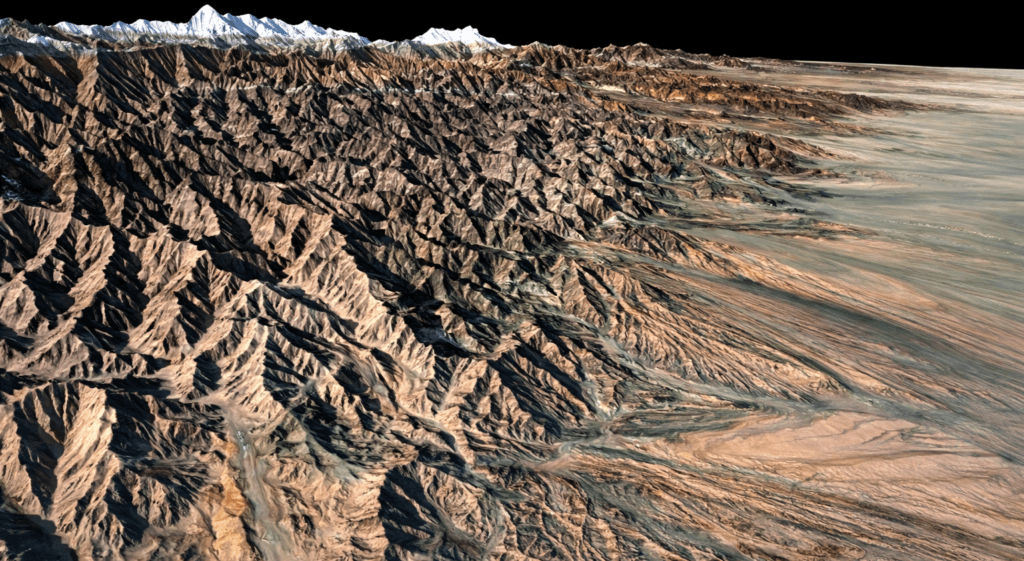
3D Model Construction of Exploration Areas
Build detailed, realistic 3D views of exploration regions from satellite elevation data.

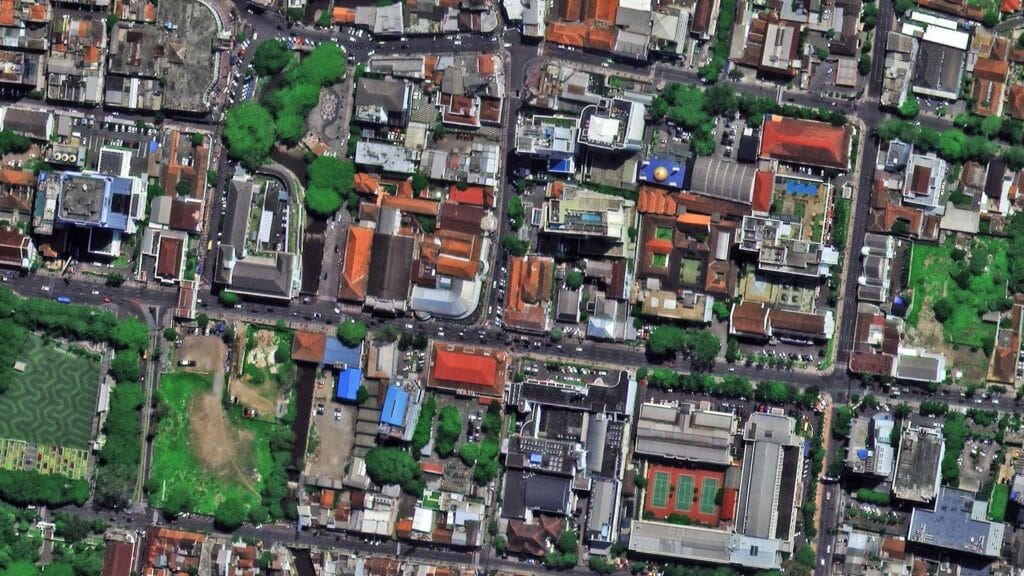
Pipeline safety
Pipeline Safety with Multi-Source Satellite Monitoring
XRTech combines satellite remote sensing with aerial and ground inspection data, then applies AI interpretation and InSAR to keep continuous watch on pipeline changes, geological hazards, encroachment and gas leaks. The result supports full censuses, routine patrols and urgent inspections along the entire route.
Optical satellite data
GF and SuperView imagery for visual pipeline census and regular inspection.
SAR data
LT-1 radar data for deformation monitoring and leak detection, even under cloud.
UAS and ground inspection
Very detailed local data for spot checks and field verification.
Archived and programmed data
Historical scenes and planned acquisitions for risk analysis and emergency inspection.
AI change detection and InSAR
Detect Changes Before They Become Bigger Problems
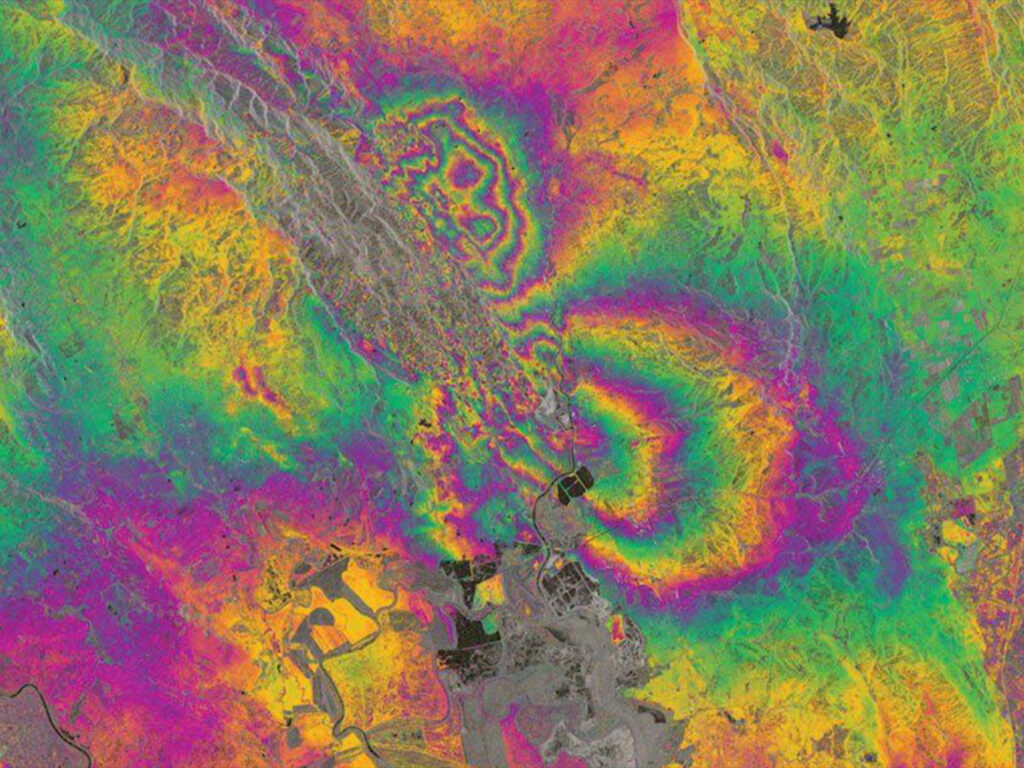
AI change detection compares each new scene with earlier ones and flags what has moved, appeared or disappeared. Interferometric Synthetic Aperture Radar (InSAR) measures subtle ground deformation along pipeline routes and around facilities, day and night and through cloud, so teams can act on risk early.
Ground deformation
Subsidence and terrain movement that can stress buried pipe.
Pipeline encroachment
Building work or excavation too close to the right of way.
Construction activity
New pads, roads and structures across fields and corridors.
Leaks and risk hotspots
Surface signs of gas leaks and areas that need an urgent visit.
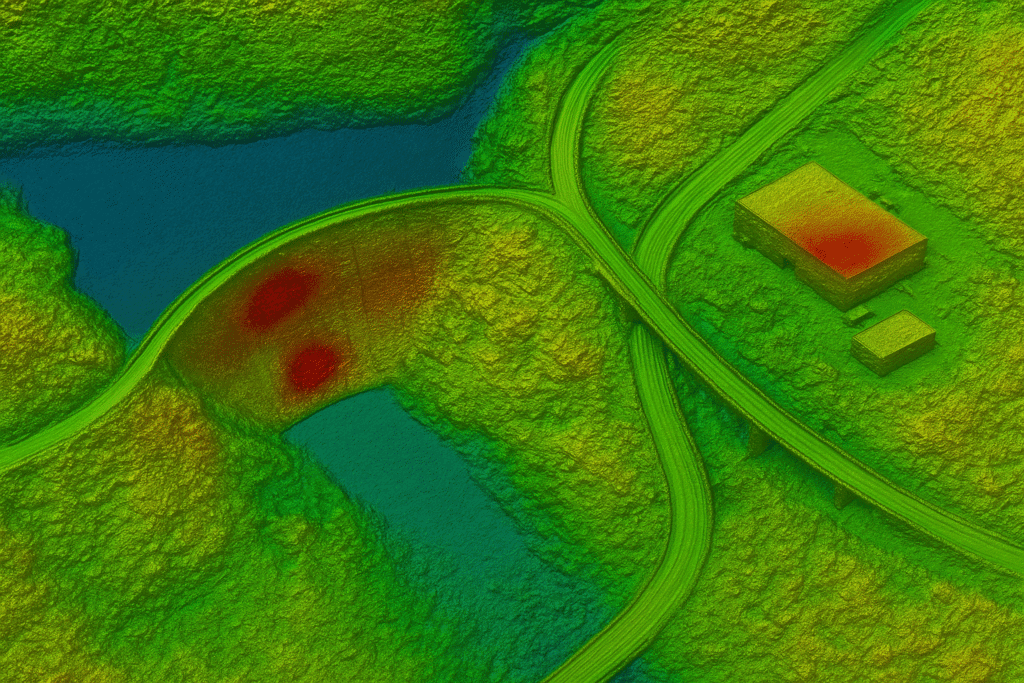
InSAR deformation
Stable to high movement
Advanced solutions
Built for the Unique Needs of the Oil & Gas Industry
XRTech combines satellite imagery, remote sensing and AI-driven analysis to turn raw data into reliable information for demanding oil and gas operations.
Get a Fast Quote
01
3D Views of Oil & Gas Areas
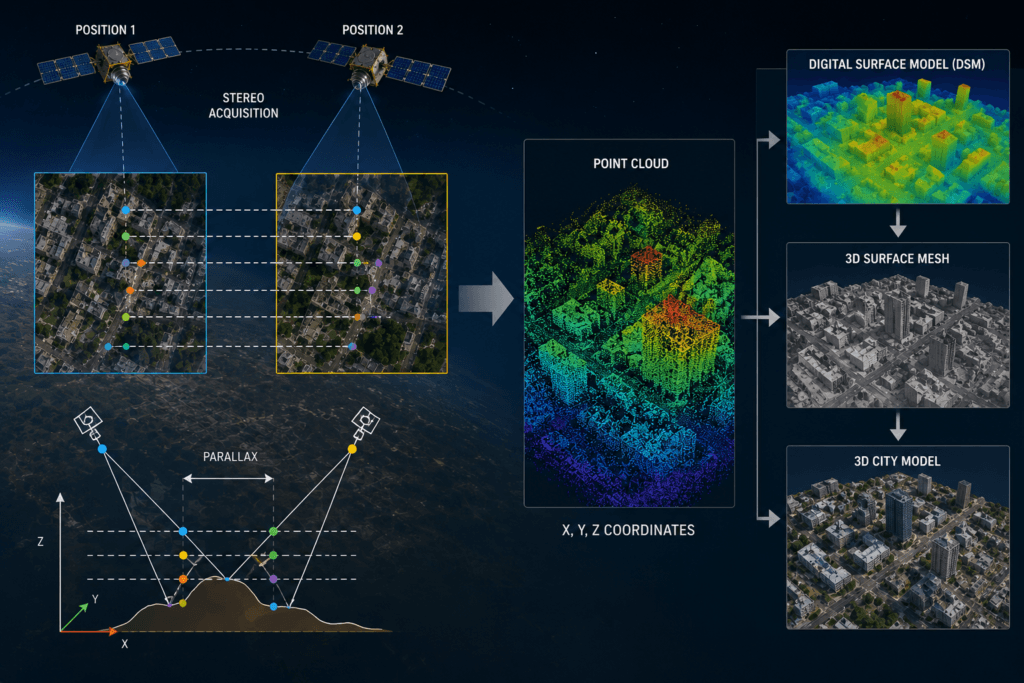
Remote sensing data is processed into Digital Orthophoto Maps (DOM) and Digital Elevation Models (DEM) to build a realistic, multi-dimensional view of every part of an oil and gas region, which makes sites easier to see, plan and monitor.
02
Construction Progress Monitoring
Very high-resolution data and AI change detection identify each construction stage, giving timely, accurate tracking of plant builds and pipeline development, even in far-off locations.
03
Pipeline Safety Monitoring
Optical, SAR and InSAR data combined with aerial and ground checks keep continuous watch on pipeline changes, ground shifts, encroachment and leaks.
04
Environmental & Emissions Monitoring
Near real-time tracking of environmental change finds pollution issues and emissions-related indicators quickly, helping operators reduce their impact.
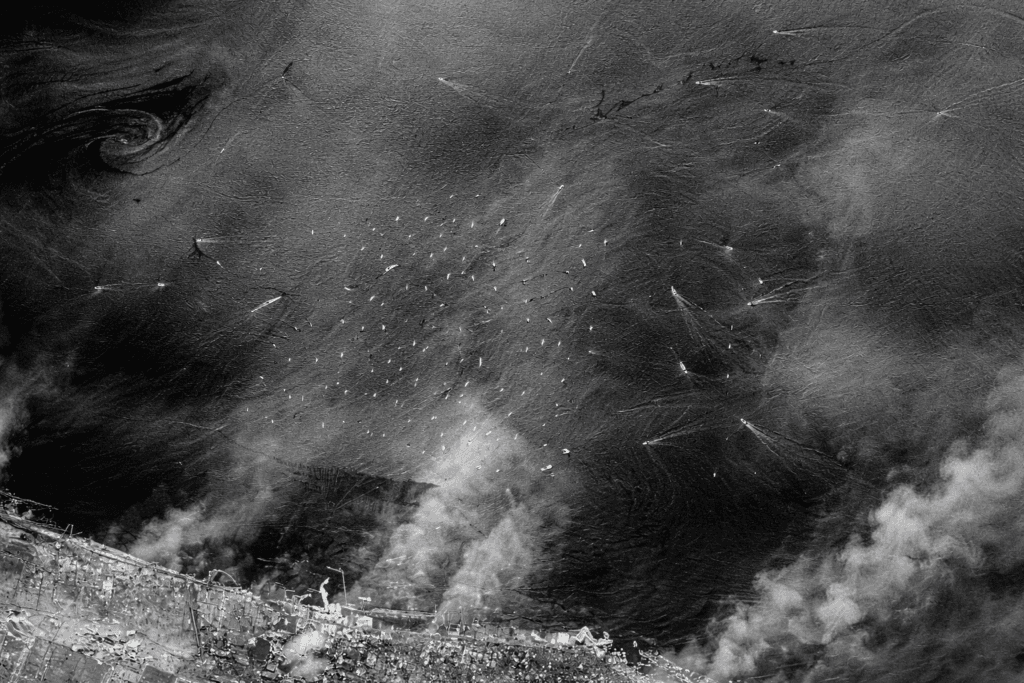
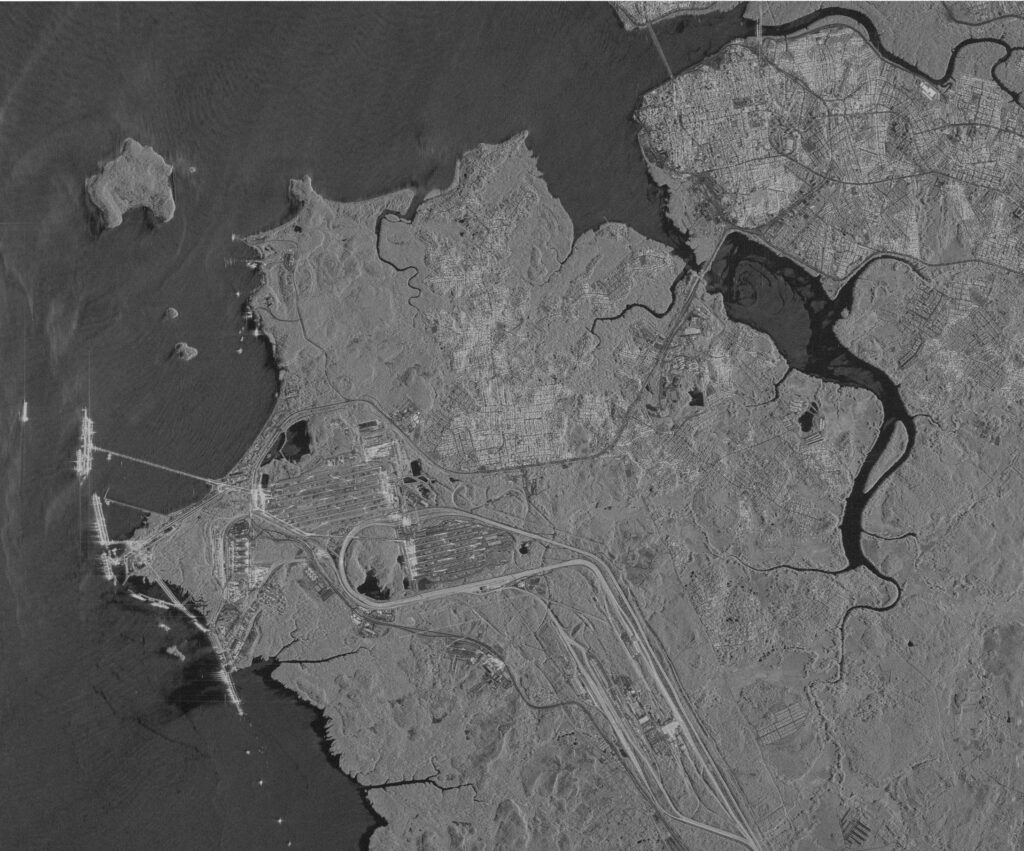
Marine oil spill, SAR observation through cloud
Emergency and disaster response
Rapid Satellite Intelligence When Conditions Change
Earthquakes and sandstorms, or accidents such as oil spills and explosions at sea, can disrupt plant operations and cause major environmental and financial losses. Satellite remote sensing provides continuous, all-day, all-weather observation of natural disasters and safety events, so emergency teams can respond faster and with better information.
Earthquake monitoring
Sandstorm monitoring
Oil spill response
Explosions and fires
Offshore incidents
Facility damage assessment
AI change detection highlights what has changed across oil and gas fields after an event, lifting the overall technical level of plant safety and shortening the time from image to action.
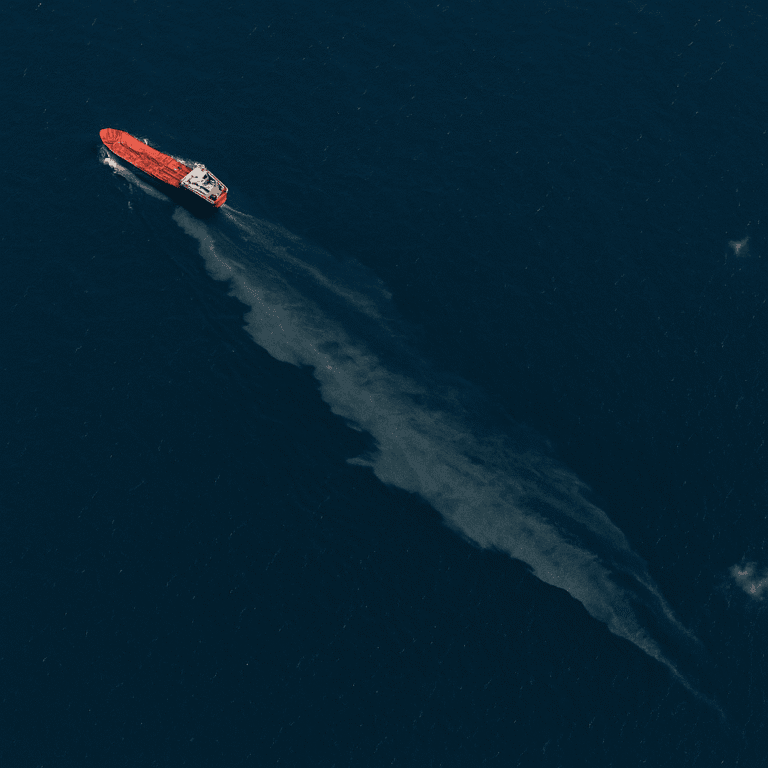
Case study
Oil Spill Response Monitoring with SAR
When an oil spill occurred at sea, the Gaofen-3 SAR satellite was used to find the location and extent of the slick. Radar observations tracked oil on the sea surface around the accident and gave responders the information they needed to decide what to do on site.
Sensor
Gaofen-3 C-band Synthetic Aperture Radar
Delivered
Spill location, extent and surface tracking, shared by partner China Siwei
90+
Satellite images acquired
~200
Remote sensing scenes shared
4 days
After the event
Crude oil inventory and maritime
Monitor Oil Storage, Ports and Maritime Activity from Space
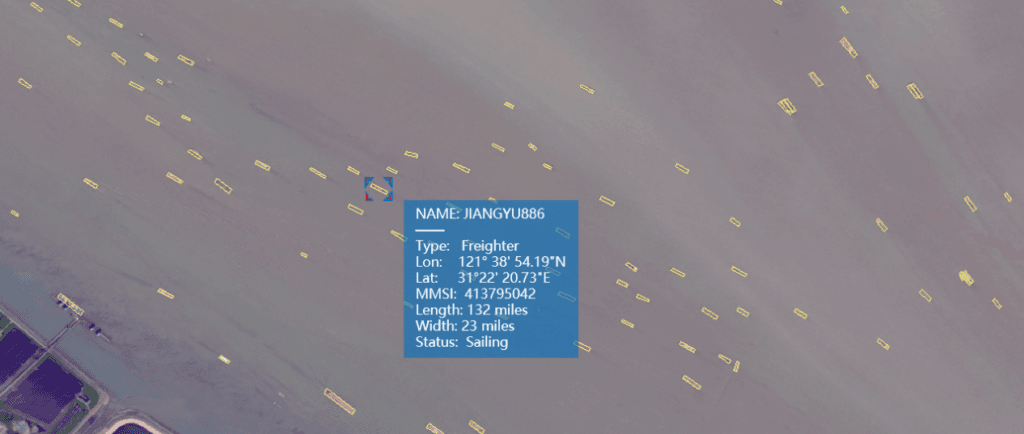
Crude oil satellite imagery shows how much oil sits in large storage tanks, how many tankers pass through ports and how vessels move. Combined with big data, these observations reveal global supply and trade patterns and help traders, analysts and policy makers make better decisions about crude oil futures.
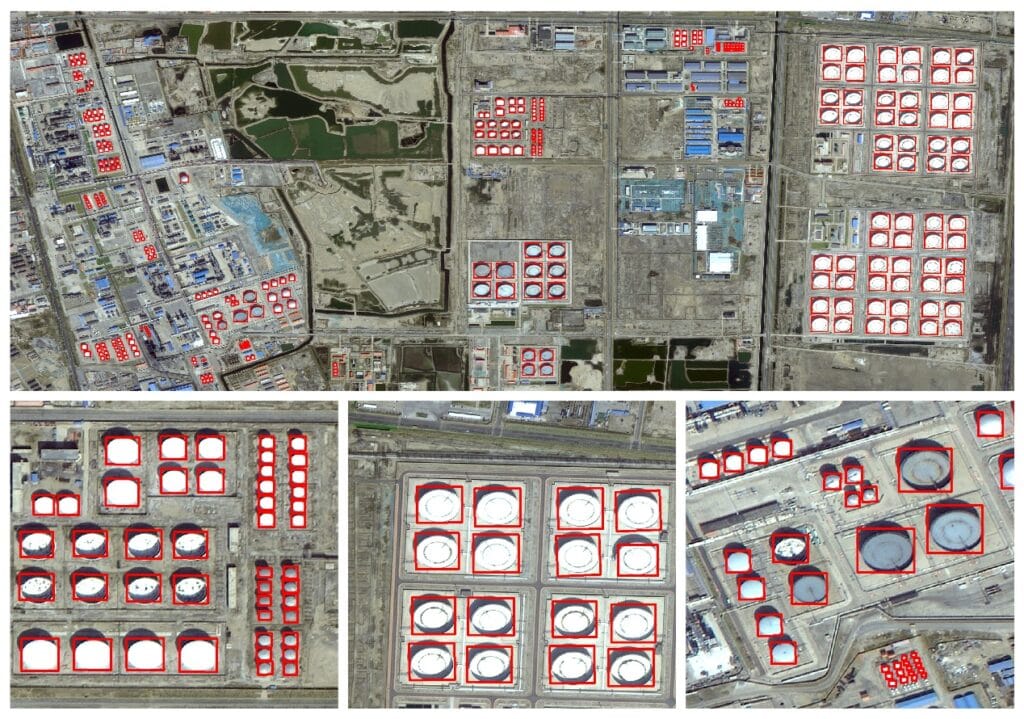
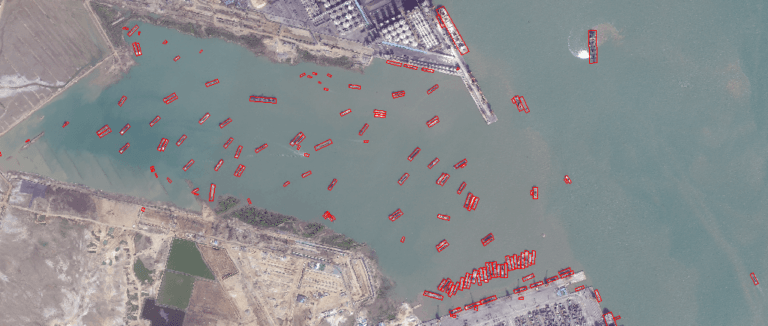
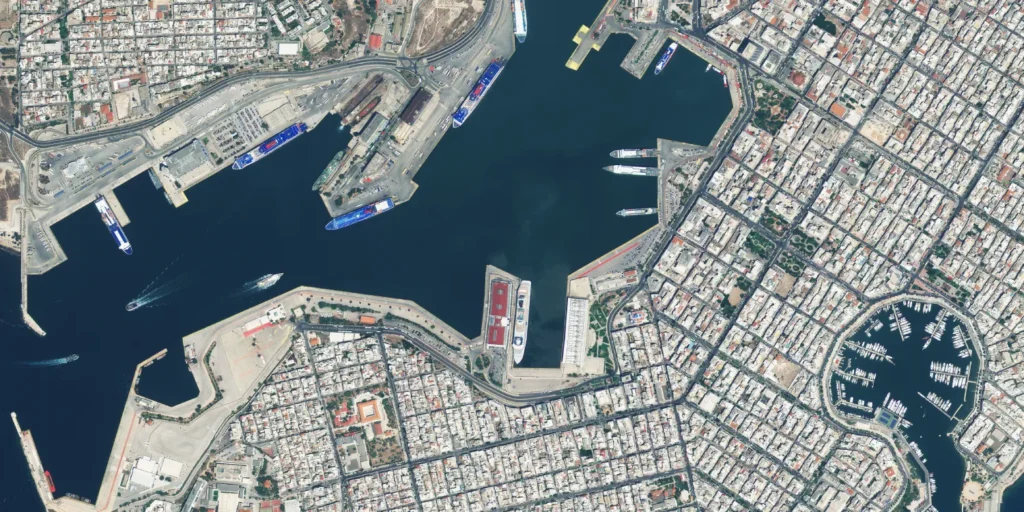
Storage
Oil storage tank monitoring
Observe storage levels across tank farms, terminals and depots and turn inventory into a measurable signal.
Maritime
Tankers and ports
Count tankers passing through ports and follow how vessels move along key routes.
Markets
Supply and market intelligence
Spot new details about global trade in crude oil and add an independent layer to futures analysis.

Earth Observation technology
See Your Assets in Detail
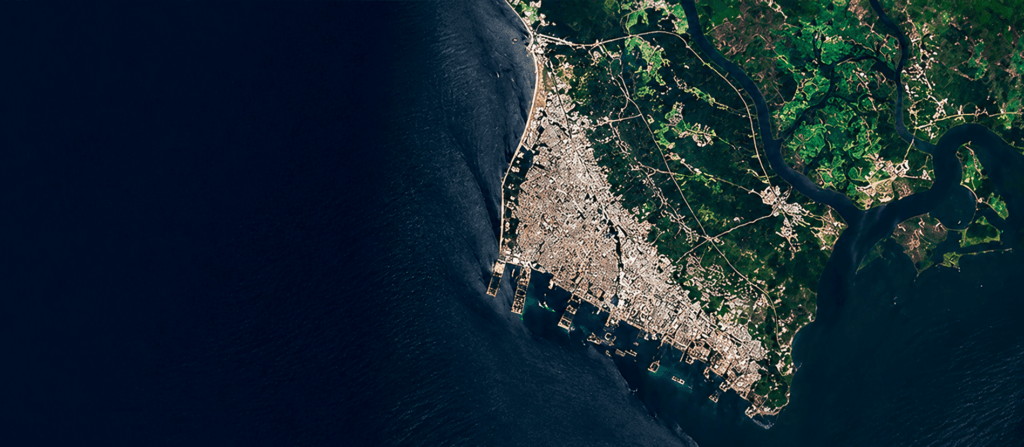
Multi-source data turns satellite imagery for oil and gas monitoring into a complete picture of your assets, stacking high-resolution optical scenes, spectral bands, radar, terrain models and 3D views over the same area of interest.
Layer 01
Optical imagery
0.3 m to 2 m resolution for visual inspection.
Layer 02
Multispectral
Environmental and land analysis across bands.
Layer 03
SAR radar
All-weather, day and night monitoring.
Layer 04
DEM, DSM and DTM
Terrain and elevation for routing and planning.
Layer 05
3D models
Detailed visualization of assets and terrain.
Over time
Change detection
Track what changes between captures.
Satellite constellation
A Broad Satellite Constellation for Oil & Gas Monitoring
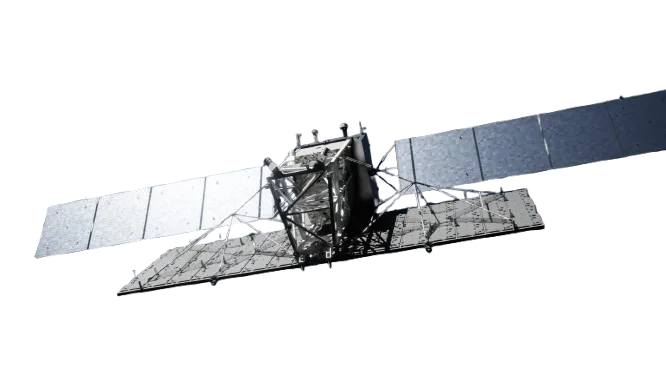
XRTech has access to more than 130 satellites with different resolutions, sensors and revisit characteristics, so each project gets the right balance of detail, coverage and cost. Resolutions run from 0.3 m per pixel for detailed site work to wide-swath sensors for regional mapping.
01
Submeter-level optical
Better than 1 m resolution, ideal for detailed site, plant and pipeline monitoring.
SuperView Neo-1
0.3 m/px
SuperView-2
0.4 m/px
SuperView-1
0.5 m/px
GF-7
0.65 m/px
GF-2
0.8 m/px
02
2 m-level and wide-swath optical
2 m imagery for broad areas with fine detail, plus wide-swath sensors with up to 800 km swath for very large areas and quick revisits.
GF-6
2 m/px
ZY-3
2 m/px
GF-1
8 m/px
GF-4
50 m/px
03
Radar / SAR
1 m to 5 m radar for all-weather, day-and-night monitoring and InSAR deformation analysis.
GF-3 SAR, C-band
1 m/px
LT-1 SAR, L-band
3 m/px
04
Specialized
Spectral sensors for material composition, environmental and exploration analysis.
GF-5B
30 m/px
ZY-1 02D
30 m/px
Sensors and imagery types
Choose the Right Sensor for the Job
Different sensors capture different information. Matching the sensor to the question is what makes oil and gas satellite imagery analysis complete.
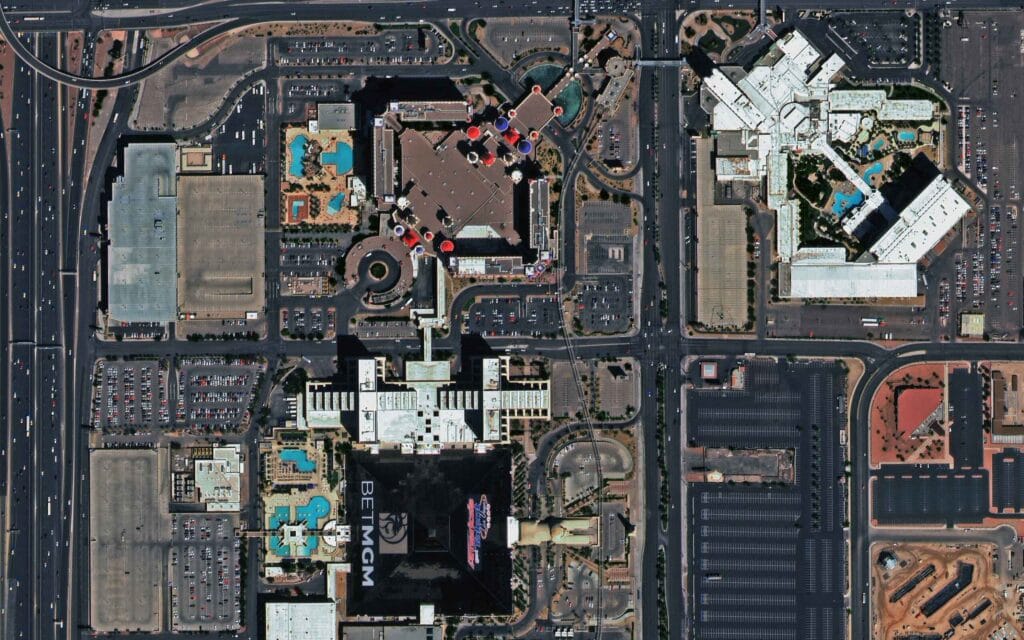
Optical
Panchromatic
High-resolution black-and-white imagery for detailed surface features.
Optical
Multispectral
Multiple bands for environmental change, land use and vegetation analysis.
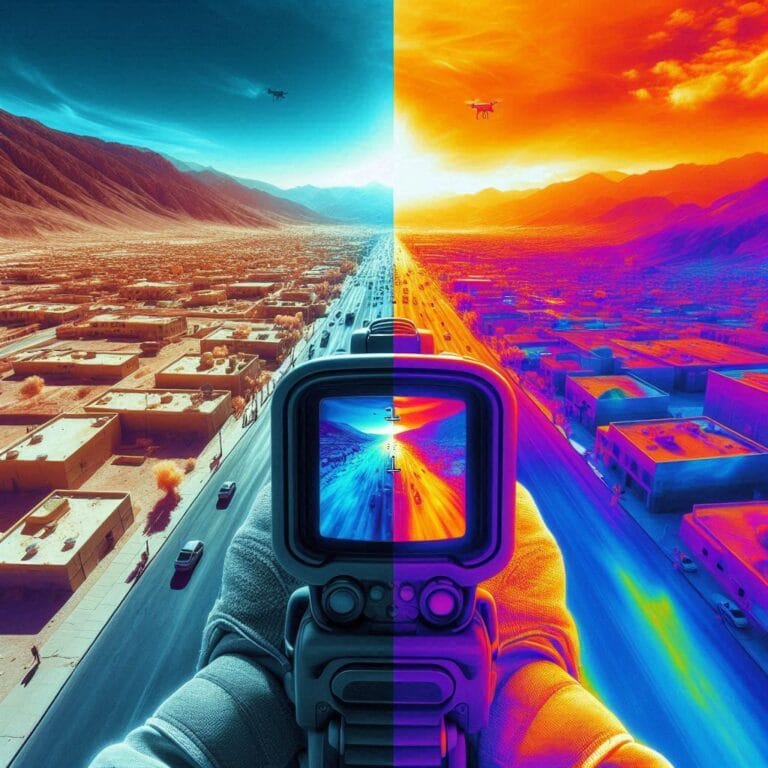
Optical
Infrared
Heat patterns for industrial monitoring and fire detection.
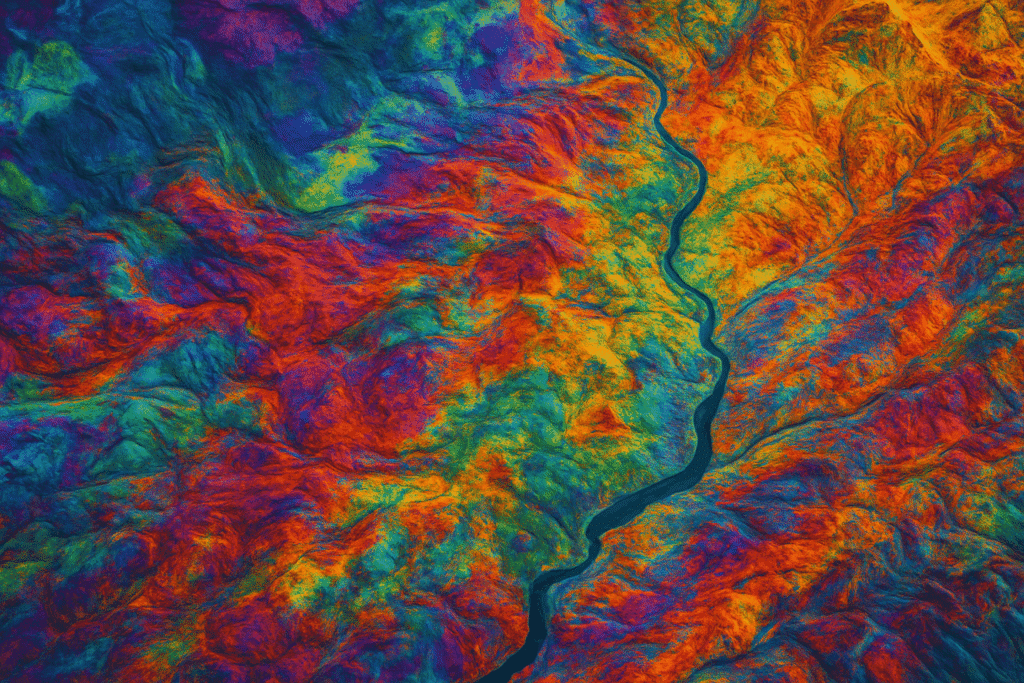
Optical
Hyperspectral
Hundreds of bands for material composition, valuable for exploration.
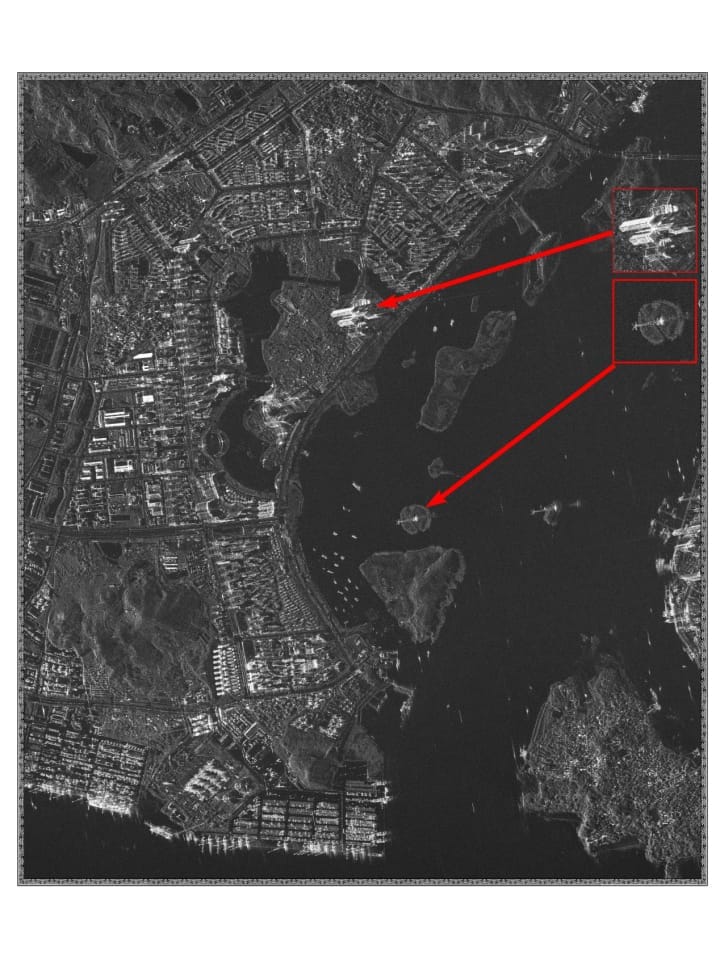
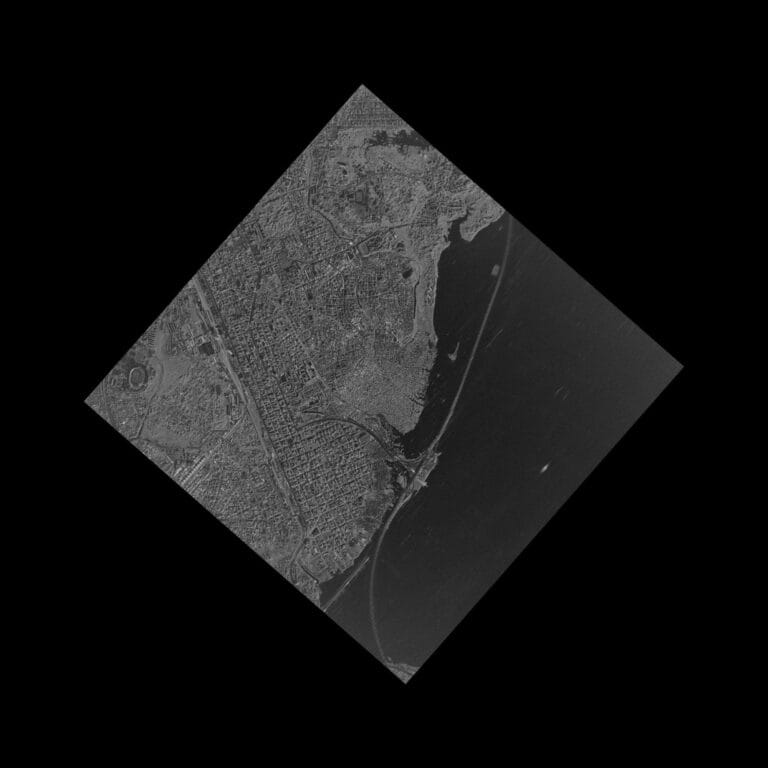
Radar imagery
Radar / SAR products
Synthetic Aperture Radar images the ground in any weather, day or night, so change detection keeps working through cloud, smoke and darkness.
All-weather imaging
Day and night acquisition
Spotlight mode, high-res local
Stripmap mode, wide area
Multiple polarization types
L, C and X frequency bands
Value-added products
Turn Satellite Data Into Operational Intelligence
Beyond raw scenes, XRTech processes imagery into GIS-ready products that plug straight into engineering, planning and monitoring workflows.
DEM and DSM
Digital Elevation and Surface Models for terrain analysis, pipeline routing and drainage studies.
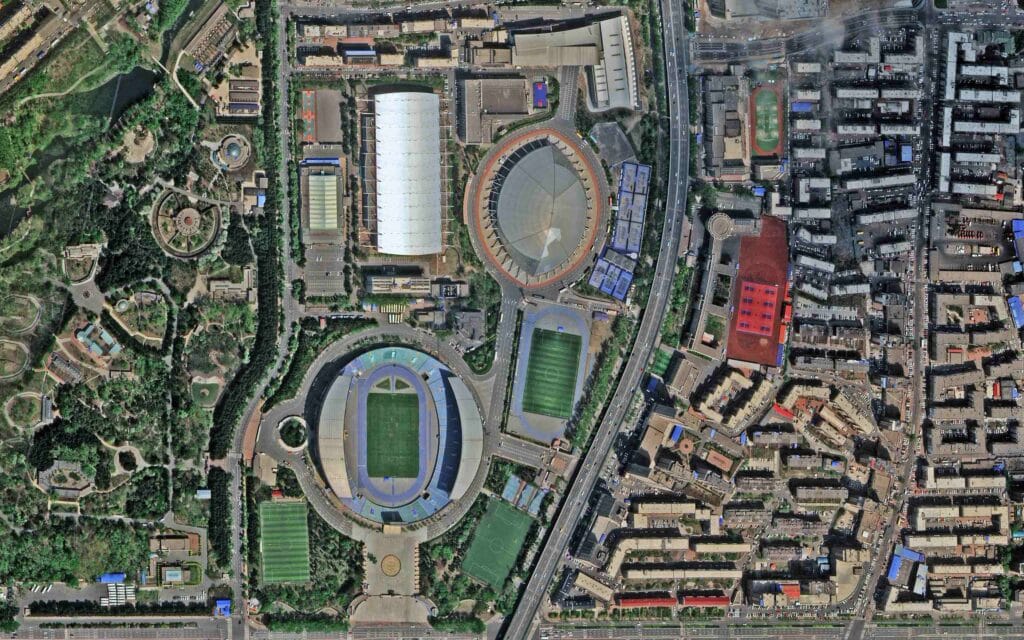
Digital Orthophoto Maps (DOM)
Orthorectified imagery with accurate geometry, ready to measure on and overlay with GIS and CAD data.
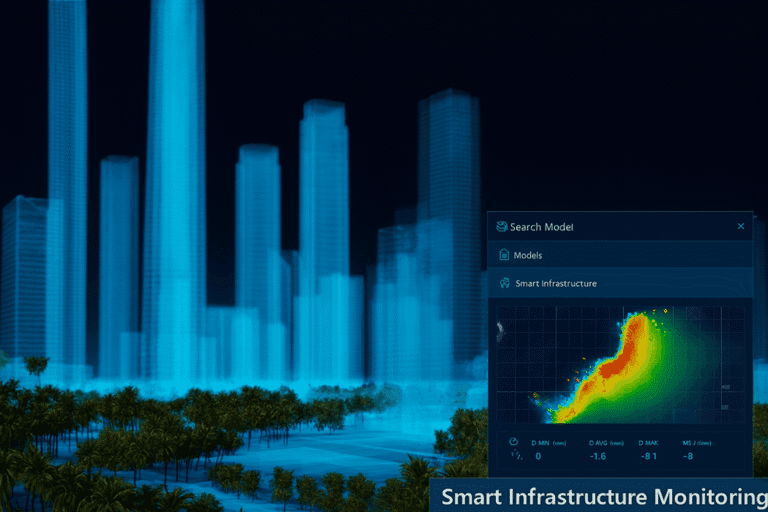
3D geographical scenes
Realistic 3D scenes of fields, plants and corridors for planning and stakeholder review.
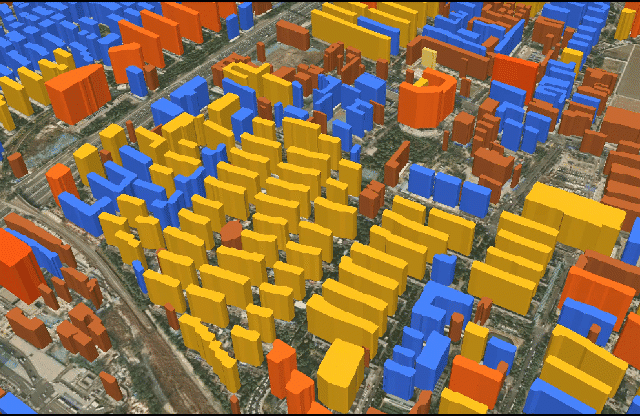
3D city and asset models
Detailed 3D models of facilities and surrounding structures for asset management.
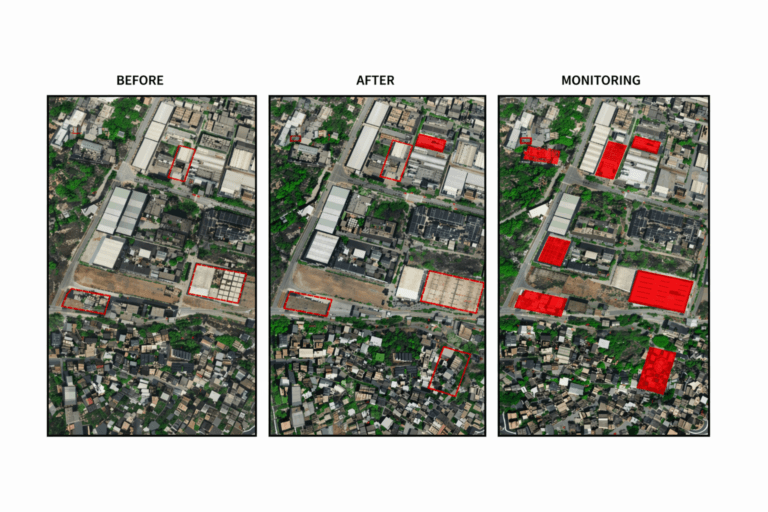
AI building and feature extraction
Automatic extraction of buildings, pads, roads and tanks into clean vector layers.
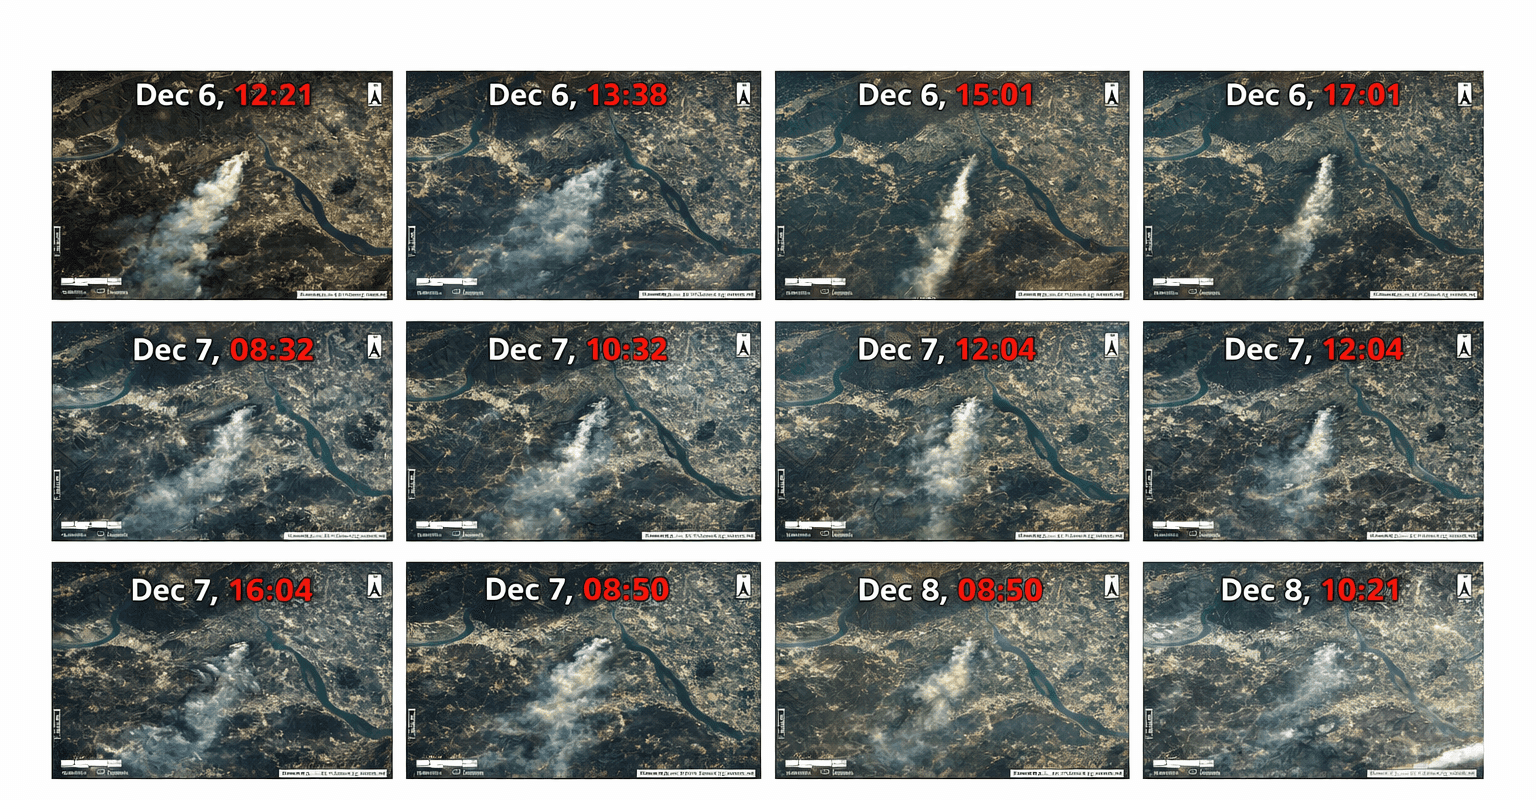
Change detection
Time-series comparison that flags new activity, damage or encroachment between captures.
Real-world impact
From Satellite Data to Operational Decisions
Our satellite imagery helps oil and gas companies reduce risk, improve decision-making and run more responsible operations across their assets and supply chains.
01
Observe
Capture fields, plants and corridors from orbit.
02
Analyze
Turn scenes into maps, models and alerts.
03
Monitor
Repeat captures to track change over time.
04
Respond
Act early on risks, incidents and delays.
Why XRTech
Why Teams Choose XRTech Group
Smart satellite monitoring for oil and gas brings practical, money-saving benefits: fewer site visits, earlier warnings and better decisions from reliable data.
01
Precision
Accurate data and analysis help teams understand their assets and make better choices.
Access to 130+ satellites
Imagery from 0.3 m resolution
High accuracy outputs
Improved decision-making
02
Operational efficiency
Remote sensing gives a full view of every area, finds problems in time and costs far less than traditional methods.
Increase efficiency, fewer site visits
Reduce labor and survey costs
Enhance safety with early warnings
Protect the environment
03
Flexibility
Data, licensing and delivery that fit how your teams already work.
Compatible GIS and CAD formats
Flexible licensing, no export license delays
Archive imagery or new tasking
Fast turnaround, cloud or HDD delivery
Client testimonials
What Our Clients Say
“Others said 3 weeks. XRTech delivered high resolution satellite imagery in 4 days, as was needed.”
National Mapping Lead, Africa
“We received high-resolution satellite imagery 2x faster than Maxar or Airbus vendors.”
Infrastructure Planner, Asia
“Clear licensing, human support, and fast turnaround, finally.”
NGO Partner, MENA
Technical specifications
Satellite Imagery Engineered for Precision
GIS-ready data in the formats, projections and licenses your engineering and analytics teams already use.
Imagery
Optical imagery
Resolution
High-resolution and sub-meter, from 0.3 m
Bit depth
8-bit, 11-bit and 16-bit
Processing
Ortho-ready and orthorectified imagery
Elevation
Terrain models
Products
DEM, DSM and DTM
Grid spacing
2 m to 10 m
Vertical accuracy
About ±3 m RMSE, where applicable
Data
Formats and projections
Raster
GeoTIFF, IMG
Vector and CAD
SHP, DWG
Coordinates
WGS84, UTM or custom systems
Delivery
Delivery and licensing
Delivery
Secure cloud delivery or physical HDD
License
Project-wide licensing
Publishing
Publication-friendly licensing
Pricing
Flexible Satellite Imagery Pricing for Oil & Gas Projects
Clear per km² pricing to buy satellite imagery for oil and gas projects of any size, from a single well pad to a full pipeline network. No hidden fees.
51 to 80 cm
High Resolution
Up to 4 bands
Archive imagery
USD 5 /km²
Minimum 25 km², older than 90 days
New tasking
USD 8 /km²
Minimum 100 km², freshly captured
31 to 50 cm
Very High Resolution
Up to 4/8 bands*
Archive imagery
USD 13 /km²
Minimum 25 km², older than 90 days
New tasking
USD 20 /km²
Minimum 100 km², freshly captured
30 cm
Super High Resolution
Up to 4 bands
Archive imagery
USD 20 /km²
Minimum 25 km², older than 90 days
New tasking
USD 30 /km²
Minimum 100 km², freshly captured
*Band availability may vary depending on the satellite source. Elevation models, SAR and analytics are quoted per project.
Archive or tasking
Archive Imagery or New Tasking?
Option A
Archive imagery
View existing satellite imagery already captured over your area. Archive scenes cost less and ship fastest, which makes them ideal for baselines, route studies and historical change analysis.
From USD 5 per km²
Minimum order 25 km²
Search and preview in the portal
Option B
New tasking
Request newly captured imagery for a specific Area of Interest. A satellite is scheduled over your site to show current conditions for inspections, incidents and construction checks.
From USD 8 per km²
Minimum order 100 km²
Fresh capture of your exact AOI
Search
→
Select
→
Define AOI
→
Review
→
Order
How to order
How the Portal Works
Order satellite imagery online in five steps, from a single facility to a pipeline corridor hundreds of kilometers long.
01
Search your area
Find your site by name, coordinates or map view.
02
View archive imagery
Compare available scenes by date, cloud cover and resolution.
03
Draw AOI or upload KML
Outline your area of interest or insert a KML file.
04
Choose archive or new tasking
Pick existing imagery or request a fresh capture.
05
Place your order
Confirm, then track and manage the request.
FAQ
Oil and Gas Satellite Imagery FAQs
Answers to the questions pipeline, operations and HSE teams ask us most. Cannot find yours? We respond in under 24 hours.
Ask a question
How is satellite imagery used in oil and gas?
Oil and gas companies use satellite imagery to monitor pipelines, plants, exploration areas and storage sites across large and remote regions. Common uses include pipeline safety checks, construction progress tracking, greenhouse gas and environmental monitoring, crude oil inventory estimates and rapid assessment after disasters or incidents.
How can satellite imagery monitor pipelines?
High-resolution optical imagery shows the corridor, right of way and nearby activity, so teams can spot encroachment and surface damage. SAR and InSAR add all-weather deformation monitoring that detects ground movement along the route, and AI change detection highlights what has changed between captures.
What is SAR satellite imagery used for?
Synthetic Aperture Radar sends its own signal, so it images the ground through cloud, smoke and darkness. In oil and gas it is used for oil spill detection at sea, InSAR deformation monitoring and reliable change detection in regions with frequent cloud cover.
How can satellite imagery monitor oil storage?
Repeated high-resolution images of tank farms, terminals and depots show storage activity, while port and tanker observations add maritime context. Together they give an independent view of crude oil inventory and supply.
What is the difference between archive imagery and new tasking?
Archive imagery has already been captured and is more than 90 days old. It starts at USD 5 per km² with a 25 km² minimum. New tasking schedules a satellite to capture your area now, starting at USD 8 per km² with a 100 km² minimum.
Can I upload a KML to select my Area of Interest?
Yes. In the satellite imagery portal you can draw your Area of Interest on the map or upload a KML file of your pipeline corridor, field or lease boundary, then search archive imagery or request new tasking for that exact area.
Which file formats and coordinate systems do you deliver?
We deliver GeoTIFF, IMG, SHP and DWG in WGS84, UTM or a custom coordinate system, through secure cloud delivery or on a physical HDD.
How do I order satellite imagery for an oil and gas project?
Search your area in the portal, review available archive scenes, define your AOI, choose archive or new tasking and place the order. For large or multi-site projects, request a custom quote and our team will respond in under 24 hours.
Ready to Monitor Your Oil & Gas Assets From Space?
Get satellite imagery for oil and gas monitoring, plus SAR, DEMs, 3D models and remote sensing products, for a single site or an entire pipeline network.
We respond in under 24 hours. Free satellite imagery samples can be included.