
Landsat 7 Satellite Images Download: Full ETM+ Archive from the Landsat 7 Satellite
Landsat 7 Band Reference: 15m Panchromatic · 30m Multispectral · Archive 1999–2024
Landsat 7 is a NASA and USGS Earth observation satellite that operated from April 1999 until its decommissioning on June 4, 2025, more than five times its planned 5-year design life. XRTech Group provides Landsat 7 images download access from the full historical archive, giving you every Landsat 7 band captured by the Enhanced Thematic Mapper Plus (ETM+) sensor for long-term land, agriculture, and environmental analysis.
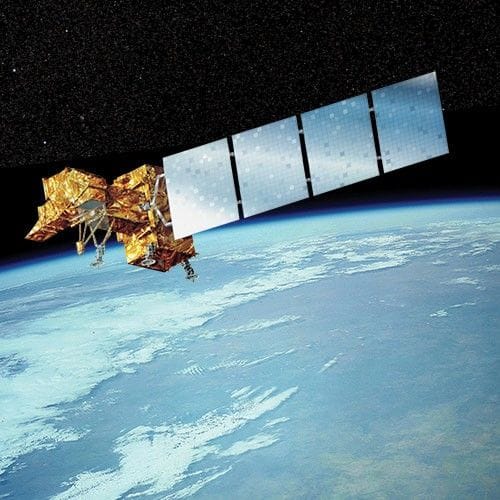
What Is the Landsat 7 Satellite?
The Landsat 7 satellite launched on April 15, 1999 from Vandenberg Air Force Base, California, as a joint mission between NASA and the U.S. Geological Survey (USGS). Designed for a 5-year mission life, Landsat 7 remained operational for more than 25 years, one of the longest-serving satellites in the Landsat program's history, before its final decommissioning on June 4, 2025.
Landsat 7 carried the Enhanced Thematic Mapper Plus (ETM+), an upgraded version of the sensors flown on Landsat 4 and Landsat 5. Every Landsat 7 image combines eight spectral bands, including a sharp 15m panchromatic band, giving analysts far more usable detail than earlier missions in the program. Landsat 7's data has become one of the most widely used sources for long-term land, agricultural, and environmental monitoring anywhere in the remote sensing field.
Because the Landsat 7 satellite no longer acquires new imagery, XRTech Group focuses on making Landsat 7 images download access simple: sourcing, processing, and delivering archive scenes from 1999 through 2024 in analysis-ready form for your area of interest.
The Landsat 7 Scan Line Corrector Failure, Explained
In May 2003, a hardware failure in the ETM+ scanning mechanism's Scan Line Corrector (SLC) caused wedge-shaped data gaps in every Landsat 7 image acquired afterward, affecting roughly 22% of each scene, wider toward the edges and narrower toward the scene center. Scientists later developed specialized gap-filling algorithms that interpolate missing pixels using data from adjacent scenes, substantially restoring usability for most analytical purposes.
Landsat 7 Band Reference: The Full ETM+ Spectral Lineup
The ETM+ instrument captures eight bands total, delivered as 8-bit imagery with 256 grey levels. Knowing each Landsat 7 band's wavelength and resolution is the first step in selecting the right imagery for your project.
| Band | Spectral Range | Resolution |
|---|---|---|
| Band 1 — Blue | 0.45–0.52 µm | 30 m |
| Band 2 — Green | 0.52–0.60 µm | 30 m |
| Band 3 — Red | 0.63–0.69 µm | 30 m |
| Band 4 — Near-Infrared | 0.77–0.90 µm | 30 m |
| Band 5 — Short-Wave Infrared | 1.55–1.75 µm | 30 m |
| Band 6 — Thermal (Low/High Gain) | 10.40–12.50 µm | 60 m |
| Band 7 — Mid-Infrared | 2.08–2.35 µm | 30 m |
| Band 8 — Panchromatic (PAN) | 0.52–0.90 µm | 15 m |
What Sets the Landsat 7 ETM+ Sensor Apart
Compared to the Thematic Mapper on Landsat 4 and 5, the Landsat 7 ETM+ instrument added a dedicated 15m panchromatic band (Band 8), giving sharper detail for feature identification, and split the thermal channel into low-gain and high-gain 60m modes for improved dynamic range over both bright and dark surfaces. Landsat 7 also introduced onboard calibration through a Full Aperture Solar Calibrator (FASC) and Partial Aperture Solar Calibrator (PASC), in addition to two internal calibration lamps, improving the long-term radiometric consistency of every Landsat 7 image in the archive.
Applications for Landsat 7 Satellite Images
Agriculture
Landsat 7 provides over 20 years of reliable data for trend analysis and seasonal crop monitoring, especially valuable in data-limited regions with few alternative historical sources.
- Crop condition analysis: track crop health and growth with NDVI and other indices to spot early stress.
- Yield prediction support: estimate yields by comparing vegetation data across years.
- Soil moisture estimation: assess surface moisture to estimate irrigation needs.
- Irrigation planning: locate water-stressed zones to adjust irrigation schedules.
- Field boundary mapping: define cropland using historic Landsat 7 satellite images.
Construction and Urban Planning
Landsat 7 offers more than 20 years of consistent data for analyzing urban and infrastructure growth against a stable historical baseline.
- Urban expansion detection: trace urban sprawl with consistent imagery to understand growth patterns.
- Infrastructure monitoring: pinpoint when and where construction occurred using historical archive data.
- Environmental impact analysis: assess changes in vegetation and water resulting from urban growth.
- Urban heat island monitoring: track temperature shifts using Landsat 7 thermal band data.
- Pre-development assessment: review land history before major construction projects begin.
Environmental and Climate Change
Landsat 7 enables long-term environmental change analysis with consistent global data stretching back to 1999.
- Forest disturbance tracking: monitor deforestation, fires, and regrowth from the early 2000s to the archive's end.
- Wetland and water monitoring: observe long-term surface water and wetland trends with Landsat 7 images.
- Climate impact analysis: track glacier retreat, snow loss, vegetation shifts, and land degradation.
- Disaster damage mapping: assess wildfire, flood, and drought effects using historic Landsat 7 imagery.
- Biodiversity assessment: map ecosystem changes and threats to protected areas with multispectral data.
Get More from Landsat 7 Satellite Images with Analytics
Indices & Band Combinations
Choose from 20+ ready-to-use indices and band presets across every Landsat 7 band to analyze vegetation dynamics, soil properties, and land change, or build custom indices for specific project needs.
Change Detection
Track landscape changes over time by comparing multiple Landsat 7 images taken on different dates, supporting urban growth, environmental variation, and disaster impact monitoring.
Clusterization
Segment your AOI into zones with similar index values using clustering and vectorization, exposing subtle variations in vegetation, land cover, and water quality.
Full Technical Specifications
Sensor & Coverage
| Provider | NASA / United States Geological Survey (USGS) |
| Primary Instrument | Enhanced Thematic Mapper Plus (ETM+) |
| Panchromatic Resolution | 15 m GSD |
| Multispectral Resolution | 30 m GSD (60 m thermal) |
| Swath Width | 185 km at nadir |
| Positional Accuracy | 15–30 m at nadir |
| Scene Size | ~185 × 183 km |
| Daily Coverage | ~185,000 km² |
| Stereo Imaging | Not available |
Orbit & Spacecraft
| Orbit Type | Sun-synchronous, near-polar |
| Inclination | 98.2° |
| Altitude | 705 km (438 mi) |
| Orbital Period | ~99 minutes |
| Repeat Cycle | 16 days |
| Equatorial Crossing | ~10:00 AM (±15 min) |
| Mass | ~4,800 lbs (2,200 kg) |
| Downlink Rate | 150 Mbps, direct with onboard solid state recorders |
Landsat 7 Key Dates
The Landsat 7 satellite launches from Vandenberg Air Force Base, carrying the new Enhanced Thematic Mapper Plus sensor.
The Scan Line Corrector fails, introducing wedge-shaped data gaps into all subsequent Landsat 7 images, affecting roughly 22% of each scene.
Nominal science operations conclude after 23 years, more than four times the satellite's original 5-year design life.
Landsat 7 acquires its final images before ceasing data collection entirely.
The Landsat 7 satellite is formally decommissioned, closing out more than 25 years of continuous Earth observation.
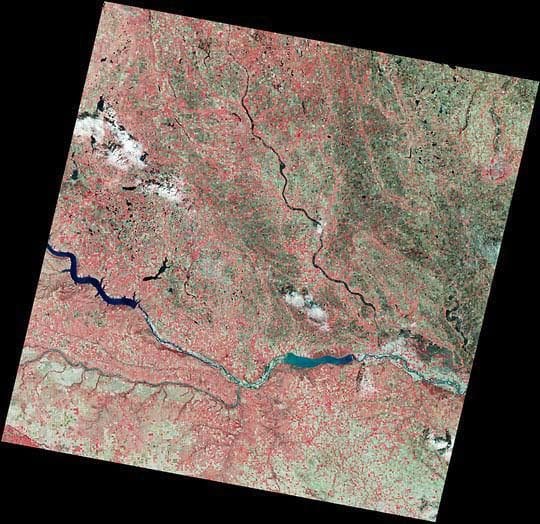
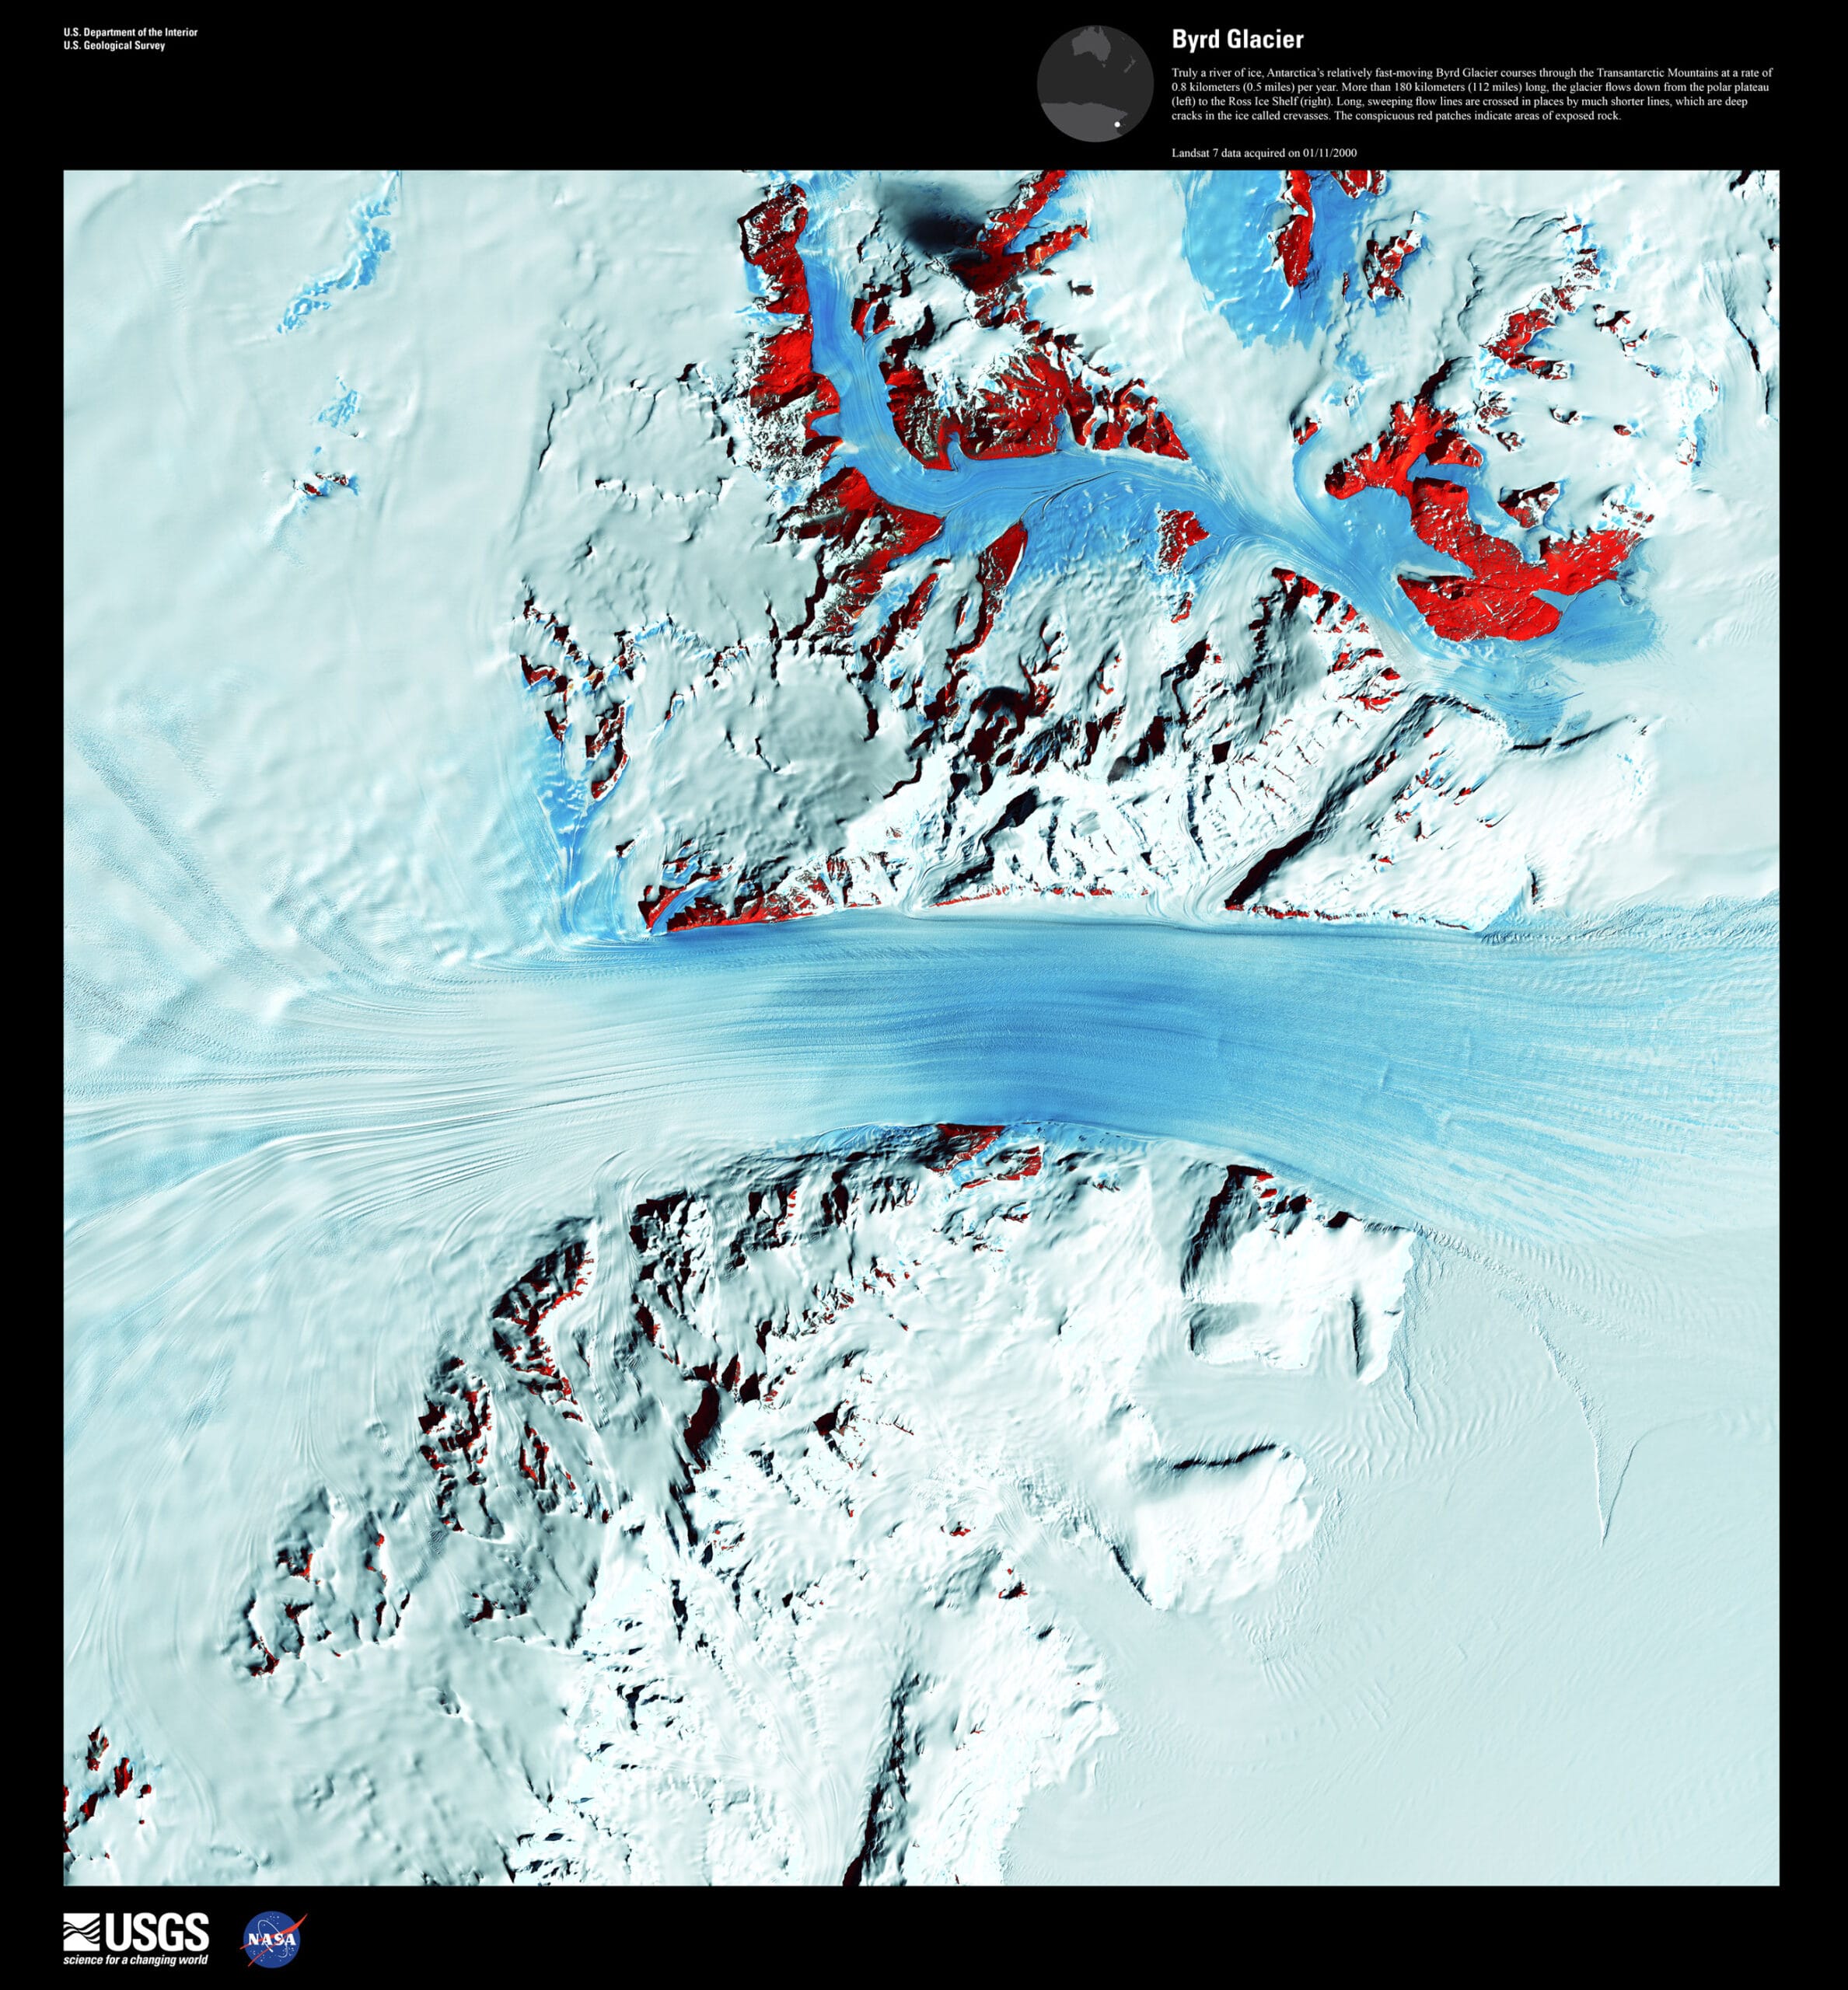
Landsat 7 Satellite Image Samples
Key Features and Benefits of Landsat 7 Archived Imagery
- Cost-Effective AccessAffordable archive imagery for long-term analysis and mapping workflows, without the cost of tasking a new commercial satellite.
- Wide Regional CoverageA 185km swath width enables efficient coverage of large areas per pass, reducing the number of scenes needed for regional projects.
- Trusted Historic ArchiveDecades of consistent Landsat 7 satellite images support climate, land use, and environmental research going back to 1999.
- AI Training & Validation DataHistoric baseline imagery complements modern missions for AI model training, trend modeling, and cross-sensor validation.
End-to-End Support for Landsat 7 Images Download
Expert Consultation
Our geospatial specialists help you choose the right Landsat 7 band combination and time period for your analysis, including guidance on SLC-off scenes.
Rapid Delivery
Direct access to a 130+ satellite constellation network, including historical Landsat archives, for faster turnaround on your order.
Seamless Integration
Landsat 7 satellite images delivered in industry-standard formats, ready for your GIS, CAD, or modeling workflow.
Common Questions About the Landsat 7 Satellite
Is the Landsat 7 satellite still active?
No. Landsat 7 ended nominal operations in April 2022, made its final acquisition in May 2024, and was formally decommissioned on June 4, 2025. Only archive Landsat 7 images from 1999 to 2024 are available.
What is the Scan Line Corrector failure, and does it affect every Landsat 7 image?
The SLC failed in May 2003, creating wedge-shaped data gaps affecting about 22% of each scene captured afterward. Images from before May 2003 are unaffected, and gap-filling algorithms can restore most usability in SLC-off scenes.
How many Landsat 7 bands are there, and what resolution do they capture?
The ETM+ instrument carries 8 bands: six at 30m (Blue, Green, Red, NIR, SWIR, Mid-IR), one thermal band at 60m, and a 15m panchromatic band.
How do I download Landsat 7 images for my area of interest?
XRTech Group sources, processes, and delivers Landsat 7 images download packages matched to your AOI, date range, and preferred bands, in analysis-ready formats for GIS and remote sensing software.
What is Landsat 7 satellite imagery typically used for?
Long-term agriculture monitoring, urban and infrastructure growth analysis, and environmental and climate change studies are the most common uses, given the archive's depth and consistency since 1999.
Ready to Download Landsat 7 Satellite Images?
Talk to our geospatial team about scene selection, band combinations, and SLC-off handling for your area of interest and time period.