
Landsat 8 Imagery: View And Download Satellite Data
Landsat 8 Band 8 Panchromatic at 15m · Multispectral at 30m · Thermal at 100m
Landsat 8 is a NASA and USGS Earth observation satellite launched in 2013 and still active today, continuously adding to one of the largest free multispectral archives available. XRTech Group makes it simple to download Landsat 8 satellite data: every Landsat 8 image, all 11 spectral bands including Landsat 8 Band 8 panchromatic, sourced, processed, and delivered for your area of interest.

What Is Landsat 8?
Landsat 8 launched on February 11, 2013 as a joint mission between NASA and the U.S. Geological Survey (USGS), continuing the Landsat program's satellite imagery record that stretches back to 1972. Designed with a 5-year mission life but carrying enough fuel for 10 years, Landsat 8 has now operated well past both milestones, with an extended mission currently projected into 2028.
Every Landsat 8 image is built from two onboard instruments: the Operational Land Imager (OLI), built by Ball Aerospace & Technologies Corporation, and the Thermal Infrared Sensor (TIRS), built by NASA's Goddard Space Flight Center. Together they capture 11 spectral bands spanning coastal aerosol, visible light, near-infrared, shortwave infrared, cirrus, and thermal wavelengths, giving Landsat 8 far more analytical depth than the 8-bit sensors carried by Landsat 1 through 7.
Landsat 8 data has been freely available from first light, and XRTech Group sources, processes, and delivers it in analysis-ready form so you can download Landsat 8 imagery matched to your exact area of interest, date range, and band requirements.
Resolution of Landsat 8: OLI and TIRS Explained
The resolution of Landsat 8 depends on which instrument and band captured the scene. Understanding this is essential before you download Landsat 8 imagery for analysis.
| Panchromatic (Landsat 8 Band 8) | 15m, via the Operational Land Imager (OLI) |
| Multispectral (OLI) | 30m across coastal, visible, NIR, SWIR, and cirrus bands |
| Thermal (TIRS) | 100m native, resampled to 30m for delivery consistency |
| Radiometric Resolution | 12-bit dynamic range, scaled to 16-bit in Level-1 products (4,096 possible grey levels vs. 256 on Landsat 1–7) |
| Positional Accuracy | 12–15m at nadir |
This improved radiometric resolution is one of the most important upgrades in the Landsat program's history. A higher dynamic range means better signal-to-noise performance, which translates directly into more reliable land cover classification from every Landsat 8 image, even in low-contrast or shadowed scenes.
Landsat 8 Band 8 and the Full OLI / TIRS Band Reference
Landsat 8 carries nine OLI bands, including Landsat 8 Band 8, the sharp 15m panchromatic channel used for pan-sharpening and fine feature identification, plus two thermal bands from TIRS.
| Band | Spectral Range | Resolution |
|---|---|---|
| Band 1 — Coastal Aerosol | 0.43–0.45 µm | 30 m |
| Band 2 — Blue | 0.45–0.51 µm | 30 m |
| Band 3 — Green | 0.53–0.59 µm | 30 m |
| Band 4 — Red | 0.64–0.67 µm | 30 m |
| Band 5 — Near-Infrared | 0.85–0.88 µm | 30 m |
| Band 6 — SWIR 1 | 1.57–1.65 µm | 30 m |
| Band 7 — SWIR 2 | 2.11–2.29 µm | 30 m |
| Band 8 — Panchromatic (PAN) | 0.50–0.68 µm | 15 m |
| Band 9 — Cirrus | 1.36–1.38 µm | 30 m |
| Band 10 — TIRS 1 (Thermal) | 10.60–11.19 µm | 100 m |
| Band 11 — TIRS 2 (Thermal) | 11.50–12.51 µm | 100 m |
Why Landsat 8 Band 8 Matters for Analysis
Landsat 8 Band 8 is the panchromatic channel, and it's the sharpest resolution available on the satellite at 15m. On its own it captures grayscale detail, but it's most valuable when pan-sharpened together with the 30m multispectral OLI bands, producing a color composite Landsat 8 image with more visual detail than the multispectral bands alone can provide. This makes Band 8 especially useful for feature identification, fine boundary mapping, and visual interpretation tasks.
How to Download Landsat 8 Satellite Data
Every Landsat 8 image is processed to standard Level-1 data product specifications. Products are scaled to 55,000 grey levels and can be rescaled to Top of Atmosphere (TOA) reflectance or radiance using the coefficients provided in each scene's metadata file.
| Archive Coverage | February 2013 to present, updated continuously |
| Scene Size | 185 × 180 km |
| Delivery Format | Level-1 standard products, analysis-ready |
| Early Data Note | Pre-WRS-2 scenes (Feb 11 – Apr 10, 2013) are TIRS-only and geometrically consistent, with spatial resolution within ±1% of later data |
Applications for Landsat 8 Satellite Imagery
Agriculture
The rich historical archive of Landsat 8 imagery and the satellite's regular revisit cycle provide essential data for seasonal and long-term agricultural monitoring.
- Crop condition analysis: monitor crop health and stress using vegetation indices across the growing season.
- Yield prediction support: analyze vegetation trends and compare past seasons to estimate productivity.
- Soil moisture estimation: assess wetness indicators indirectly through surface reflectance signals.
- Irrigation planning: identify water-stressed fields and optimize water use across large farming areas.
- Field boundary mapping: distinguish field extents for crop classification and land use planning.
Construction and Urban Planning
Landsat 8 satellite data enables effective urban development tracking and city design planning over extended periods.
- Urban expansion detection: analyze sprawl and land cover change with historical Landsat data.
- Infrastructure development monitoring: detect changes in built-up areas and construction progress.
- Environmental impact analysis: track vegetation loss, soil sealing, and water body changes near urban zones.
- Urban heat island monitoring: use thermal data to analyze temperature anomalies in dense city environments.
- Pre-development site assessment: evaluate terrain and surrounding land cover before construction begins.
Environmental and Climate Change
Landsat 8 imagery for view and download supports comprehensive environmental monitoring, from ecosystem health to climate-related transformations.
- Forest monitoring: detect deforestation, reforestation, and wildfire damage over large areas.
- Wetland and water body monitoring: observe water levels, turbidity, and seasonal wetland changes.
- Climate impact analysis: monitor glaciers, snow cover, desertification, and vegetation shifts.
- Disaster damage mapping: assess flood, drought, or wildfire extent to support emergency response.
- Biodiversity habitat assessment: map critical ecosystems to support conservation and protected areas.
Extract Meaningful Insights from Landsat 8 Satellite Imagery
Indices & Band Combinations
Choose from 20+ built-in indices and band combinations across every Landsat 8 band to assess vegetation, soil, and environmental disturbance, or build custom indices for specific goals.
Change Detection
Monitor changes in land features by comparing multiple Landsat 8 satellite images taken at different times, supporting urban development, ecological, and disaster-response analysis.
Time Series Analysis
Generate spatiotemporal graphs across your AOI to detect landscape change, vegetation cycles, and human impact using Landsat 8 data spanning more than a decade.
Full Technical Specifications
Sensor & Coverage
| Provider | NASA / United States Geological Survey (USGS) |
| Instruments | Operational Land Imager (OLI) & Thermal Infrared Sensor (TIRS) |
| Spectral Bands | 11 total (9 OLI + 2 TIRS) |
| Swath Width | 185 km at nadir |
| Scene Size | 185 × 180 km |
| Daily Coverage | ~185,000 km² |
| Stereo Imaging | Not available |
Orbit & Spacecraft
| Orbit Type | Sun-synchronous, near-polar |
| Altitude | 705 km |
| Repeat Cycle | 16 days |
| Manufacturer | Orbital Science Corporation |
| Mass | 2,071 kg (4,566 lbs), fully fueled |
| Data Recorder | 3.14 terabit solid-state recorder |
| Downlink Rate | 384 Mbps (X-band), 260.92 Mbps (S-band) |
| Launch Date | February 11, 2013 |
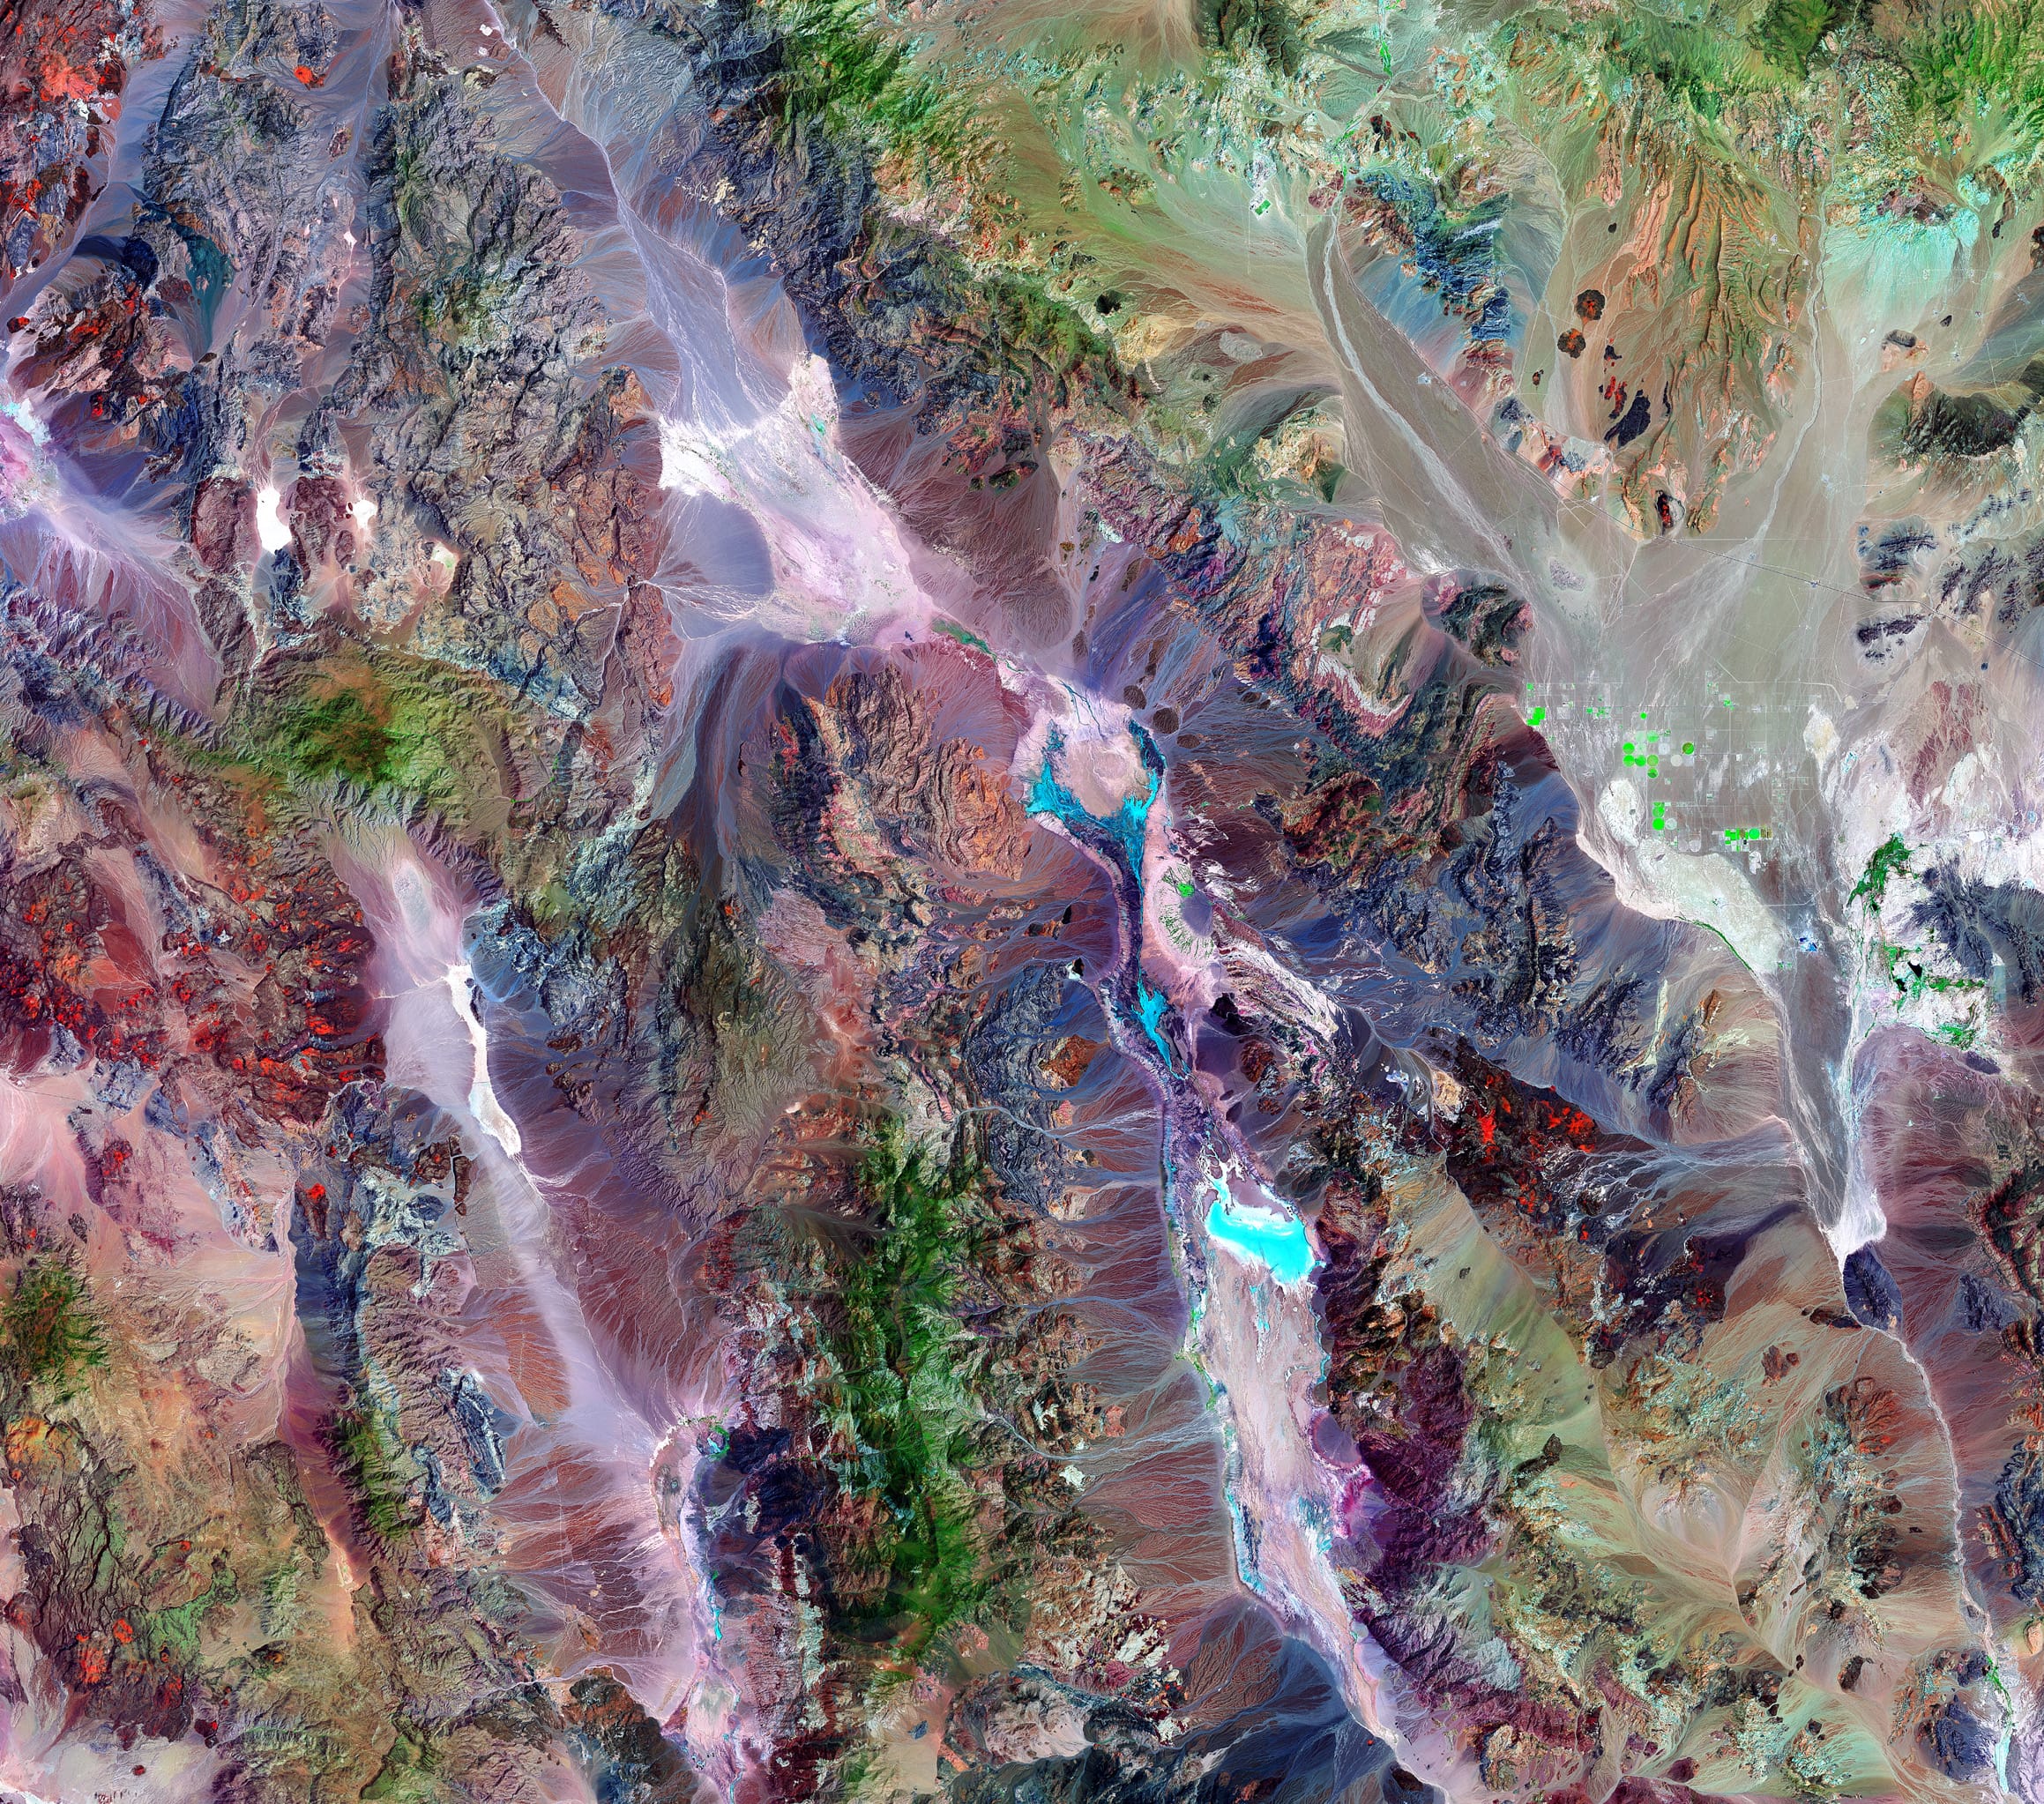
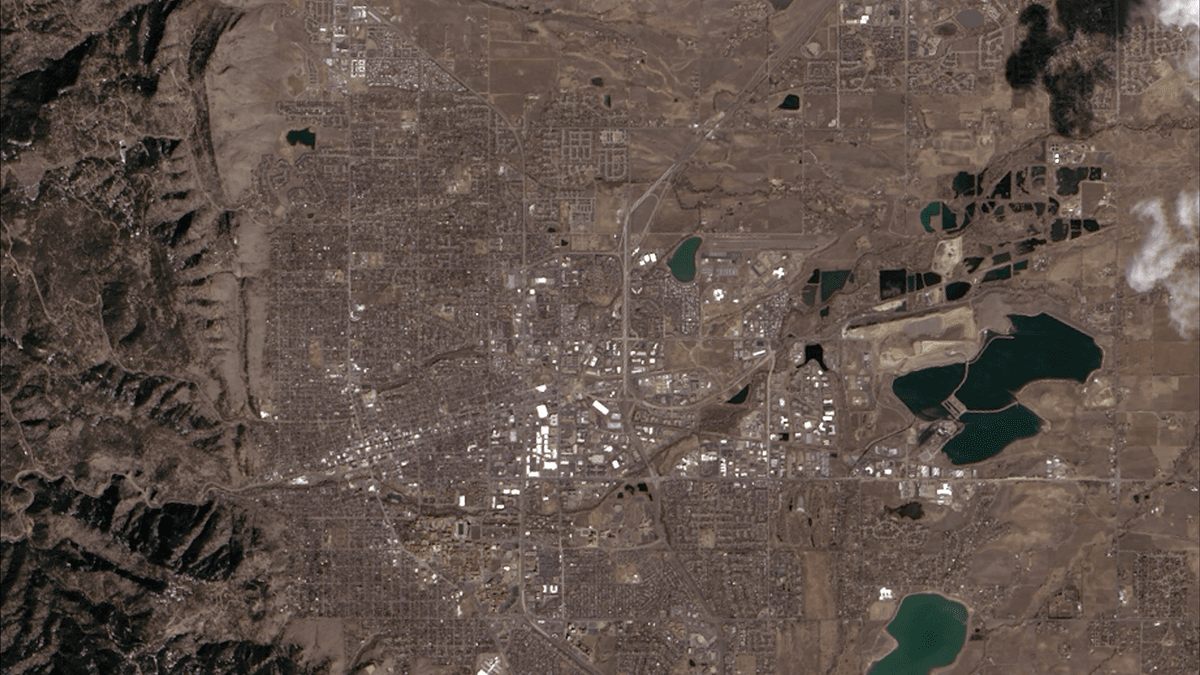
Landsat 8 Satellite Image Samples
Key Features and Benefits of the Landsat 8 Satellite
- Cost-Effective, Open DataLandsat 8 imagery is freely available under an open data license, ideal for widespread geospatial analysis without licensing costs.
- Wide 185km SwathLarge-area coverage in a single pass reduces the number of scenes needed for regional and national-scale monitoring.
- Thermal Infrared SensorCaptures temperature variations, aiding urban heat island studies, wildfire monitoring, and drought assessment.
- Part of a 50+ Year ArchiveContinuity with the Landsat program's full historical record supports tracking land surface change back to 1972.
End-to-End Support to Download Landsat 8 Data
Expert Consultation
Our geospatial specialists help you choose the right Landsat 8 band combination, including Band 8 pan-sharpening, for your analysis.
Rapid Delivery
Direct access to a 130+ satellite constellation network, including the ongoing Landsat 8 archive, for faster turnaround.
Seamless Integration
Landsat 8 images delivered in industry-standard formats, ready for your GIS, CAD, or modeling workflow.
Common Questions About Landsat 8
Is Landsat 8 still active?
Yes. Landsat 8 remains operational, well past its original 5-year design life, with an extended mission currently projected into 2028. New Landsat 8 images are added to the archive continuously.
What is the resolution of Landsat 8?
15m for the panchromatic Band 8, 30m for the multispectral OLI bands, and 100m for the native thermal TIRS bands, resampled to 30m for delivery.
What is Landsat 8 Band 8 used for?
Band 8 is the panchromatic channel at 15m resolution, the sharpest on the satellite. It's most useful when pan-sharpened with the 30m multispectral bands for higher-detail color composites.
How do I download Landsat 8 satellite data?
XRTech Group sources, processes, and delivers Landsat 8 imagery matched to your AOI, date range, and preferred bands, in analysis-ready formats for GIS and remote sensing software.
Is Landsat 8 imagery free to use?
Yes. Landsat 8 data has been freely available from first light under an open data policy. XRTech Group handles sourcing, processing, and delivery of this data for your project.
Ready to Download Landsat 8 Satellite Data?
Talk to our geospatial team about band selection, resolution needs, and delivery for your area of interest.