Quick Answer
Vegetation indices are mathematical formulas applied to satellite spectral data that measure plant health, canopy density, chlorophyll content, and water stress without physical field visits. Each index uses a different combination of spectral bands to target a specific aspect of crop condition. NDVI is the most common. EVI, NDRE, SAVI, GNDVI, LAI, and CWSI each solve specific problems NDVI cannot.
What Are Vegetation Indices?
A vegetation index is a number. It comes from dividing, subtracting, or combining reflectance values from two or more satellite bands in a way that amplifies the signal from vegetation while suppressing noise from soil, atmosphere, and water.
Plants interact with light in a predictable way. They absorb red light for photosynthesis and reflect near-infrared (NIR) light strongly through their leaf cell structure. When a plant is stressed, diseased, or dying, that NIR reflectance drops and red reflectance rises. The ratio between these two signals is the basis of most vegetation indices.
The challenge is that real satellite imagery is never clean. Aerosol haze, soil brightness, cloud shadows, and canopy geometry all distort the signal. Different indices correct for these problems in different ways, which is why no single index serves every situation.
Why Use Multiple Vegetation Indices?
NDVI tells you whether a crop is green. It does not tell you whether the crop is nitrogen-deficient, water-stressed, or at risk from a fungal outbreak. For that level of precision, you need indices built for those specific signals.
Running a suite of indices across the same imagery gives agronomists a complete picture: canopy density, chlorophyll levels, water status, nitrogen availability, and soil-adjusted biomass all derived from a single satellite pass.
Primary Vegetation Indices
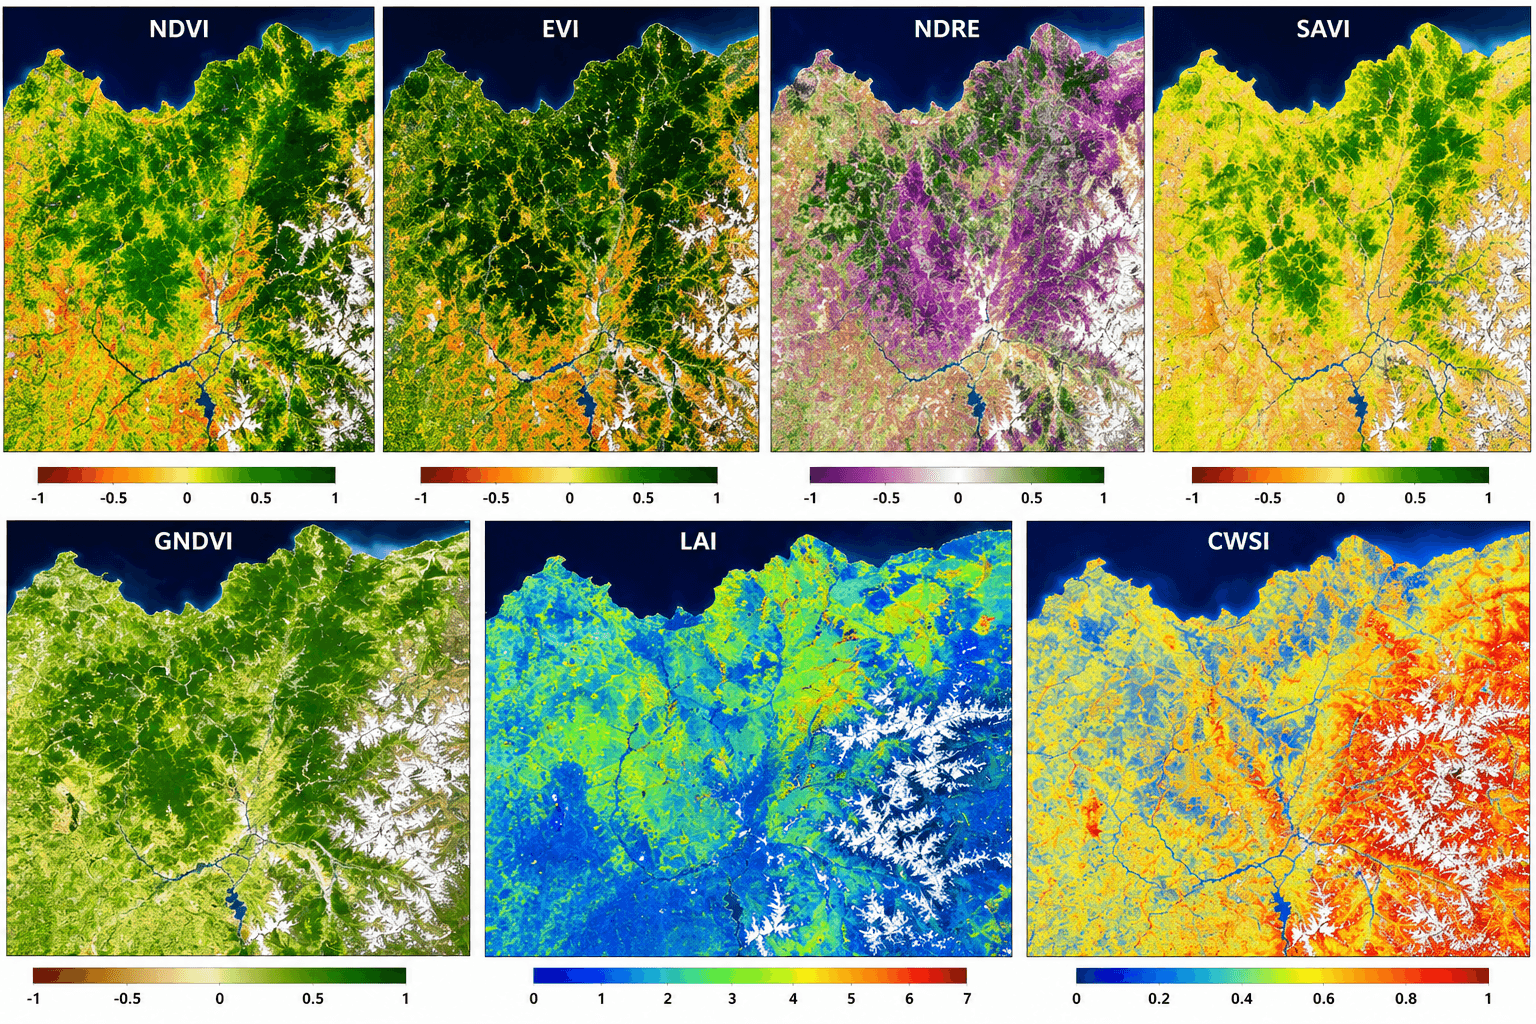
NDVI: Normalized Difference Vegetation Index
Formula: NDVI = (NIR – Red) / (NIR + Red)
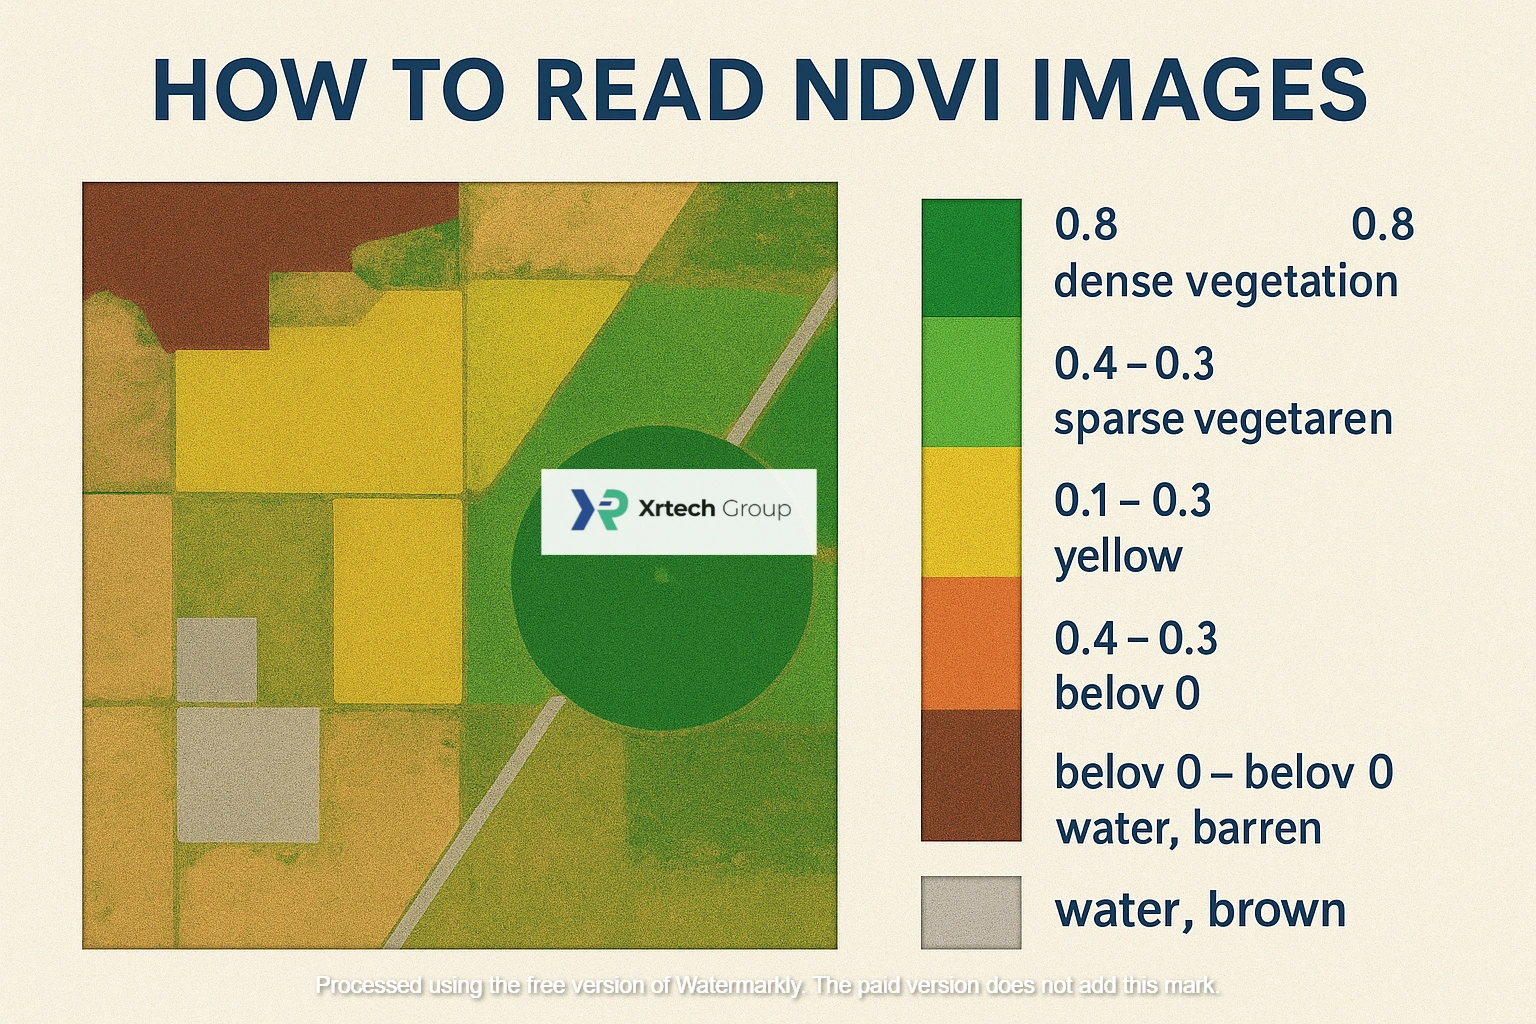
NDVI is the most widely used vegetation index in remote sensing. It measures photosynthetically active biomass by comparing the NIR reflectance that healthy leaves produce against the red light they absorb.
NDVI values range from -1 to +1. Healthy, actively growing crops typically fall between 0.4 and 0.8. Bare soil sits near 0. Water bodies produce negative values.
When to use NDVI: NDVI performs best during mid-season at the stage of active crop growth. It is reliable for general crop development monitoring, yield prediction, and large-area land cover classification.
XRTech application: XRTech uses NDVI across its full satellite fleet for county-level yield prediction with up to 85% accuracy. Supported satellites include SuperView Neo-1, SuperView-1, GF-7, GF-2, GF-6, GF-1, and ZY-3.
NDVI limitations to know: NDVI saturates in high-biomass areas. Once a dense canopy reaches full cover, additional greenness does not increase the NDVI value. It is also sensitive to soil brightness in areas with sparse vegetation and to atmospheric aerosols. EVI, SAVI, and ARVI were developed specifically to address these problems.
EVI: Enhanced Vegetation Index
Formula: EVI = 2.5 × (NIR – Red) / (NIR + 6 × Red – 7.5 × Blue + 1)
EVI was developed to correct the two main weaknesses of NDVI: atmospheric interference and canopy saturation. It adds the blue spectral band to filter aerosol scattering and includes a canopy background adjustment factor (L = 1) to reduce soil noise.
EVI values range from -1 to +1. Healthy dense vegetation typically falls between 0.2 and 0.8.
Coefficient breakdown:
- G = 2.5 (gain factor)
- C1 = 6 (aerosol resistance, red band)
- C2 = 7.5 (aerosol resistance, blue band)
- L = 1 (canopy background adjustment)
When to use EVI: Use EVI in high-biomass environments where NDVI saturates, such as dense tropical forests, mature wheat and corn belts, and rainforest monitoring zones. EVI is also the better choice in any region with frequent haze, smoke, or atmospheric aerosol that would distort NDVI readings.
XRTech application: EVI is calculated from XRTech’s multispectral satellites that capture all three required bands. SuperView Neo-1 delivers EVI-ready data at 0.3 m resolution with daily global revisit. SuperView-2 adds Purple (400–450 nm) and Yellow bands for further atmospheric refinement beyond the standard EVI formula.
NDRE: Normalized Difference Red Edge Index
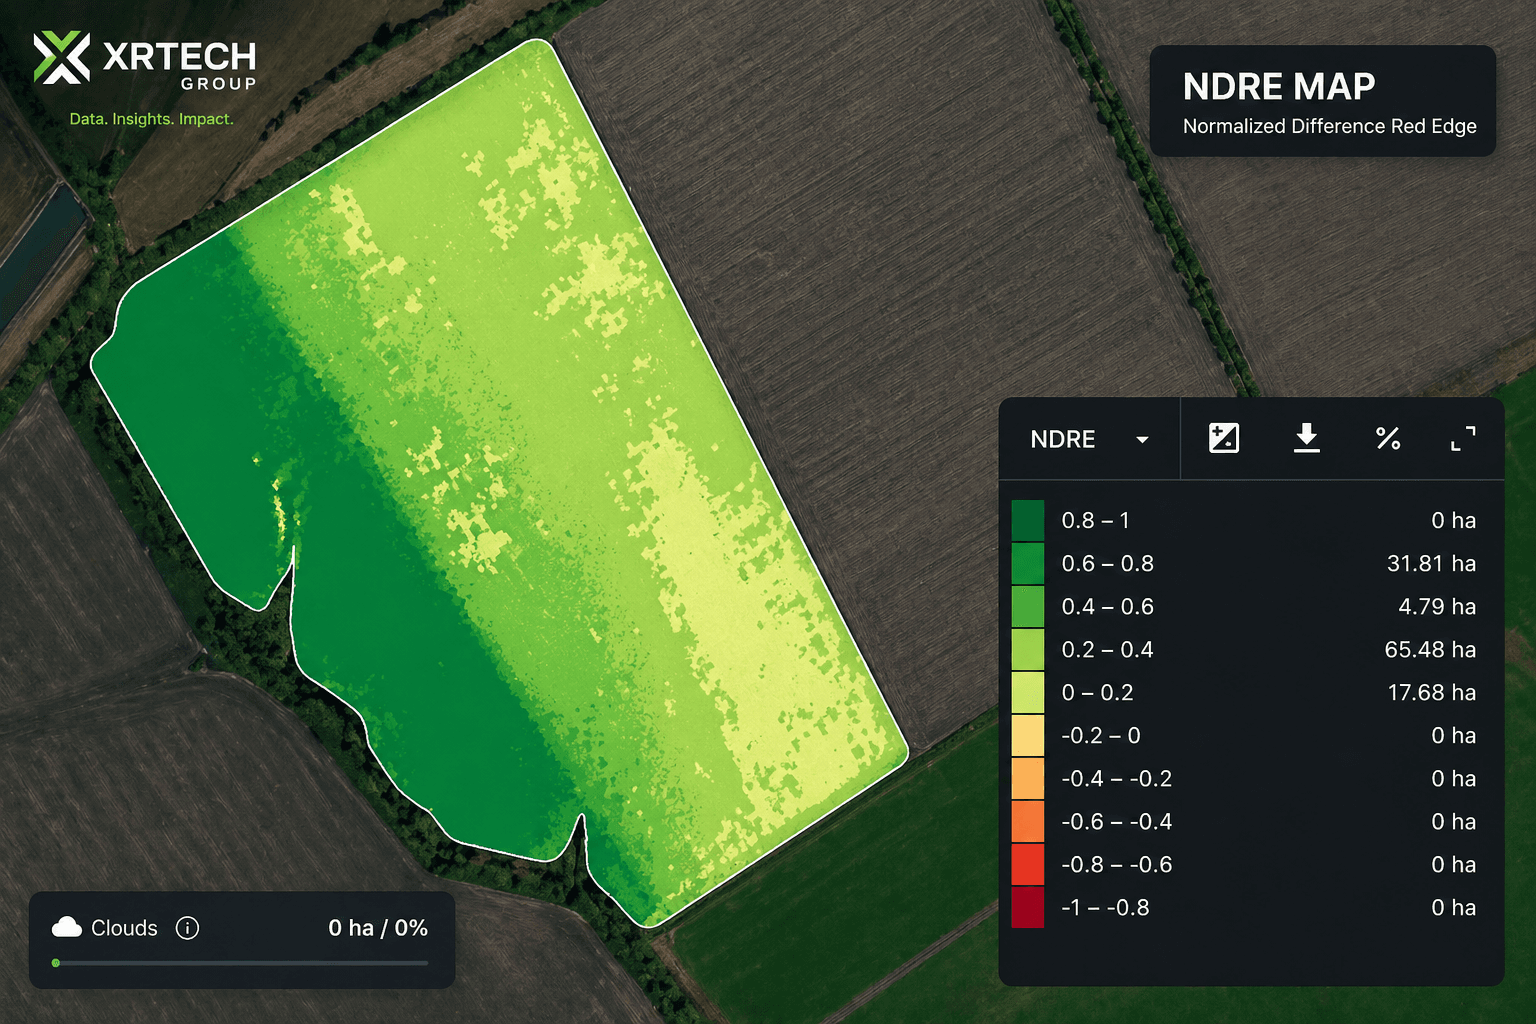
Formula: NDRE = (NIR – Red Edge) / (NIR + Red Edge)
NDRE uses the Red Edge band (690–770 nm) instead of the standard red band. The Red Edge region sits at the boundary between visible red and near-infrared light and is one of the most sensitive spectral zones for detecting chlorophyll content and leaf structure.
When to use NDRE: NDRE is most effective at mid to late season when crop canopies are mature and NDVI has saturated. It excels at detecting early signs of nitrogen deficiency and stress that are not yet visible to the naked eye. NDRE is more accurate than NDVI for monitoring high-density canopy cover.
XRTech application: NDRE is available through XRTech’s SuperView-2 and GF-6 satellites, both equipped with the Red Edge band. When used alongside EVI data, Red Edge models achieve crop classification accuracies above 90%.
GNDVI: Green Normalized Difference Vegetation Index
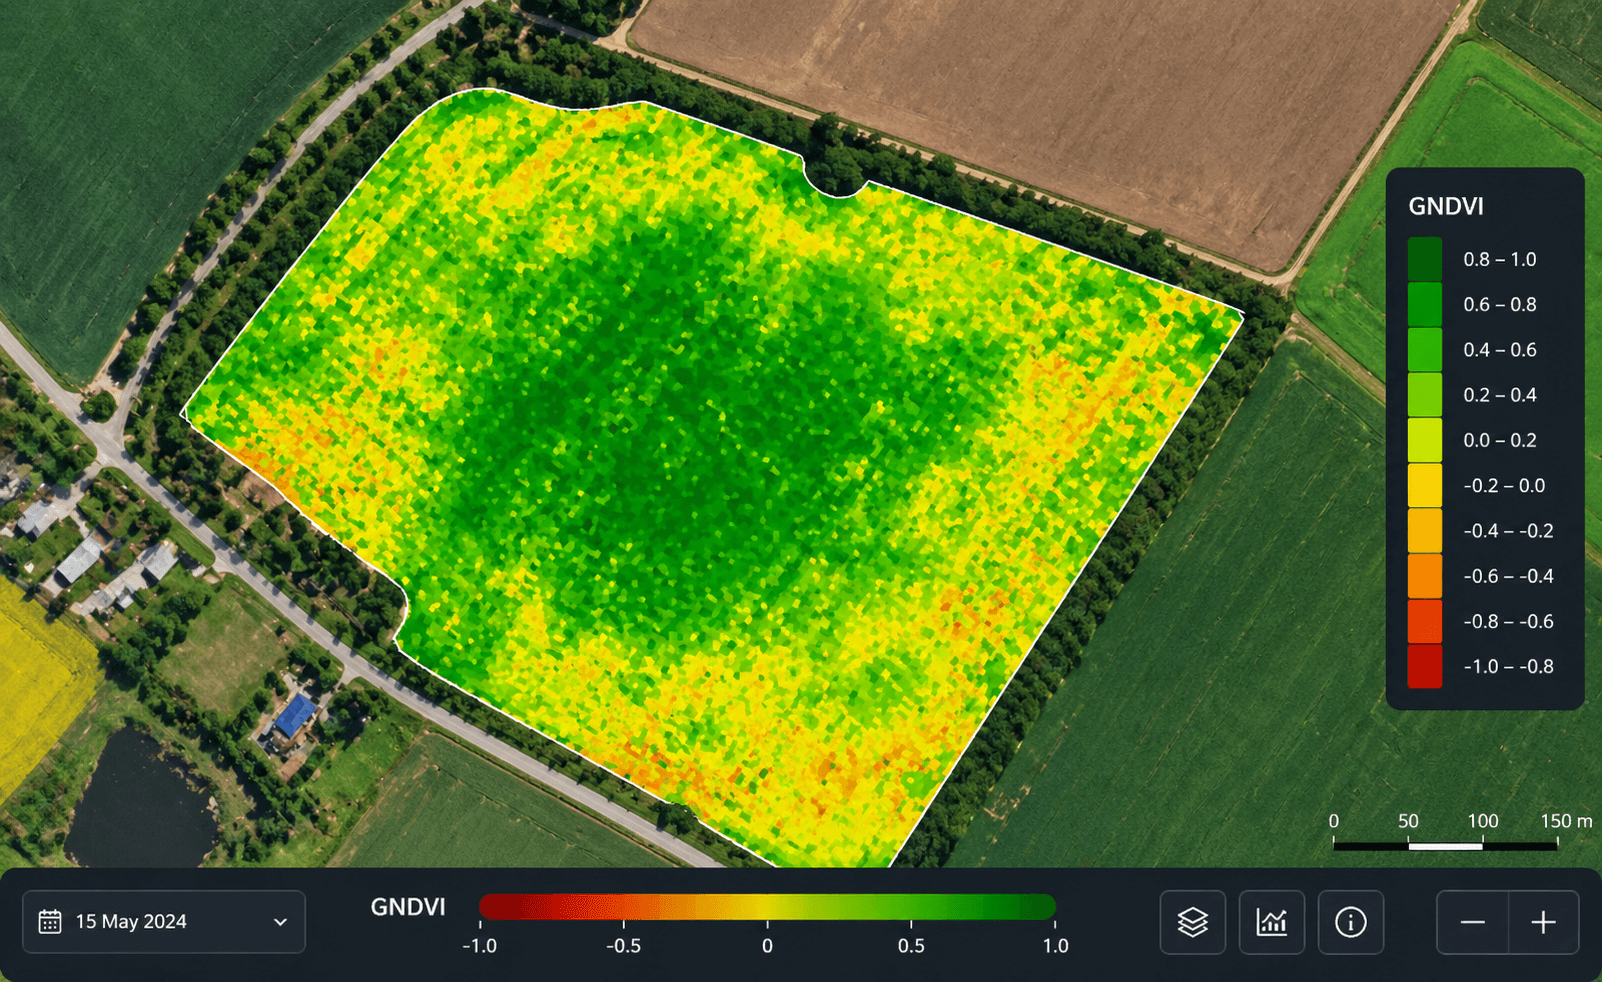
Formula: GNDVI = (NIR – Green) / (NIR + Green)
GNDVI replaces the red band in NDVI with the green band (540–570 nm). Green light is more sensitive to chlorophyll concentration than red light, making GNDVI a better tool for assessing plant health in the middle to late stages of growth when chlorophyll content varies significantly across a field.
When to use GNDVI: GNDVI is the preferred index for detecting wilted or aging crops and for measuring nitrogen content in leaves when an extreme red channel is not available. It is particularly effective for monitoring vegetation with dense canopies or at maturity stages where NDVI has plateaued.
XRTech application: GNDVI is derived from XRTech multispectral imagery capturing green, NIR bands at high resolution.
Soil-Corrected Vegetation Indices
When crop cover is thin, the soil beneath the canopy reflects strongly and distorts standard NDVI readings. These indices correct for that interference.
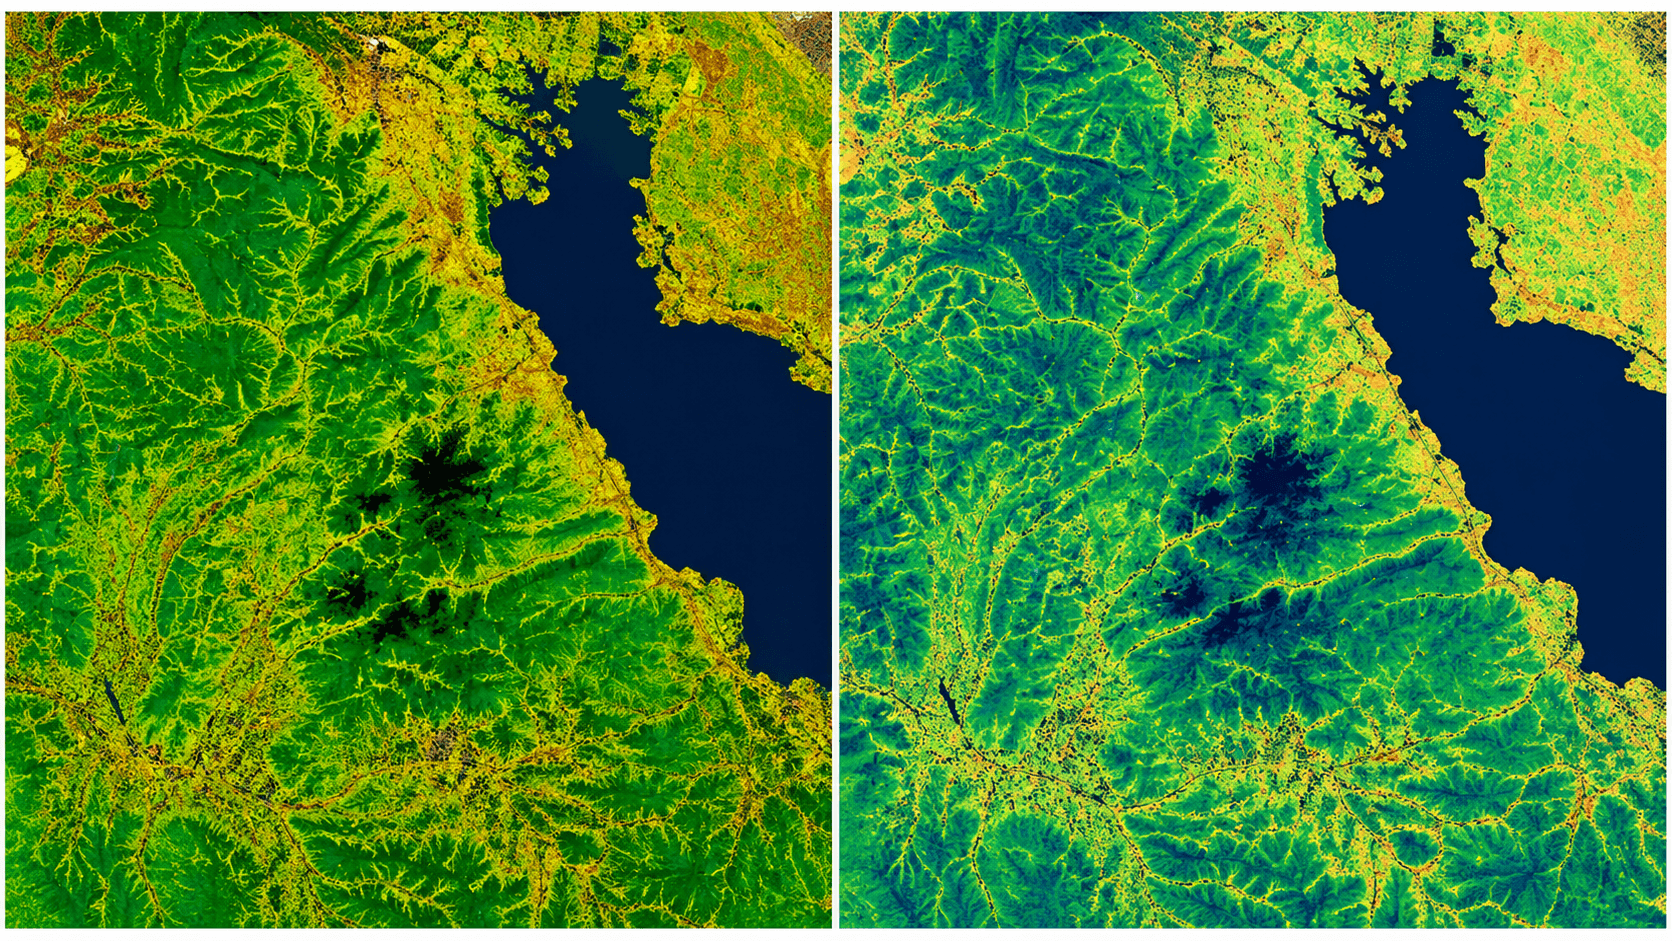
SAVI: Soil-Adjusted Vegetation Index
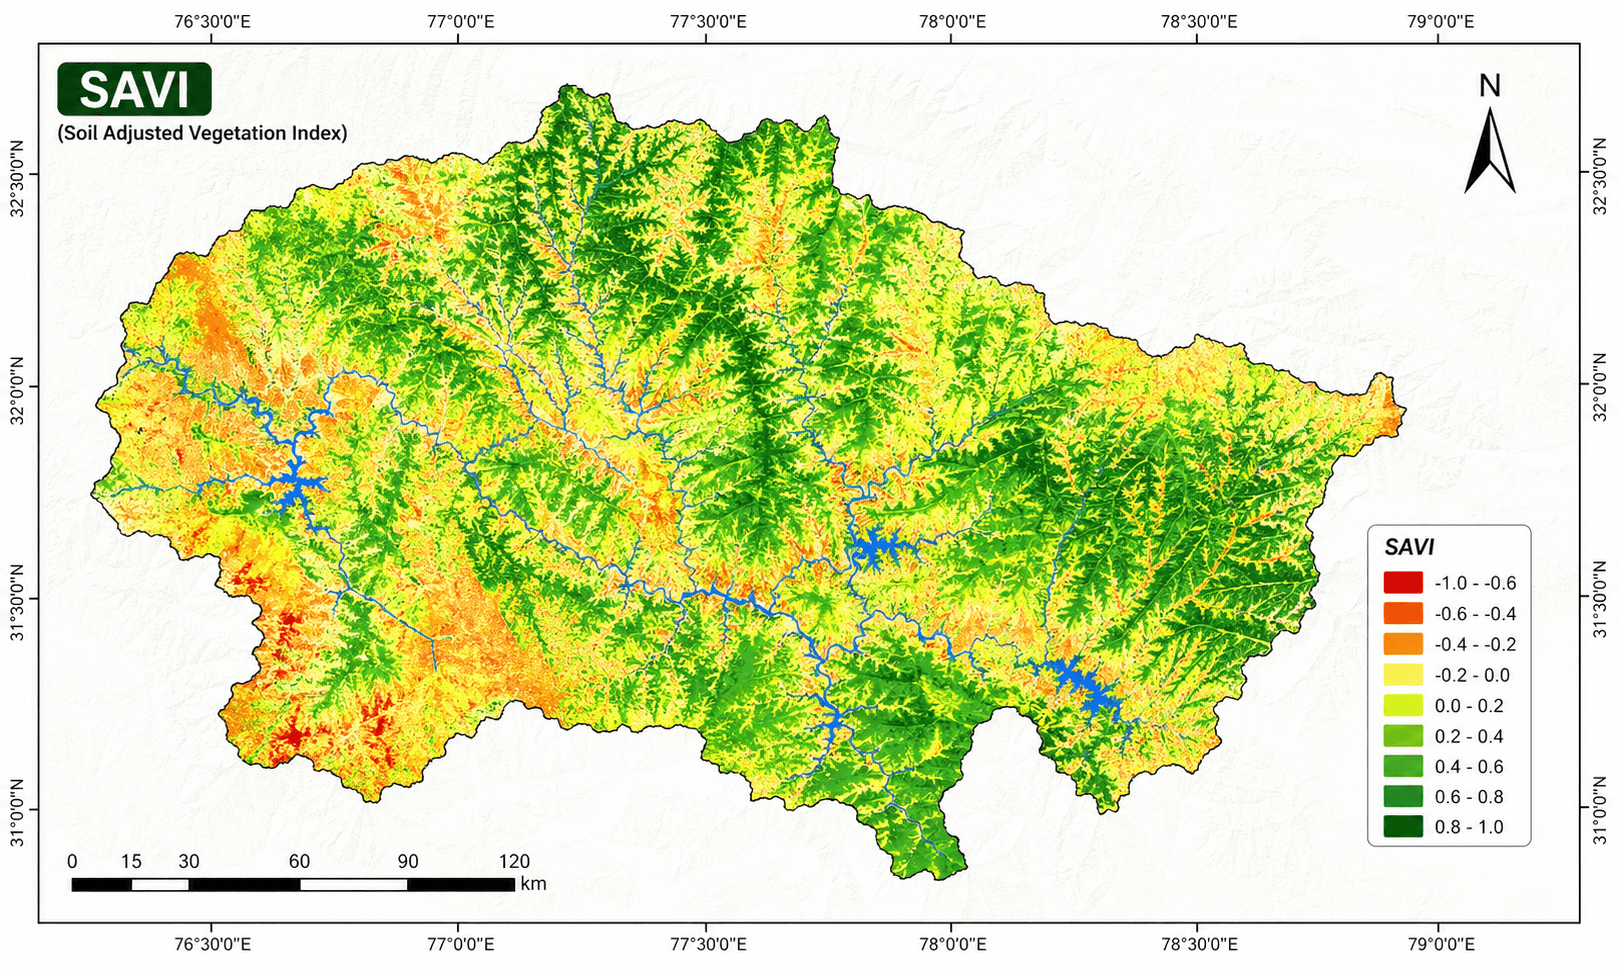
Formula: SAVI = ((NIR – Red) / (NIR + Red + L)) × (1 + L)
SAVI adds a soil adjustment factor L to the NDVI formula to correct for soil brightness, color, moisture variability, and regional soil differences. L typically ranges from 0 to 1, where L = 0 is equivalent to NDVI (used in dense canopy), and L = 1 is used for very sparse vegetation. The standard value of L = 0.5 works for most land covers.
When to use SAVI: SAVI is best for areas with sparse vegetation cover where bare soil is exposed, including early-season crop fields, arid and semi-arid agricultural zones, and fields with less than 15% total vegetation cover.
OSAVI: Optimized Soil-Adjusted Vegetation Index
Formula: OSAVI = (NIR – Red) / (NIR + Red + 0.16)
OSAVI is a modified version of SAVI that uses a fixed canopy background adjustment factor of 0.16. This fixed value allows greater soil variation compared to SAVI when canopy cover is low and improves sensitivity when canopy cover exceeds 50%.
When to use OSAVI: OSAVI works well for monitoring areas with low-density vegetation where bare soil patches appear through the canopy, such as row crops in early growth stages or rangelands with patchy cover.
MSAVI: Modified Soil-Adjusted Vegetation Index
Formula: MSAVI = (2 × NIR + 1 – √((2 × NIR + 1)² – 8 × (NIR – Red))) / 2
MSAVI improves on SAVI by removing the need to set a fixed L value. Instead, the soil adjustment factor is calculated dynamically based on the actual NIR and red reflectance values. This makes MSAVI more accurate across a wider range of soil and vegetation conditions.
When to use MSAVI: MSAVI performs best at the very beginning of the crop production season when seedlings are just establishing and soil dominates the reflectance signal. It is the most reliable soil-corrected index when vegetation cover is extremely sparse.
Atmospheric-Corrected Vegetation Indices
ARVI: Atmospherically Resistant Vegetation Index
Formula: ARVI = (NIR – (2 × Red) + Blue) / (NIR + (2 × Red) + Blue)
ARVI was the first vegetation index designed to be insensitive to atmospheric factors such as aerosols, haze, and smoke. It corrects for atmospheric scattering by doubling the red spectrum measurement and adding the blue band, following the approach developed by Kaufman and Tanré.
ARVI is also more insensitive to relief effects than NDVI, making it particularly effective in mountainous regions affected by smoke from slash-and-burn agriculture.
When to use ARVI: Use ARVI in regions with high atmospheric aerosol content, including areas affected by industrial pollution, wildfire smoke, rain, fog, or dust. Tropical mountainous areas with frequent cloud and haze cover are ideal ARVI use cases.
Chlorophyll and Nitrogen Indices
NDRE: Normalized Difference Red Edge Index
(See Primary Vegetation Indices section above for full formula and detail.)
NDRE is the most direct satellite proxy for chlorophyll content in mature canopies and is the index most closely correlated with nitrogen status in crops.
ReCI: Red-Edge Chlorophyll Index
Formula: ReCI = (NIR / Red Edge) – 1
ReCI measures chlorophyll content in leaves nourished by nitrogen. Since chlorophyll content directly depends on nitrogen levels in plants, ReCI is highly responsive to variations in plant greenness and nitrogen status across a field.
When to use ReCI: ReCI is most useful at the stage of active vegetation development. It is effective for detecting areas with yellowing or shed foliage that signal nitrogen deficiency. ReCI is not suited for use during harvest season.
CCCI: Canopy Chlorophyll Content Index
CCCI combines Red Edge and NIR data to provide precision nitrogen and chlorophyll mapping across the crop canopy. It is used to generate detailed prescription maps for variable-rate nitrogen application by identifying where chlorophyll levels are falling below optimum.
When to use CCCI: CCCI is the standard index for nitrogen prescription mapping in high-value crops where input optimization directly affects profitability. It is typically applied at mid-season when canopy structure is uniform enough for reliable readings.
XRTech application: CCCI is derived from XRTech satellites equipped with the Red Edge band, specifically SuperView-2 and GF-6.
GCI: Green Chlorophyll Index
Formula: GCI = NIR / Green – 1
GCI estimates leaf chlorophyll content across various plant species by comparing green reflectance with NIR reflectance. The chlorophyll content captured by GCI reflects the physiological state of vegetation directly. It decreases in stressed plants, making it a reliable proxy for overall plant health.
When to use GCI: Use GCI to monitor the impact of seasonality, environmental stress, or applied treatments on vegetation health. GCI performs best with sensors that have broad NIR and green wavelengths.
NNI: Nitrogen Nutrition Index
NNI is a key tool for fertility management. It assesses the nitrogen status of crops by comparing actual nitrogen content against the minimum nitrogen required for maximum growth. This allows agronomists to identify exactly where nitrogen is limiting production and apply variable-rate fertilization only where it is needed.
When to use NNI: NNI is most effective during vegetative growth stages before nutrient deficiencies become visible. It works in combination with NDRE and CCCI to build a complete picture of field-level nitrogen status.
XRTech application: NNI-based fertilization targeting using XRTech imagery has demonstrated significant reductions in fertilizer input costs without sacrificing yield, as validated in agricultural projects across China’s major crop-producing regions.
Structural and Stress Indices
REIP: Red-Edge Inflection Point
REIP detects the exact point in the Red Edge spectrum where plant reflectance transitions from red to near-infrared. This inflection point shifts as chlorophyll concentration changes, making REIP one of the most sensitive indicators of early plant stress available from satellite data.
When to use REIP: REIP is used when the earliest possible detection of stress is the priority, before any visual symptoms appear on leaves. It is particularly effective for identifying the onset of drought stress, fungal infection, or mineral toxicity in high-value crops.
XRTech application: REIP is available from SuperView-2 and GF-6 imagery. Combined with CIRedEdge data, REIP-based models can detect crop stress up to 10 days earlier than traditional ground checks.
CIRedEdge: Red-Edge Chlorophyll Index
Key Band: Red Edge (690–770 nm)
CIRedEdge uses the specialized Red Edge spectral bands to detect early signs of drought stress and disease outbreaks with high sensitivity. It leverages the same spectral zone as NDRE and REIP but focuses specifically on chlorophyll changes associated with stress responses.
When to use CIRedEdge: Use CIRedEdge for early warning applications where detecting stress 7 to 10 days before visual symptoms appear is the goal. It is well-suited for precision scouting workflows where field visits are triggered by satellite alerts rather than scheduled.
SIPI: Structure Intensive Pigment Index
Formula: SIPI = (NIR – Blue) / (NIR – Red)
SIPI measures the ratio of carotenoids to chlorophyll in plant tissue. When chlorophyll degrades due to stress or disease, carotenoids become proportionally dominant, and SIPI values rise. An increasing SIPI value is a reliable early signal of crop disease.
When to use SIPI: SIPI is used for monitoring plant health in areas with high variability in canopy structure or LAI. It is effective for identifying early signs of crop diseases or other causes of stress before the damage is visible from ground level.
Water and Moisture Indices
NDWI: Normalized Difference Water Index
Formula: NDWI = (Green – NIR) / (Green + NIR)
NDWI was originally developed to identify open water bodies and assess their turbidity. In agricultural applications, it is used to detect flooded fields, map irrigation coverage, and identify wetlands and waterlogged soils.
NIR reflectance reveals dry matter content and internal leaf structure. When combined with the green band, NDWI captures variations in plant water content and soil moisture at field scale.
When to use NDWI: Use NDWI for detecting flooded agricultural land, allocating irrigation coverage across large areas, identifying wetlands, and monitoring drainage systems.
CWSI: Crop Water Stress Index
CWSI monitors irrigation needs and moisture levels at field scale. By identifying water stress in real time through thermal and spectral band combinations, CWSI enables precise irrigation management: apply water only where and when the crop needs it.
When to use CWSI: CWSI is most effective during vegetative and reproductive growth stages when water deficit has the greatest impact on yield. It is the primary index used in irrigation scheduling for high-value crops.
XRTech application: In the Henan Province case study, CWSI-driven monitoring identified drought stress 10 days earlier than traditional ground checks. Emergency irrigation triggered by CWSI alerts saved a significant portion of that season’s crop.
Canopy and Biomass Indices
LAI: Leaf Area Index
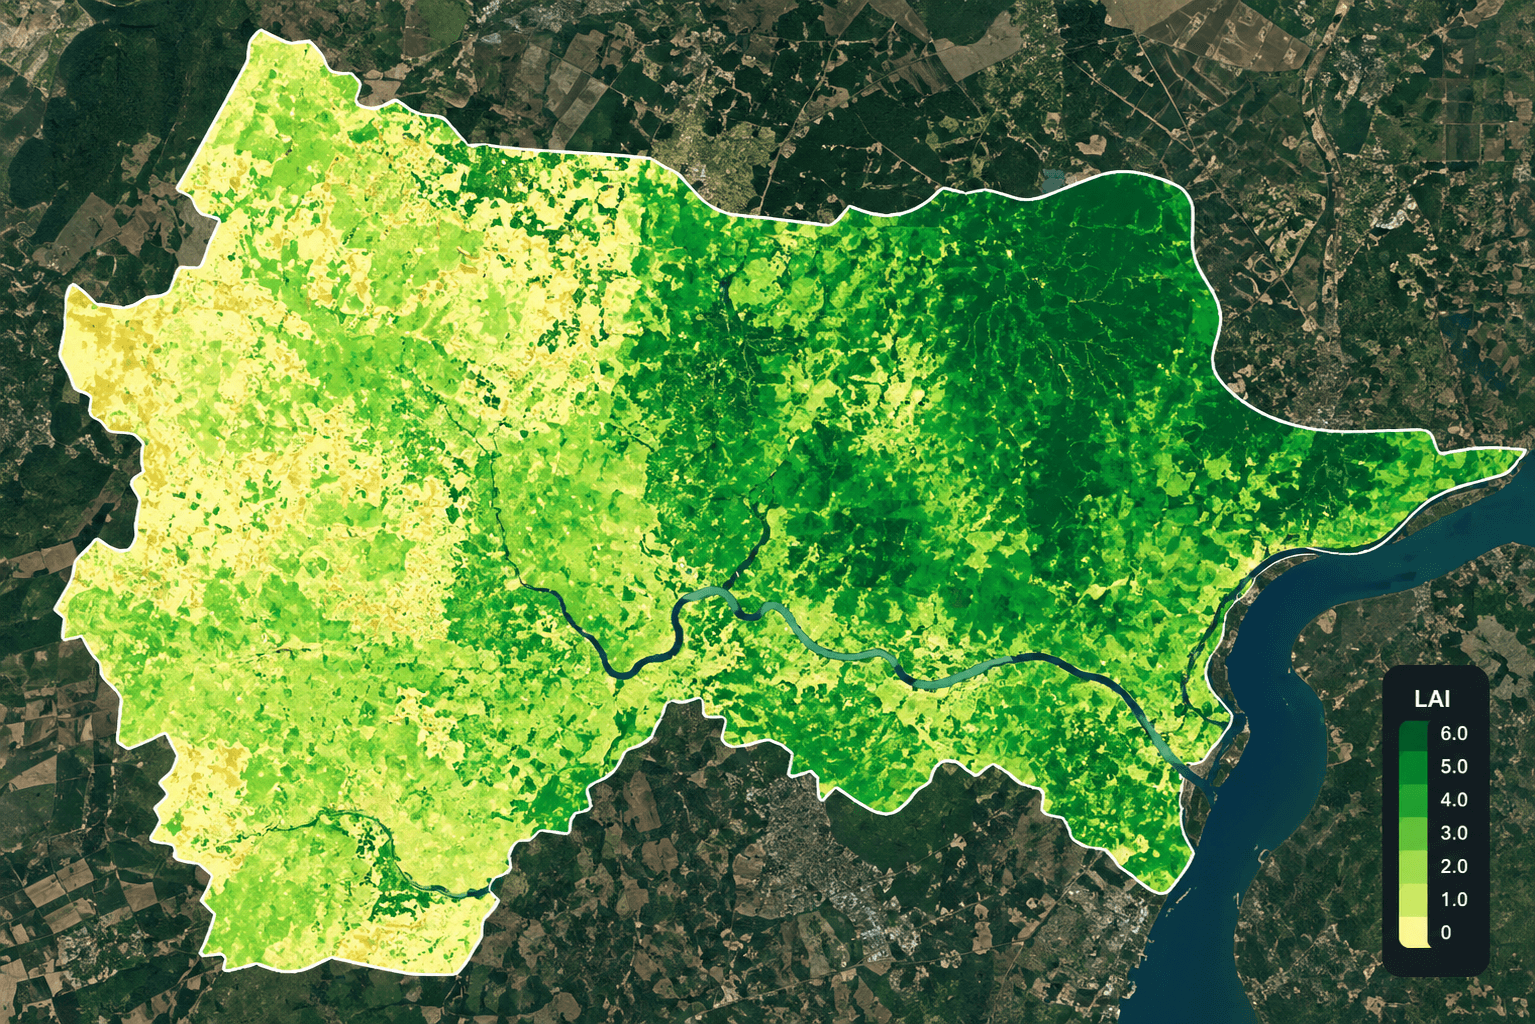
Formula: LAI = Leaf area (m²) / Ground area (m²)
LAI quantifies the total one-sided leaf area above a given ground surface area. It is a dimensionless number that directly measures canopy density and structural development. LAI = 3 means leaves cover the surface threefold. Values above 3.5 are considered high.
LAI is the most direct structural measure of crop and forest biomass. It is widely used as input data in crop productivity forecasting models and climate studies.
When to use LAI: Use LAI for vegetation health assessment, biomass estimation, input into productivity forecasting models, and monitoring carbon sequestration in forests. LAI values can saturate with cloud cover and bright objects, so imagery must be masked for data accuracy.
XRTech application: LAI is derived from XRTech multispectral imagery and is used in AI-assisted biomass and yield models. At county level, AI-integrated LAI analysis achieves yield predictions with up to 85% accuracy.
Fire and Snow Indices
NBR: Normalized Burn Ratio
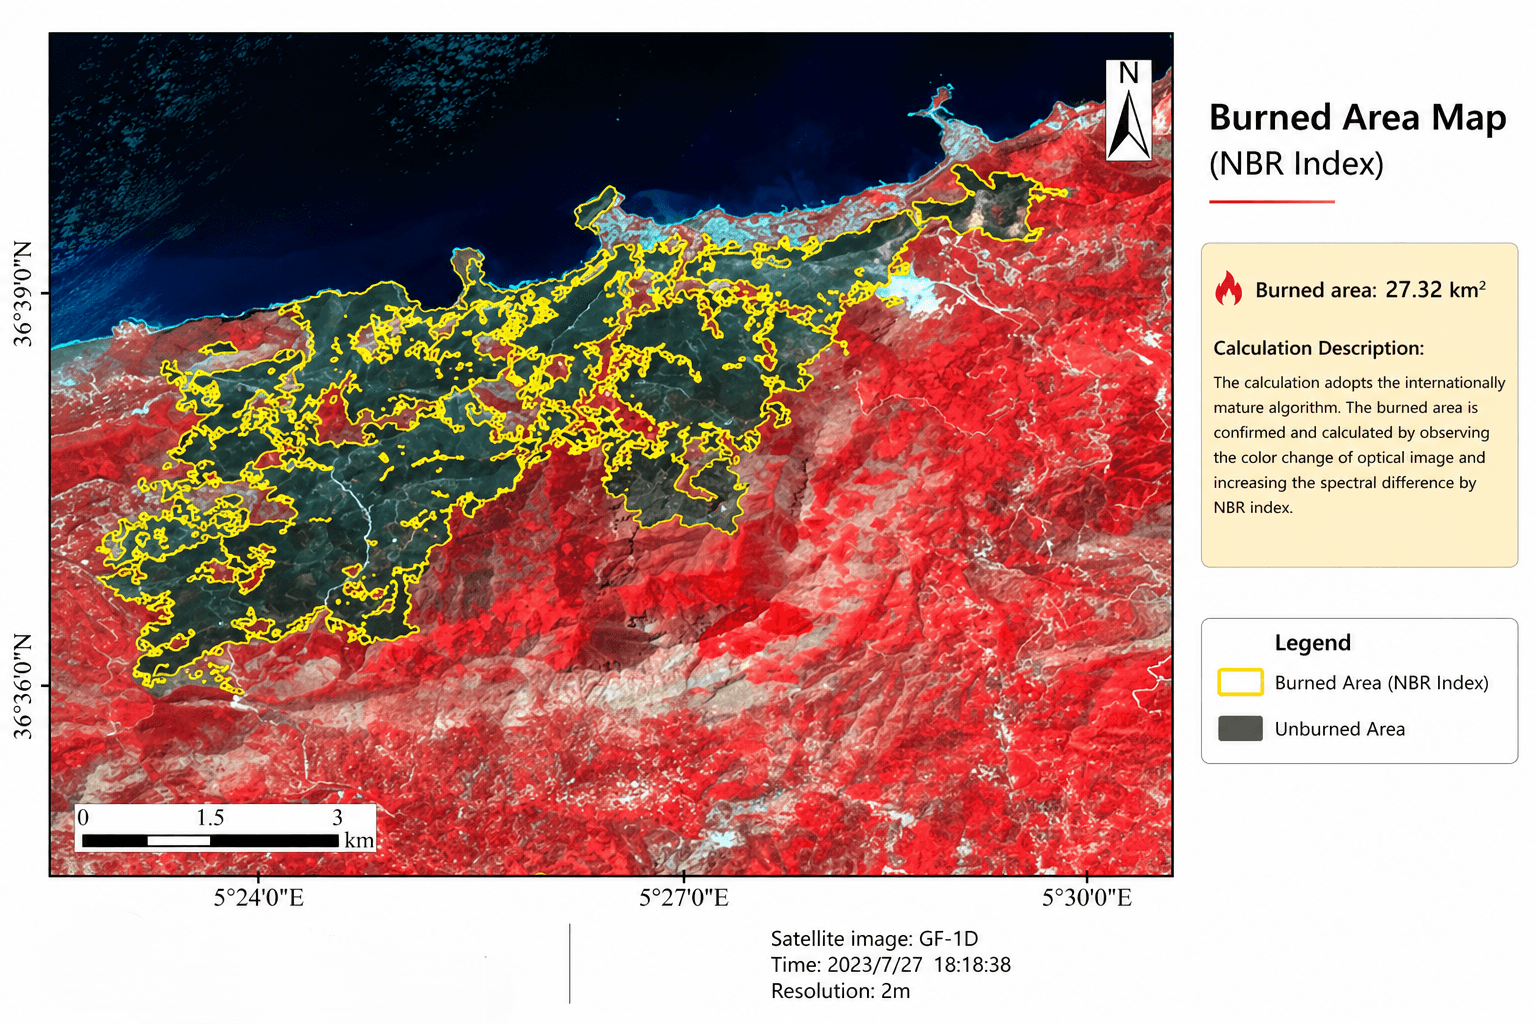
Formula: NBR = (NIR – SWIR) / (NIR + SWIR)
NBR identifies burned areas following wildfires. Healthy vegetation reflects strongly in NIR and weakly in SWIR. Recently burned vegetation reverses this pattern. NBR values range from +1 to -1.
When to use NBR: Use NBR for detection of active wildfires, post-fire burn severity analysis, and monitoring vegetation recovery following burns. NBR is increasingly critical as extreme weather conditions drive a significant rise in wildfires globally.
NDSI: Normalized Difference Snow Index
Formula: NDSI = (Green – SWIR1) / (Green + SWIR1)
NDSI detects snow cover using the high snow reflectance in the green band and low reflectance in SWIR, while distinguishing snow from clouds by their different spectral responses. NDSI is more accurate than Fractional Snow Cover (FSC) for snow mapping.
When to use NDSI: Use NDSI for snow cover mapping, differentiating between snow and cloud cover, and monitoring seasonal snowpack changes in water catchment areas.
VARI: Visible Atmospherically Resistant Index
Formula: VARI = (Green – Red) / (Green + Red – Blue)
VARI works entirely within the visible spectrum (red, green, blue bands), making it suitable for RGB or standard colour imagery. It enhances the vegetation signal under strong atmospheric conditions while smoothing illumination variations. The error rate for VARI vegetation monitoring across varying atmospheric thicknesses is less than 10%.
When to use VARI: Use VARI for crop state assessment when atmospheric sensitivity needs to be kept to a minimum, or when only visible-spectrum bands are available.
ISTACK: Index Stack
ISTACK combines NDVI, NDWI, and NDSI into a single merged image stack. Each landscape type is assigned a conventional colour: vegetation is green, bare soil and rock appear blue, and snow, clouds, ice, and water are attributed purple hues.
ISTACK enables automatic differentiation of diverse landscape features and supports image classification and quantitative analysis in a single pass.
When to use ISTACK: Use ISTACK for automatic land cover differentiation across large areas where vegetation, water, and snow all need to be classified simultaneously.