Satellite imagery has become one of the most powerful tools for understanding the world we live in. Governments use it to plan cities. Engineers rely on it to design infrastructure. Farmers depend on it to improve crop yields. Environmental teams use it to track climate change and land degradation. At the center of all these applications lies optical satellite imagery.
However, not all optical satellite imagery is the same. The type of imagery you choose directly affects accuracy, insight, and the quality of decisions you make. One of the most common sources of confusion in the geospatial industry is the difference between monochromatic, multispectral, and hyperspectral imagery.
Many projects fail to reach their full potential simply because the wrong imagery type was selected at the start. A sharp image may look impressive but lack analytical depth. A data rich image may contain valuable insights but be unsuitable for mapping or measurement.
This is where expertise matters.
XRTech Group works closely with governments, enterprises, and research organizations to help them choose the right satellite imagery for their exact needs. With access to a powerful constellation of more than 130 satellites through China Siwei, XRTech ensures that clients receive imagery that delivers both technical accuracy and practical value. Contact us Now!
This guide explains the differences between monochromatic, multispectral, and hyperspectral imagery in a clear and simple way so you can confidently select the right optical satellite data for your project.
What Is Optical Satellite Imagery
Optical satellite imagery refers to images captured by sensors that record sunlight reflected from the Earth’s surface. These sensors operate in the visible and near visible portions of the electromagnetic spectrum, including wavelengths the human eye cannot see.
In simple terms, optical satellites work like very advanced cameras in space. They collect light reflected from land, water, vegetation, and man made structures. That light is then converted into digital images that can be viewed, measured, and analyzed.
There are two key concepts that define optical imagery quality.
The first is spatial resolution. This refers to how detailed the image is on the ground. Higher spatial resolution means smaller objects can be seen clearly.
The second is spectral information. This refers to how many wavelengths of light are recorded. More wavelengths mean more information about surface materials and conditions.
Optical satellite imagery is widely used because it is intuitive, visual, and compatible with most mapping and analysis systems. It forms the foundation of urban planning, agriculture monitoring, environmental analysis, and infrastructure development worldwide.
What Is Monochromatic or Panchromatic Imagery
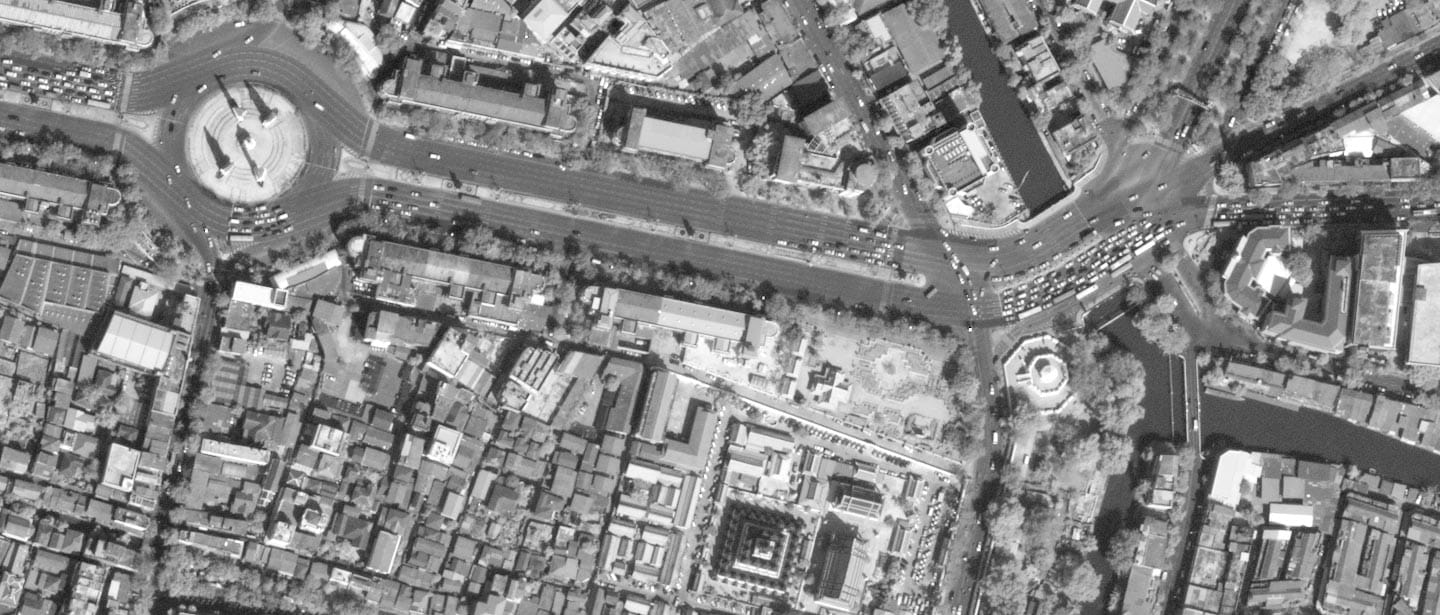
Monochromatic imagery, also known as panchromatic imagery, captures light in a single broad band of the visible spectrum. Typically, this band covers wavelengths from about 450 to 700 nanometers.
Because all available light is collected into one channel, panchromatic sensors can achieve extremely high spatial resolution. This means the images are very sharp and detailed.
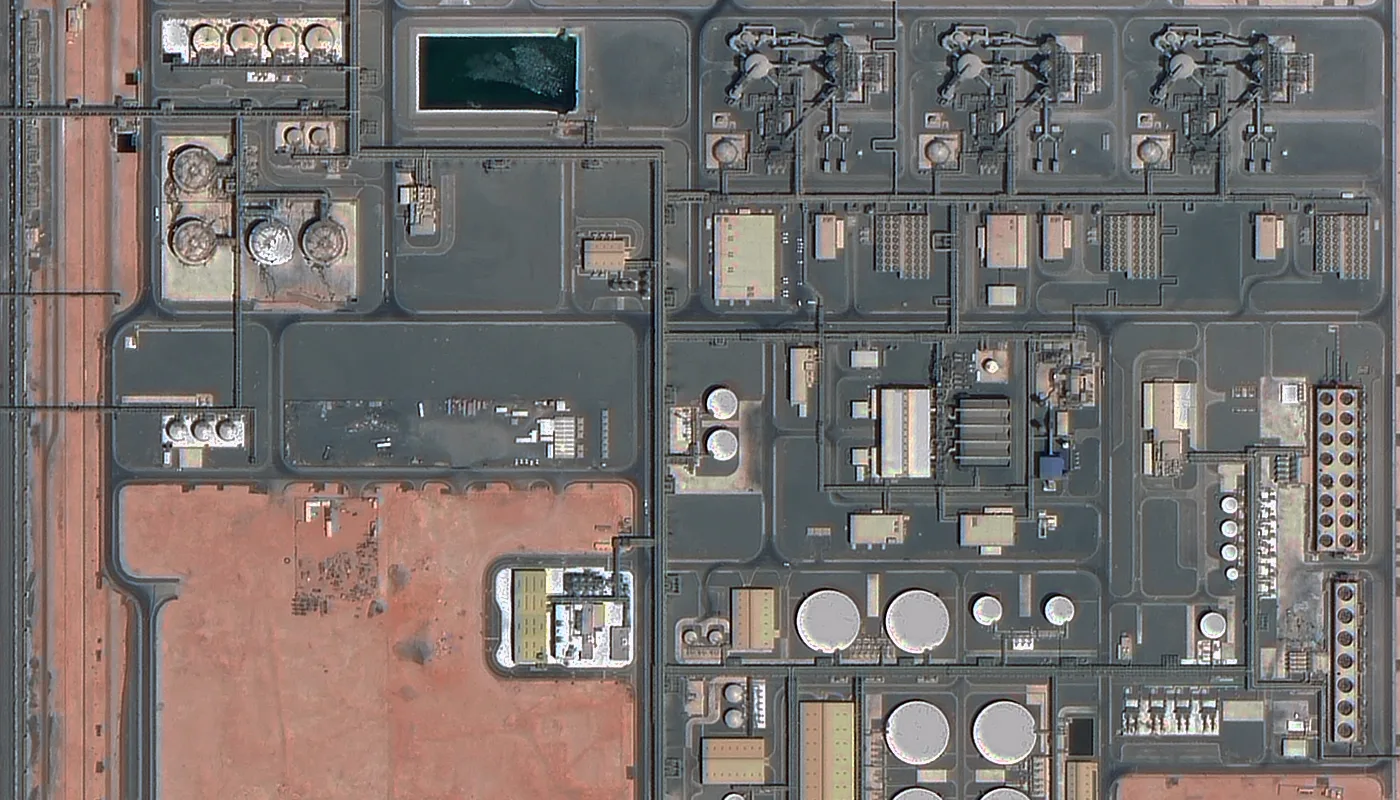
At XRTech Group, satellites like SuperView Neo 1 can deliver panchromatic imagery with resolution as fine as 0.3 meters. This level of detail allows you to clearly see building edges, road markings, vehicles, and small infrastructure elements.
Key Characteristics of Panchromatic Imagery
- Panchromatic imagery records one broad band of light
- It delivers the sharpest spatial resolution
- It appears in black and white
- It focuses on structure rather than color information
Advantages of Monochromatic Imagery
The primary advantage of panchromatic imagery is clarity. Fine details are visible with high precision. This makes it ideal for mapping, measurement, and visual interpretation.
Because the files are smaller, they are faster to process and easier to store. Orthorectification and alignment with GIS data are also straightforward.
Limitations of Monochromatic Imagery
Since panchromatic imagery only captures one band, it does not provide color or spectral information. This means it cannot detect vegetation health, moisture levels, or material composition.
Common Use Cases
- Urban planning and city mapping
- Infrastructure inspection and monitoring
- Disaster damage assessment
- Base maps for GIS and CAD systems
- Change detection where structure matters most
What Is Multispectral Imagery
Multispectral imagery captures data in multiple discrete bands. These typically include red, green, blue, and near infrared. Advanced multispectral sensors can include additional bands such as red edge, purple, yellow, and short wave infrared.
Multispectral imagery balances visual clarity with analytical power. While it is not as sharp as panchromatic imagery, it provides valuable information about surface conditions.
Satellites like SuperView 2 offer up to eight multispectral bands, making them highly effective for agriculture, environmental monitoring, and land use analysis.
Key Characteristics of Multispectral Imagery
Four to eight distinct spectral bands
Moderate spatial resolution usually between 0.5 and 2 meters
Includes visible and near infrared wavelengths
Provides color and surface condition insights
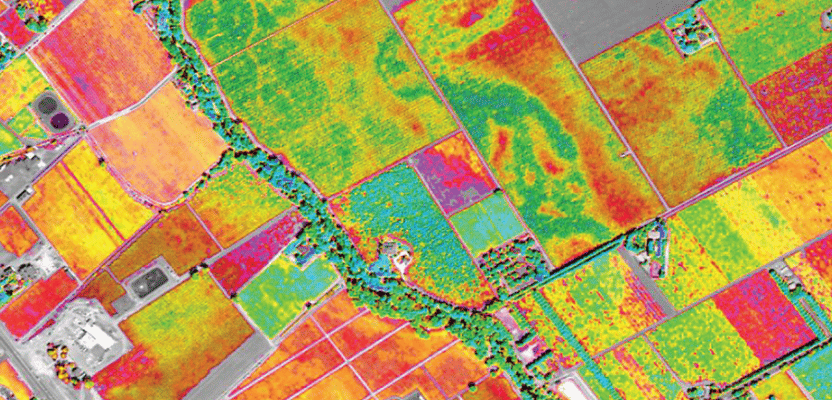
How Multispectral Data Reveals Surface Conditions
Healthy plants reflect near infrared light strongly. Stressed vegetation reflects less. Water absorbs infrared light. These differences allow multispectral imagery to detect patterns that cannot be seen in standard photographs.
This makes multispectral imagery essential for monitoring agriculture, forests, and water bodies.
Difference Between RGB and True Multispectral Data
Standard RGB images only show visible colors. Multispectral imagery includes invisible wavelengths that carry analytical value. This is why multispectral data goes far beyond simple color images.
Limitations Compared to Hyperspectral
Multispectral imagery captures fewer wavelengths than hyperspectral data. It cannot identify materials at a chemical level.
Common Spectral Bands Explained
- Red, green, and blue bands create natural color images similar to what the human eye sees.
- Near infrared highlights vegetation health and biomass.
- Red edge detects early plant stress before it becomes visible.
Advantages of Multispectral Imagery
Multispectral imagery reveals information that cannot be seen with the human eye. For example, near infrared bands are highly sensitive to vegetation health. Red edge bands help detect early plant stress.
This type of imagery is widely used for calculating vegetation indices such as NDVI, classifying land cover, and monitoring environmental changes.
Limitations of Multispectral Imagery
Compared to panchromatic imagery, multispectral images are less sharp. Compared to hyperspectral imagery, they capture fewer wavelengths and therefore less material detail.
Common Use Cases
- Precision agriculture and crop monitoring
- Forest health analysis
Water quality assessment - Land use and land cover mapping
- Environmental monitoring
What Is Hyperspectral Imagery
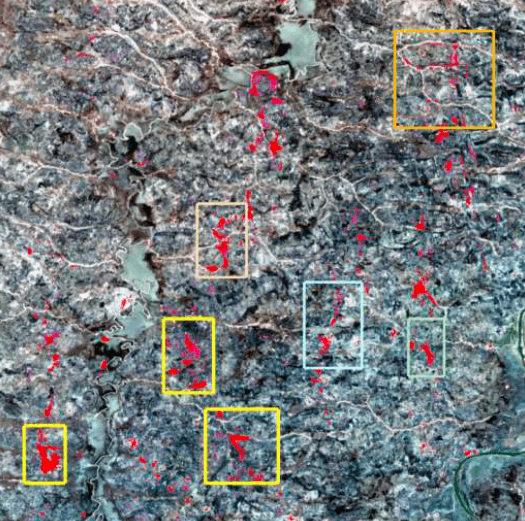
Hyperspectral imagery represents the most advanced form of optical satellite data. Instead of capturing a few broad bands, hyperspectral sensors record hundreds of very narrow and continuous bands across the electromagnetic spectrum.
For example, the GF 5B satellite carries an advanced hyperspectral imager capable of capturing 330 spectral bands across wavelengths from 400 to 2500 nanometers.
Each material on Earth reflects light in a unique way. This reflection pattern is called a spectral signature. Hyperspectral imagery can identify these signatures with high precision.
Key Characteristics of Hyperspectral Imagery
- Hundreds of narrow spectral bands
- Extremely high spectral resolution
- Lower spatial resolution often around 30 meters
- Deep analytical capability
Advantages of Hyperspectral Imagery
The primary advantage of hyperspectral imagery is material identification. It can distinguish between minerals, soil types, vegetation species, and chemical substances that look identical in standard images.
This makes hyperspectral data essential for gold & mineral exploration, environmental monitoring, and advanced scientific analysis.
Limitations of Hyperspectral Imagery
Hyperspectral data files are very large and require advanced processing. Analysis often relies on artificial intelligence and machine learning to match spectral patterns against known libraries.
Processing time and expertise requirements are higher compared to monochromatic and multispectral imagery.
Common Use Cases
- Gold, copper, and lithium exploration
- Soil and mineral composition mapping
- Pollution detection and
- environmental compliance
- Advanced agriculture analytics
Scientific research
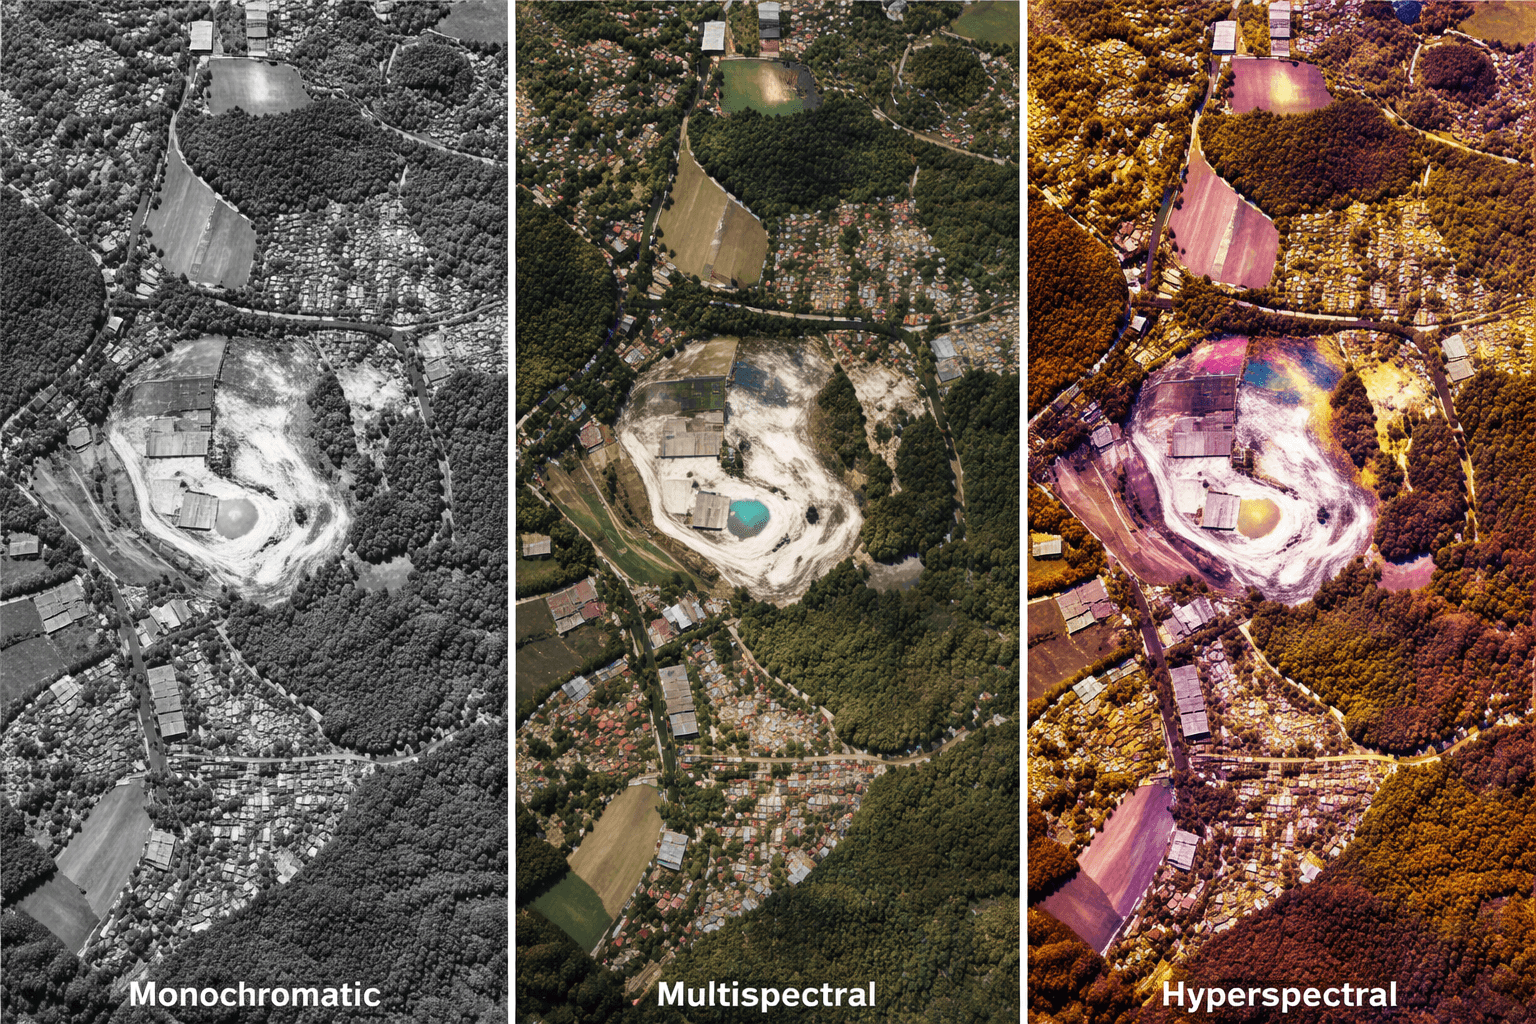
6. Key Differences Between Monochromatic Multispectral and Hyperspectral Imagery
The main difference between these imagery types lies in the balance between spatial detail and spectral depth.
Monochromatic imagery offers the sharpest visuals but minimal analytical depth.
Multispectral imagery provides moderate spatial detail with meaningful surface insights.
Hyperspectral imagery delivers deep material intelligence with higher data complexity.
Data size increases with spectral detail. Processing complexity and cost also increase. Choosing the right imagery depends on whether your project prioritizes measurement, monitoring, or material analysis.
Panchromatic vs. Multispectral vs. Hyperspectral Comparison
| Feature | Panchromatic (Mono) | Multispectral | Hyperspectral |
|---|---|---|---|
| Number of Bands | 1 Broad Band | 4 to 8 Discrete Bands | Hundreds of Narrow Bands |
| Spectral Resolution | Low (wide wavelength range) | Medium (specific color channels) | High (very narrow intervals) |
| Spatial Resolution | Sharpest (as fine as 0.3m) | Medium (0.5m to 2m) | Lower (typically 30m) |
| Primary Advantage | High structural detail | Color and vegetation health | Chemical/Mineral fingerprinting |
Data Volume and Processing Considerations
As the number of spectral bands increases, so does the data volume. Panchromatic imagery produces the smallest files and is easy to process. Multispectral imagery requires moderate storage and processing power. Hyperspectral imagery produces massive datasets.
XRTech Group operates a cloud based system capable of processing up to 50 terabytes of data per day. With an archive capacity exceeding 60 petabytes, XRTech ensures that even the most data intensive hyperspectral projects are handled efficiently.
Standard processing includes orthorectification, color correction, and alignment with GIS systems. Hyperspectral workflows also include advanced analytics using artificial intelligence and deep learning models.
Industry Applications Across XRTech Clients
Urban Planning and Infrastructure
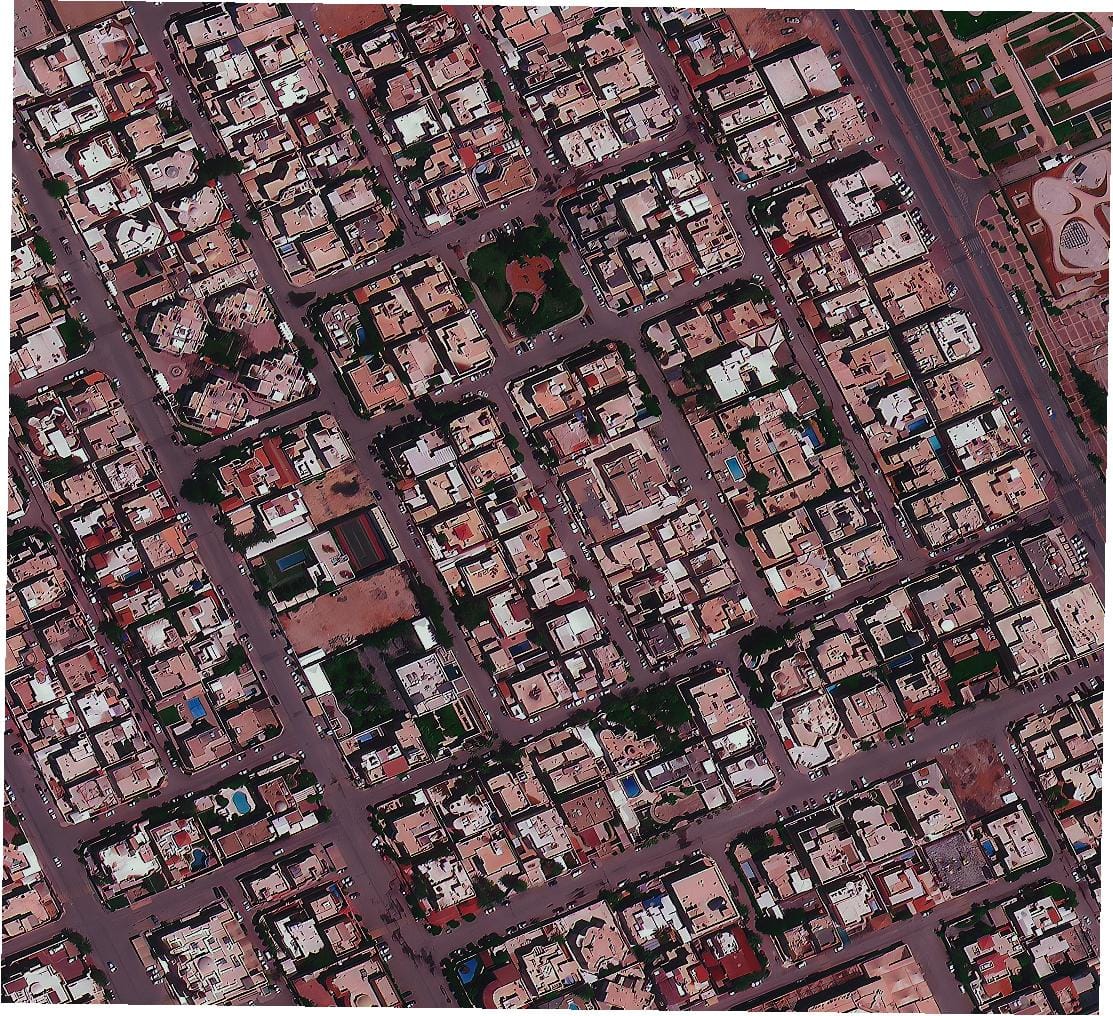
Panchromatic imagery provides detailed views of buildings, roads, and utilities. Multispectral data supports land use planning and environmental impact studies.
Agriculture and Forestry
Multispectral imagery is widely used for crop health monitoring, yield estimation, and forest management. Hyperspectral data supports soil analysis and early disease detection.
Mining and Energy
Hyperspectral imagery enables remote identification of mineral deposits. Panchromatic imagery supports site mapping and infrastructure monitoring.
Environmental Monitoring
Multispectral and hyperspectral imagery help track deforestation, water quality, pollution, and land degradation.
Disaster Management
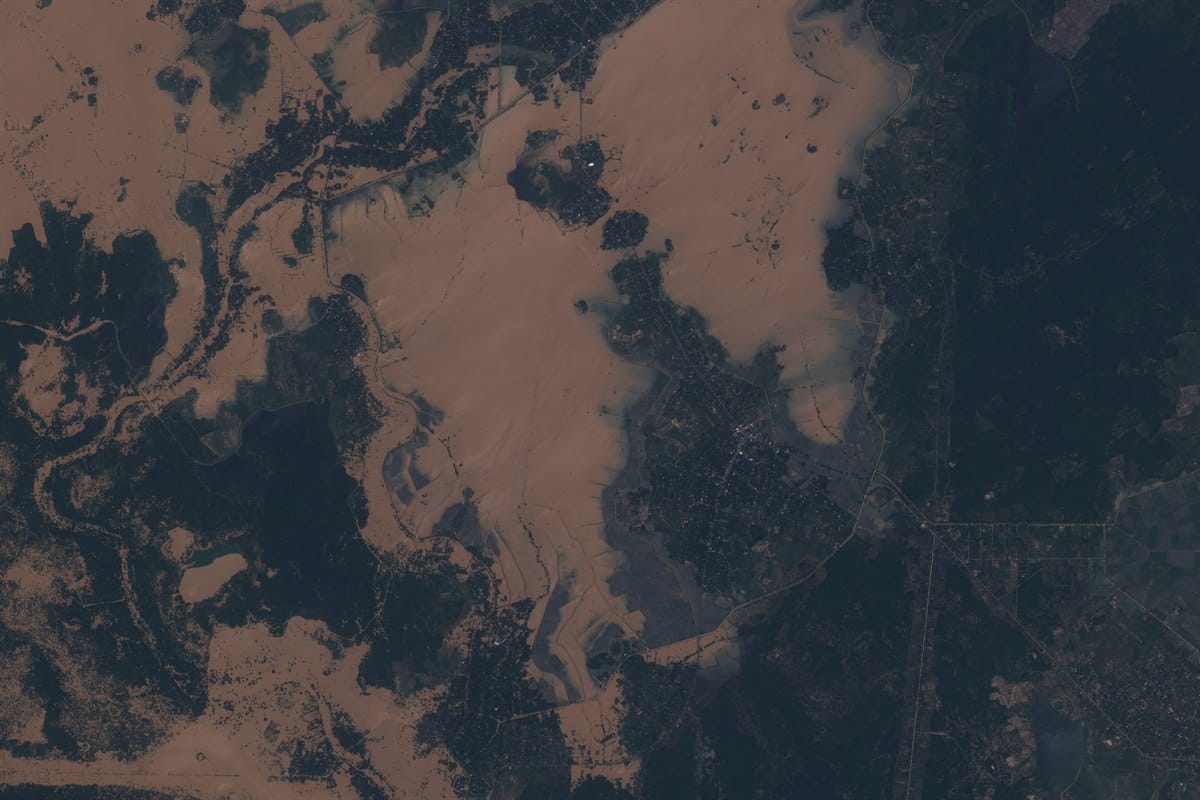
High resolution panchromatic imagery enables rapid damage assessment. Multispectral imagery helps identify flood extents and affected vegetation.
How XRTech Group Delivers All Three Imagery Types
XRTech Group is a global geospatial solutions provider and a distributor for China Siwei. Founded with expertise in satellite data and connected systems, XRTech focuses on delivering practical insights with fast turnaround times.
Through access to over 130 satellites, XRTech provides optical, SAR, and hyperspectral imagery tailored to different needs.
Key satellite systems include SuperView Neo series for ultra high resolution mapping, SuperView 2 for advanced multispectral analysis, and GF series satellites for stereo mapping and hyperspectral applications.
XRTech also offers value added products such as digital elevation models, 3D city models, and AI based change detection.
Choosing the Right Imagery for Your Project
Selecting the right imagery starts with understanding your objective.
- Are you mapping structures or analyzing surface conditions
- Do you need two dimensional maps or three dimensional models
- Is frequent monitoring more important than spectral detail
- Does your project require material identification
Factors such as off nadir angle, revisit frequency, and spatial accuracy also play a critical role.
XRTech advisors work directly with clients to evaluate these factors and recommend the optimal imagery solution.
Final Thoughts
Monochromatic, multispectral, and hyperspectral imagery each serve a unique purpose. Choosing the right type ensures accuracy, efficiency, and meaningful insight.
With deep technical expertise, global satellite access, and fast delivery, XRTech Group helps organizations turn satellite imagery into confident decisions.
summary
• Optical satellite imagery is essential for mapping, monitoring, analysis, and decision making across industries such as agriculture, mining, urban planning, and infrastructure.
• Optical imagery captures reflected sunlight from the Earth and is defined by two key factors: spatial resolution for visual detail and spectral information for surface analysis.
• Monochromatic, also called panchromatic imagery, records a single broad band of light and delivers the sharpest spatial detail, reaching resolutions as fine as 30 cm.
• Panchromatic imagery is best suited for urban mapping, infrastructure monitoring, building footprint extraction, and high accuracy base maps.
• Multispectral imagery captures multiple light bands such as red, green, blue, near infrared, and red edge, allowing analysis of vegetation health, land cover, and environmental conditions.
• Multispectral data is widely used in precision agriculture, forest monitoring, water analysis, change detection, and land use classification.
• Hyperspectral imagery records hundreds of narrow bands, creating a detailed spectral signature that can identify minerals, soil composition, vegetation species, and environmental contamination.
• Hyperspectral imagery is ideal for mineral exploration, advanced agriculture analytics, environmental monitoring, and resource mapping but requires higher processing power.
• The key difference between the three imagery types lies in the tradeoff between visual sharpness and analytical depth.
• XRTech Group provides access to all three imagery types through a constellation of more than 130 satellites in partnership with China Siwei.
• XRTech offers ultra high resolution optical imagery, advanced multispectral sensors, and specialized hyperspectral systems tailored to different project needs.
• Clients benefit from fast delivery, flexible tasking, global coverage, no export delays, and value added products such as DEMs and 3D city models.
• Choosing the right imagery depends on project goals, required accuracy, analysis needs, revisit frequency, and viewing angle.