

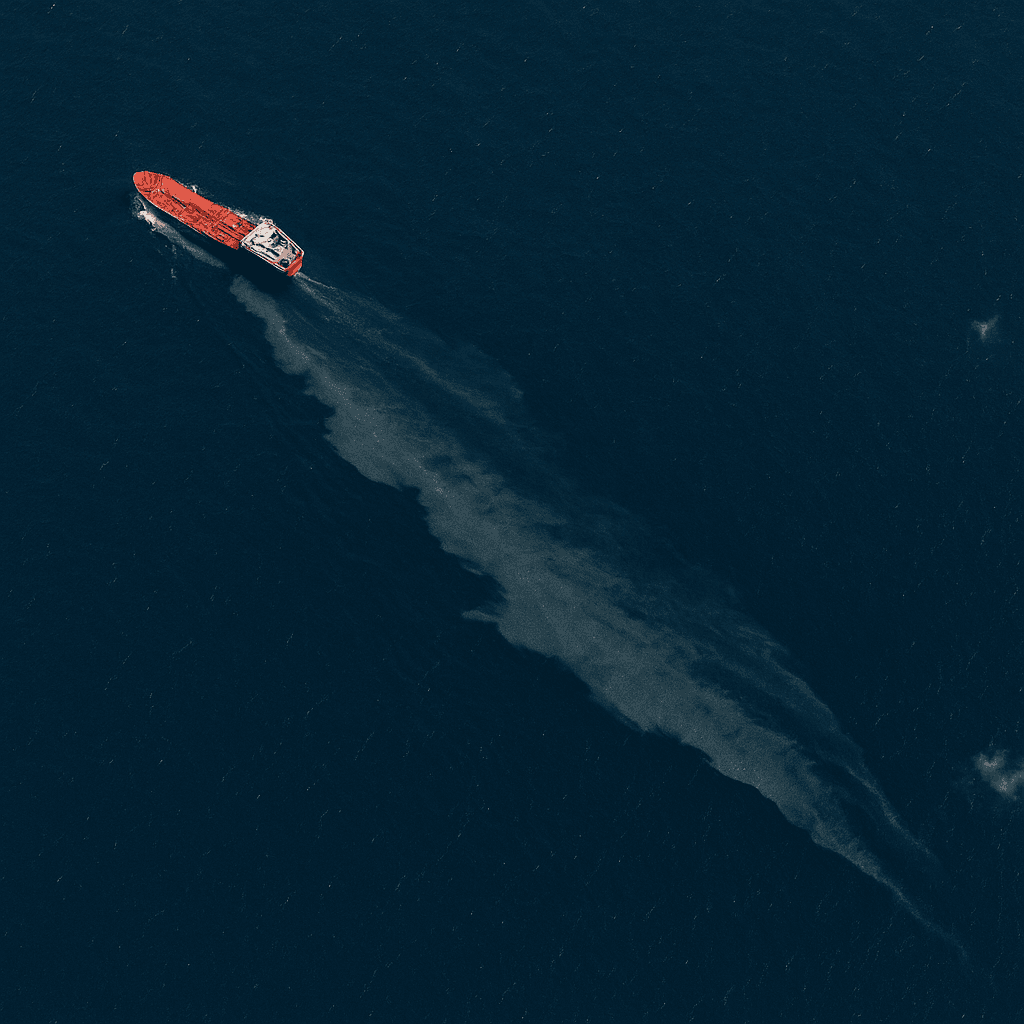
Marine oil spill monitoring
Satellite Oil Spill Detection with SAR Imagery
XRTech Group supplies radar and optical satellite imagery to detect oil spills and natural oil seeps across coastal waters and open sea, with fast oil spill data delivery for response teams, operators and regulators.
1m
C-band SAR resolution
24/7
Day, night and through cloud
1.5h
Emergency tasking response
C, L, X
Radar bands available
Why satellites
Marine Oil Spill Monitoring Across Vast Sea Areas
Oil spills and natural oil seeps can spread across hundreds of square kilometres within hours, often far from shore and out of sight of patrol vessels and aircraft. Surveying that much open water by boat or plane is slow, costly and easily grounded by bad weather.
Satellite oil spill monitoring covers shipping lanes, offshore fields and entire coastlines in a single pass. Synthetic aperture radar sees through cloud and darkness, and high-resolution optical imagery confirms what the radar finds, so you get reliable oil spill data when timing matters most.
Explore SAR Satellite Imagery →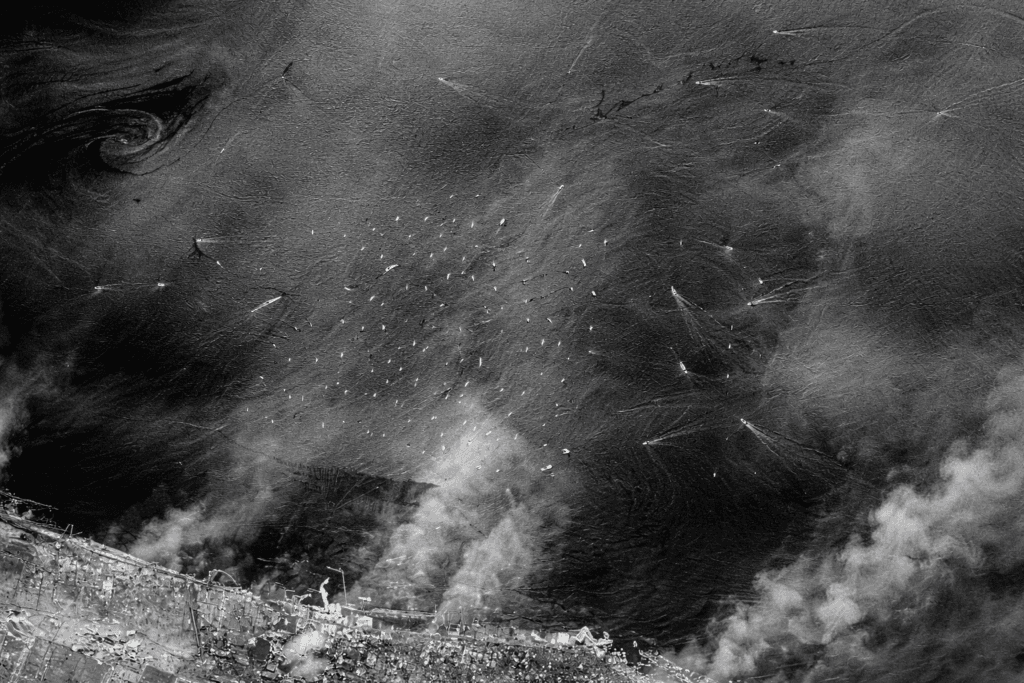
Radar view of coastal waters: dark, smooth streaks mark where the sea surface has been dampened
Applications
Oil Spill Detection Using Satellite Imagery
From routine surveillance of shipping lanes to rapid mapping after an incident, satellite data supports every stage of offshore oil spill detection and response.
Vessel Discharge and Illegal Dumping
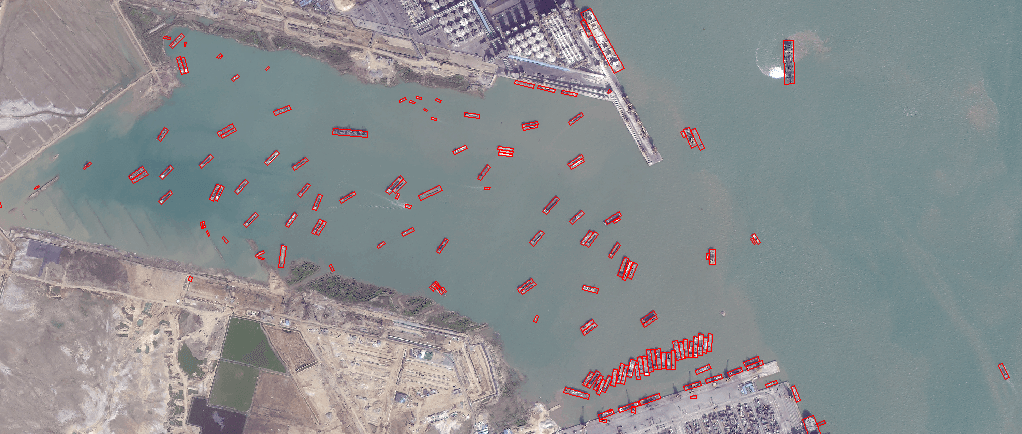
Spot slicks trailing ships in open water and link them to vessels in the same scene, supporting investigations into illegal bilge and tank washing discharges.
Drilling and Production Sites
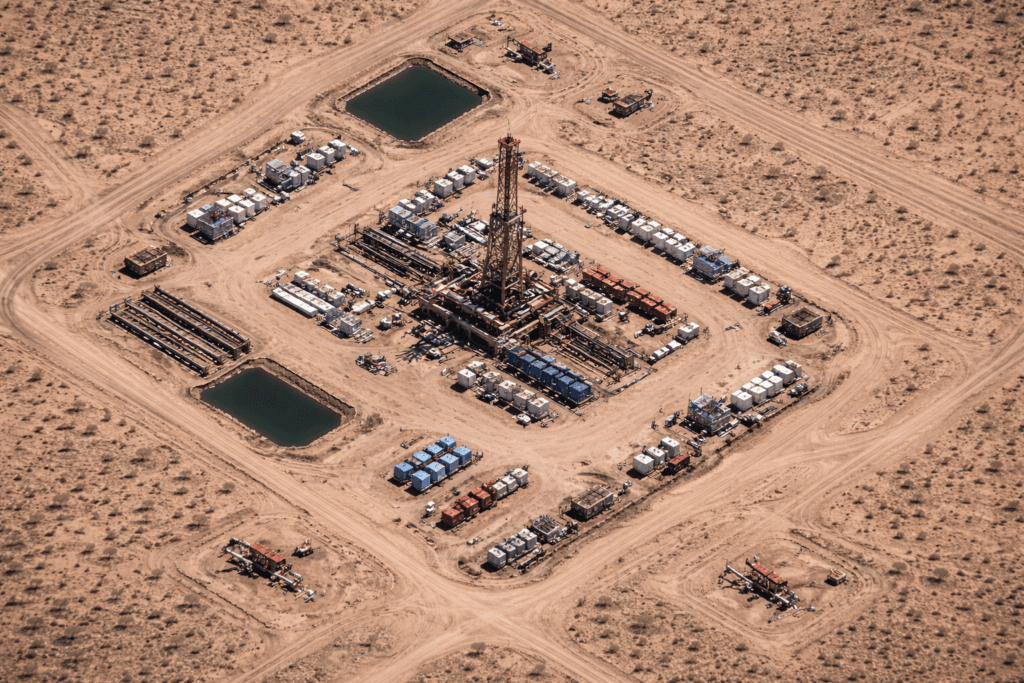
Keep persistent watch over platforms, wells and pipelines to verify incident reports and catch leaks early, even at remote offshore locations far from the coast.
Natural Oil Seep Detection
Repeated SAR acquisitions reveal slicks that return to the same spot over time, a strong sign of a natural oil seep and a useful lead for offshore exploration.
Ports, Terminals and Refineries
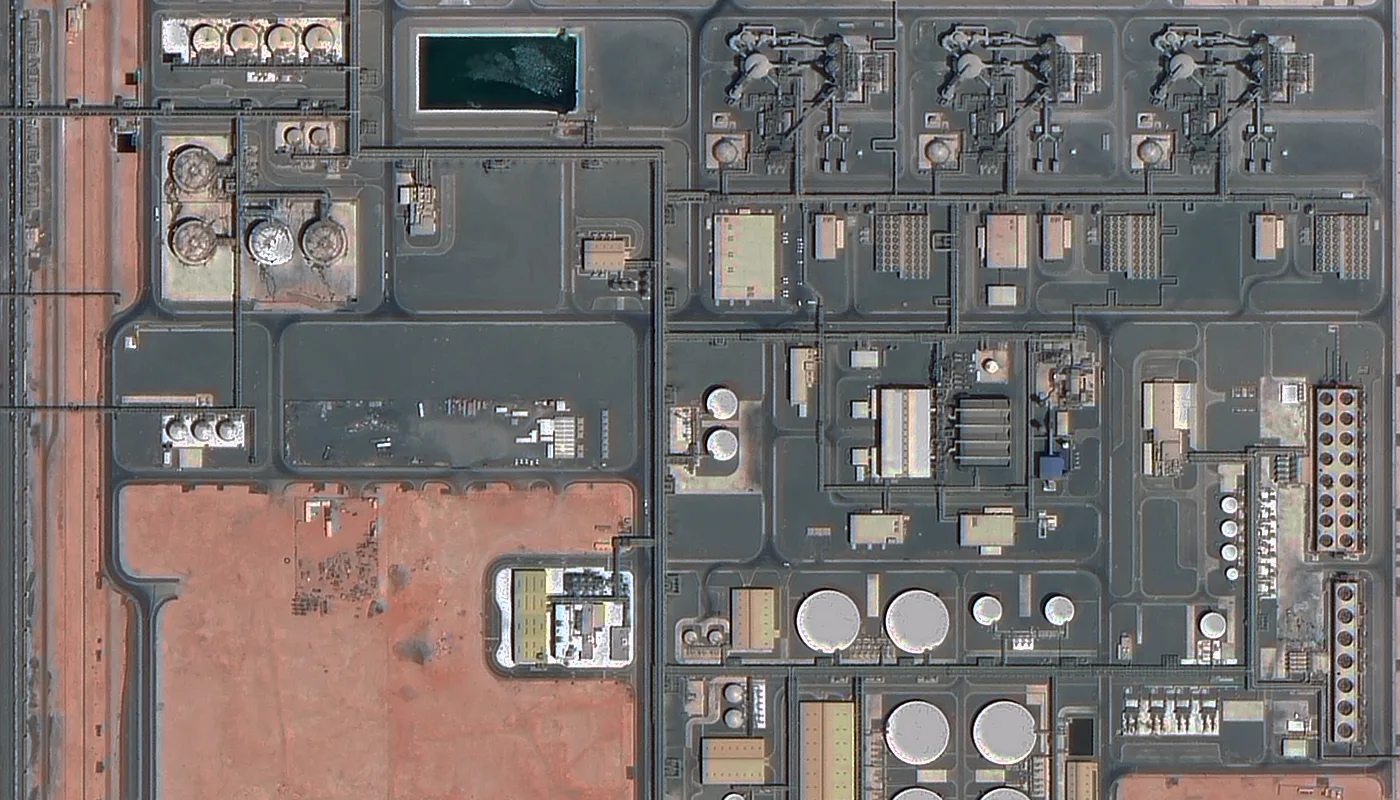
Monitor loading terminals, tank farms and coastal refineries where many spills start, and map the extent of any release into nearby water.
Shoreline and Habitat Impact
Assess how far oil has reached beaches, wetlands and mangroves, and plan clean-up with orthophoto maps and elevation data of the affected coast.
Evidence and Compliance Reporting
Dated, georeferenced imagery gives you defensible evidence for claims against polluters, regulatory reporting and protection against false accusations.
How it works
How SAR Oil Spill Detection Works
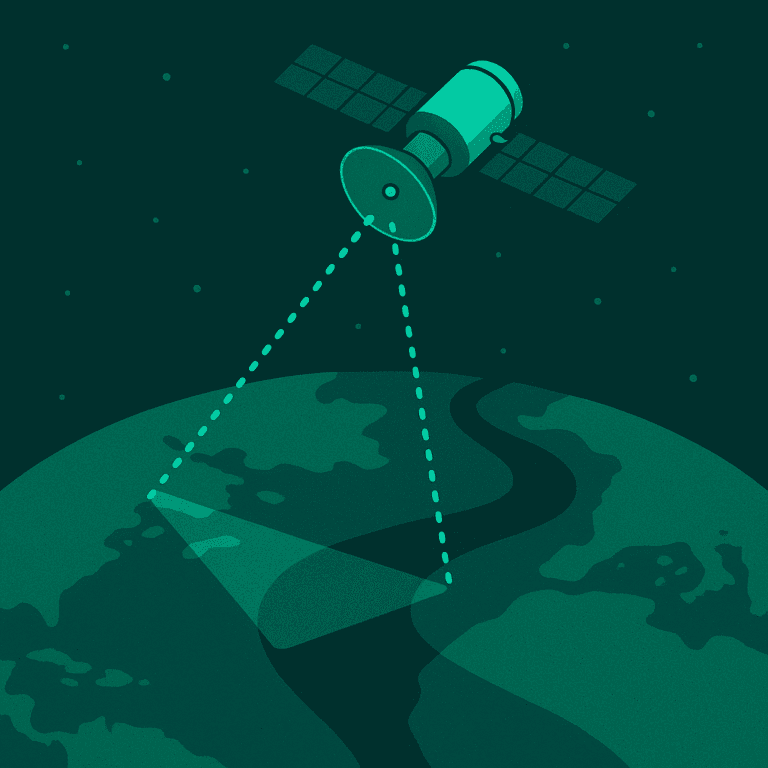
Synthetic aperture radar sends its own microwave pulse to the sea surface and records the energy that bounces back. That is what makes radar oil spill detection possible day or night, and straight through cloud.
01
Rough Water Scatters the Signal
Wind raises small capillary waves that scatter radar energy back to the satellite, so open sea appears bright or textured in SAR imagery.
02
Oil Dampens the Waves
An oil film smooths those capillary waves. Less energy returns to the sensor, and oil slick backscatter drops well below the surrounding water.
03
Slicks Show as Dark Patches
The result is a dark, often elongated shape against brighter sea. Analysts measure its area, outline and drift direction for your oil spill data report.
04
Look-Alikes Are Screened Out
Low-wind zones, algae films and rain cells can also look dark. Shape, context, wind data and repeat passes help separate real slicks from look-alikes.
05
Optical Imagery Confirms
Where the weather allows, high-resolution optical satellites confirm the spill, show its thickness pattern and identify nearby vessels or infrastructure.
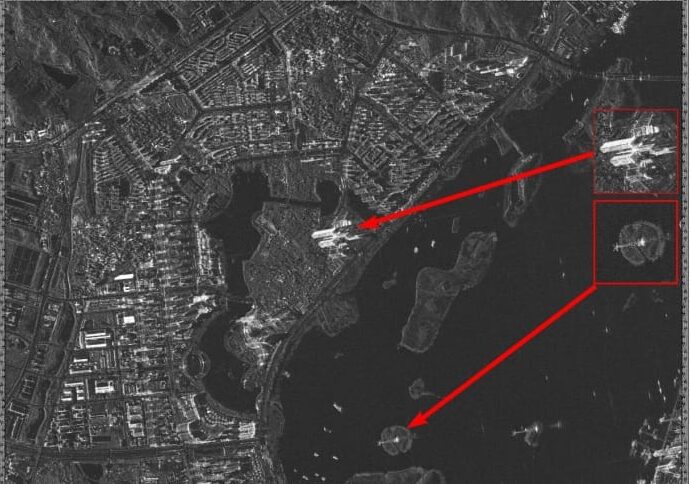
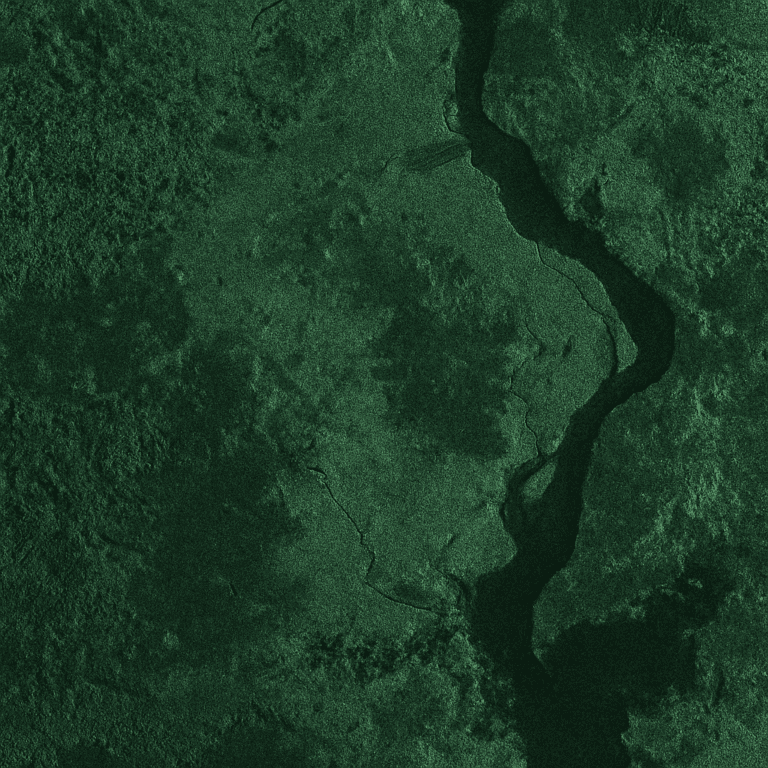
GF-3 C-band SAR sample: smooth water returns little signal and appears dark, while vessels and structures show as bright points
Sensors and data
Satellites for Oil Spill Monitoring
Radar finds the slick, optical imagery confirms it, and frequent revisits track where it goes. We combine all three from one provider.
01
SAR Satellites
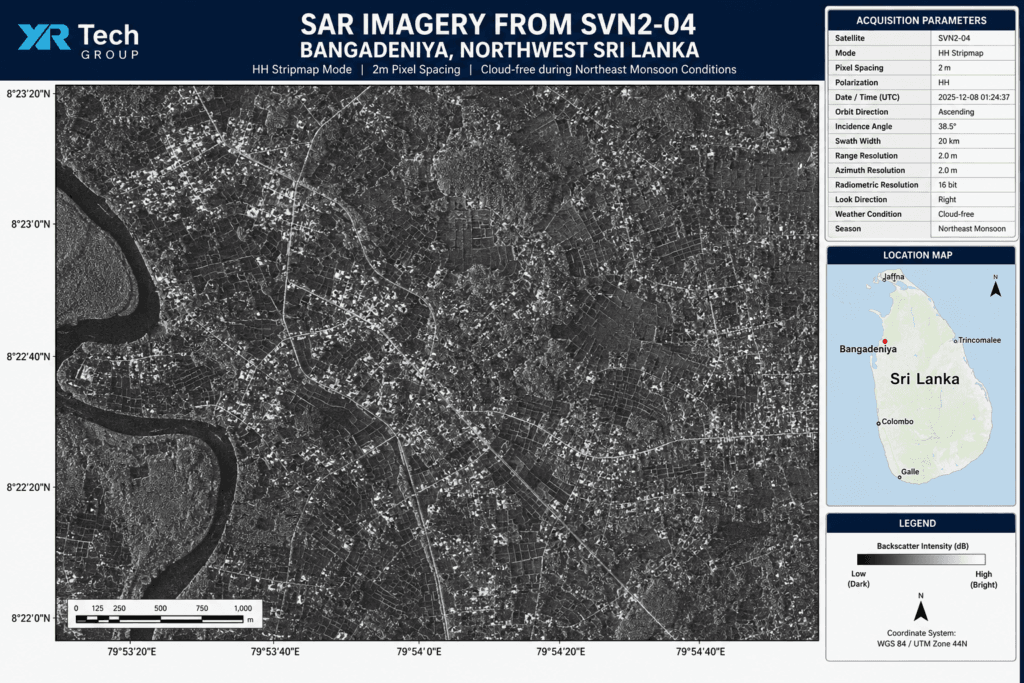
GF-3 at 1m (C-band) and LT-1 at 3m (L-band), with C, L and X-band options and single, dual or full polarisation for SAR imagery for oil spill monitoring.
02
High-Resolution Optical
SuperView Neo-1 at 0.3m, SuperView-2 at 0.4m and SuperView-1 at 0.5m to confirm spill location, nearby vessels and surface impact in clear weather.
03
Wide Area, Frequent Revisit
Wide-swath satellites such as GF-1 and GF-6 cover large sea areas, and the SuperView Neo system can revisit a site up to 25 times per day to follow a drifting slick.
04
Analysis-Ready Products
Orthorectified, mosaicked imagery, slick outlines and area estimates, plus DEM and orthophoto maps of affected coasts, delivered GIS-ready.
Satellite imagery portal
Search, View and Order Satellite Imagery
Use the satellite imagery portal to check archive coverage over your sea area, define an Area of Interest, and order archive scenes or request new radar and optical tasking.
1
Search Your Area
Find available imagery over the coastline, offshore field or shipping lane you need to monitor.
2
Draw or Upload KML
Define the Area of Interest by drawing it on the map or uploading a KML file.
3
Order Imagery
Choose available archive imagery or request new tasking, then complete the order in the portal.
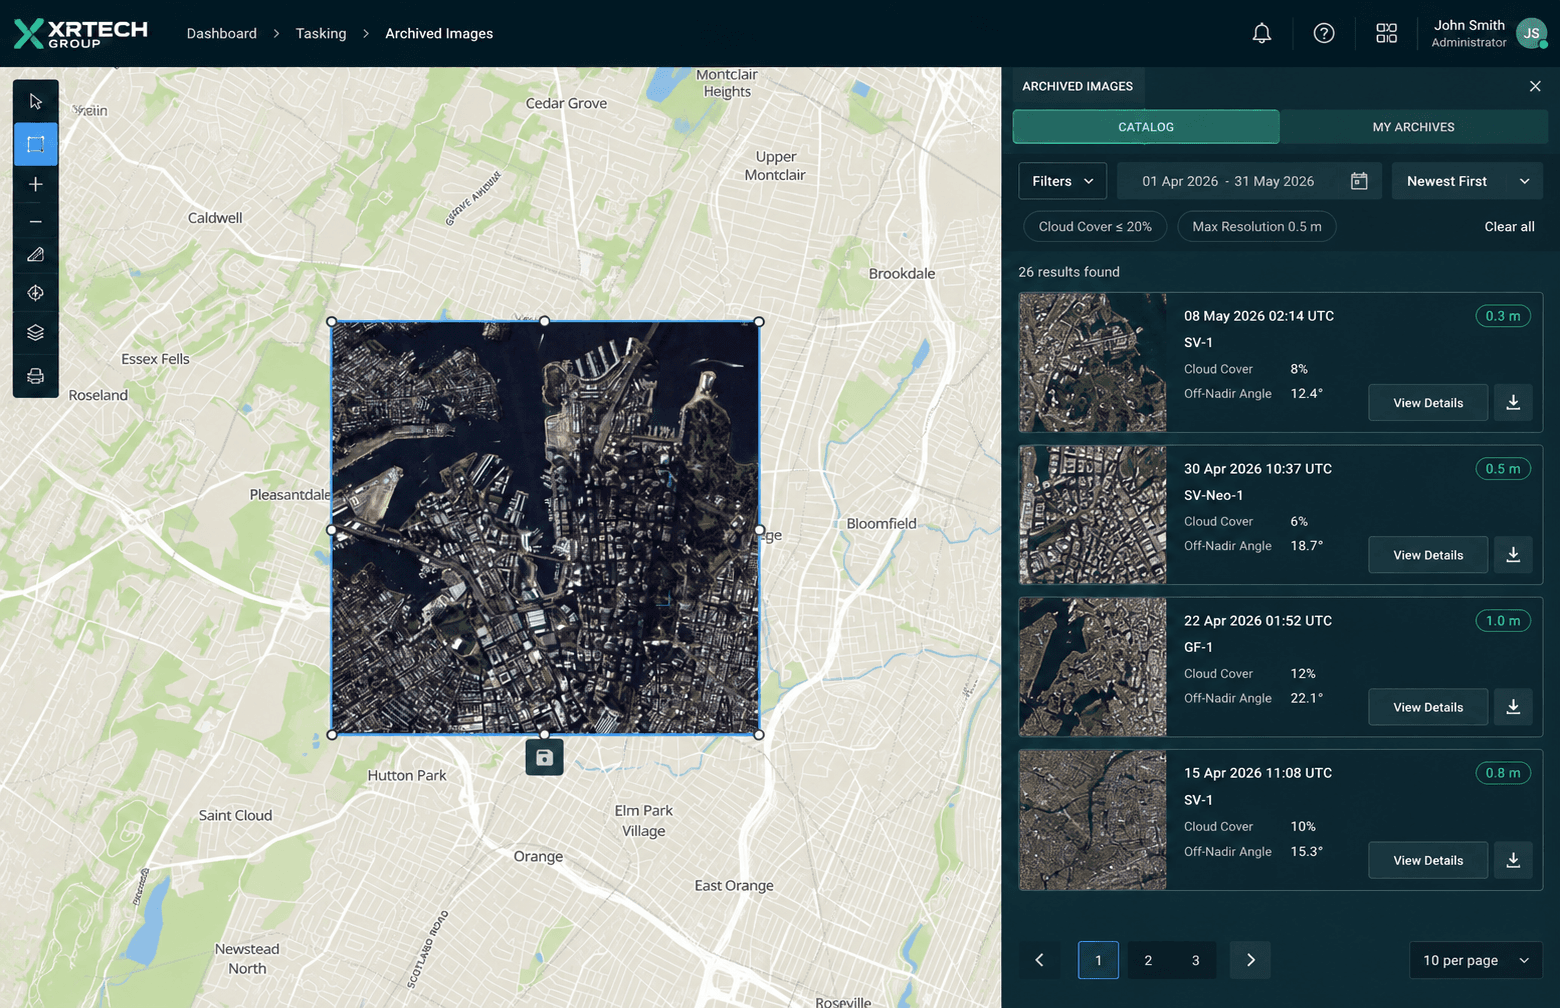
Archive search view in the XRTech satellite imagery portal
Why choose XRTech
A Reliable Partner for Oil Spill Response
01
Fast Oil Spill Data
A 1.5-hour response time and 1-hour data delivery on urgent SuperView Neo requests, subject to availability, so teams see the spill while it still matters.
02
Deep Imagery Archive
Decades of archive data help you set baselines, study recurring seeps and look back at when a slick first appeared.
03
Flexible Licensing
Licensing matched to the data source and project. As a non-U.S. provider, we avoid export licence bottlenecks for international operations.
04
Expert Technical Support
Remote sensing specialists help you choose the right sensor, band and resolution, and can supply analysed slick outlines ready for your GIS.
Pricing
Clear Pricing for Archive and New Tasking
Simple pricing for oil spill satellite imagery, sized to your sea area and project, with no hidden fees. SAR imagery is quoted separately by sensor and mode.
High Resolution
51 to 80cm resolution, up to 4 bands
Archive image (older than 90 days)
USD 5 /km², minimum 25 km²
New tasking image (freshly captured)
USD 8 /km², minimum 100 km²
Very High Resolution
31 to 50cm resolution, up to 4 or 8 bands*
Archive image (older than 90 days)
USD 13 /km², minimum 25 km²
New tasking image (freshly captured)
USD 20 /km², minimum 100 km²
Super High Resolution
30cm resolution, up to 4 bands
Archive image (older than 90 days)
USD 20 /km², minimum 25 km²
New tasking image (freshly captured)
USD 30 /km², minimum 100 km²
*Band availability may vary depending on satellite source. See full high-resolution satellite imagery pricing for archive and tasking costs.
FAQ
Oil Spill Detection Questions Answered
Common questions about SAR oil spill detection, oil seeps and ordering satellite data. Need something specific? Our team replies within 24 hours.
Ask Our Experts →
How does satellite oil spill detection work?
Satellites scan the sea surface with radar and optical sensors. Radar picks up oil as dark, smooth patches because oil dampens the small waves that normally reflect the signal, and optical imagery then confirms the slick, its extent and any nearby vessels or platforms.
Why is SAR used for oil spill detection?
Synthetic aperture radar provides its own illumination, so it works day and night and sees through cloud, haze and smoke. That makes SAR the most dependable sensor for routine offshore oil spill detection over large sea areas.
What is oil slick backscatter?
Backscatter is the radar energy reflected back to the satellite. Oil smooths the sea surface, so an oil slick returns much less backscatter than the surrounding water and appears as a dark area in SAR imagery. Analysts use this contrast, plus shape and wind conditions, to confirm a slick.
Can satellites detect natural oil seeps?
Yes. Natural oil seeps leave thin slicks that reappear in the same place across repeated SAR acquisitions. Mapping these recurring slicks over time helps separate seeps from one-off spills and can point exploration teams to active petroleum systems.
How quickly can I receive oil spill data?
For urgent tasking, the SuperView Neo system offers a 1.5-hour response time and 1-hour data delivery, subject to satellite availability. Archive imagery can usually be delivered within hours of your order.
What resolution do I need for oil spill monitoring?
Wide-area surveillance often uses medium-resolution SAR to cover hundreds of kilometres at once, while 1m to 3m SAR and 0.3m to 0.5m optical imagery are used to map slick edges, find the source and identify vessels. We help you balance coverage and detail for your area.
Can satellite imagery identify the vessel responsible?
Often it can. A fresh slick trailing behind a ship is visible in both radar and optical scenes, and high-resolution imagery can show the vessel itself. Combined with ship tracking data, this gives strong evidence for investigations and claims.
How much does oil spill satellite imagery cost?
Optical archive imagery starts at USD 5 per km² and new tasking at USD 8 per km², depending on resolution. SAR imagery is priced by sensor, mode and area, so request a quote with your area of interest for an exact figure.
Get started
Protect Your Waters with Satellite Oil Spill Monitoring
Tell us your area of interest and timeline. We respond in under 24 hours, and free satellite imagery samples can be included with your quote.