

Wildfire Detection and Forest Fire Monitoring With Satellite Data
XRTech Group detects and monitors wildfires from space: automatic hotspot alerts from the geostationary GF-4 thermal satellite every 20 seconds, sub-metre optical and radar imagery to confirm and track the fire through smoke, and burned area, burn severity and loss maps after containment. Emergency tasking delivers fresh imagery within 24 hours.
✓Early warning: automatic fire point alerts, no manual screening
✓Active fire tracking through smoke, cloud and darkness with SAR
✓Burned area, burn severity, recovery and fire loss reports
For fire departments, first responders, emergency management agencies, forestry services, NGOs, insurers and utilities.

20 sec
GF-4 geostationary refresh for continuous fire watch
24 h
Emergency tasking to delivered imagery of the fire
29
Large forest fires monitored for a national emergency department, every large fire covered
130+
Optical, thermal, hyperspectral and SAR satellites on call
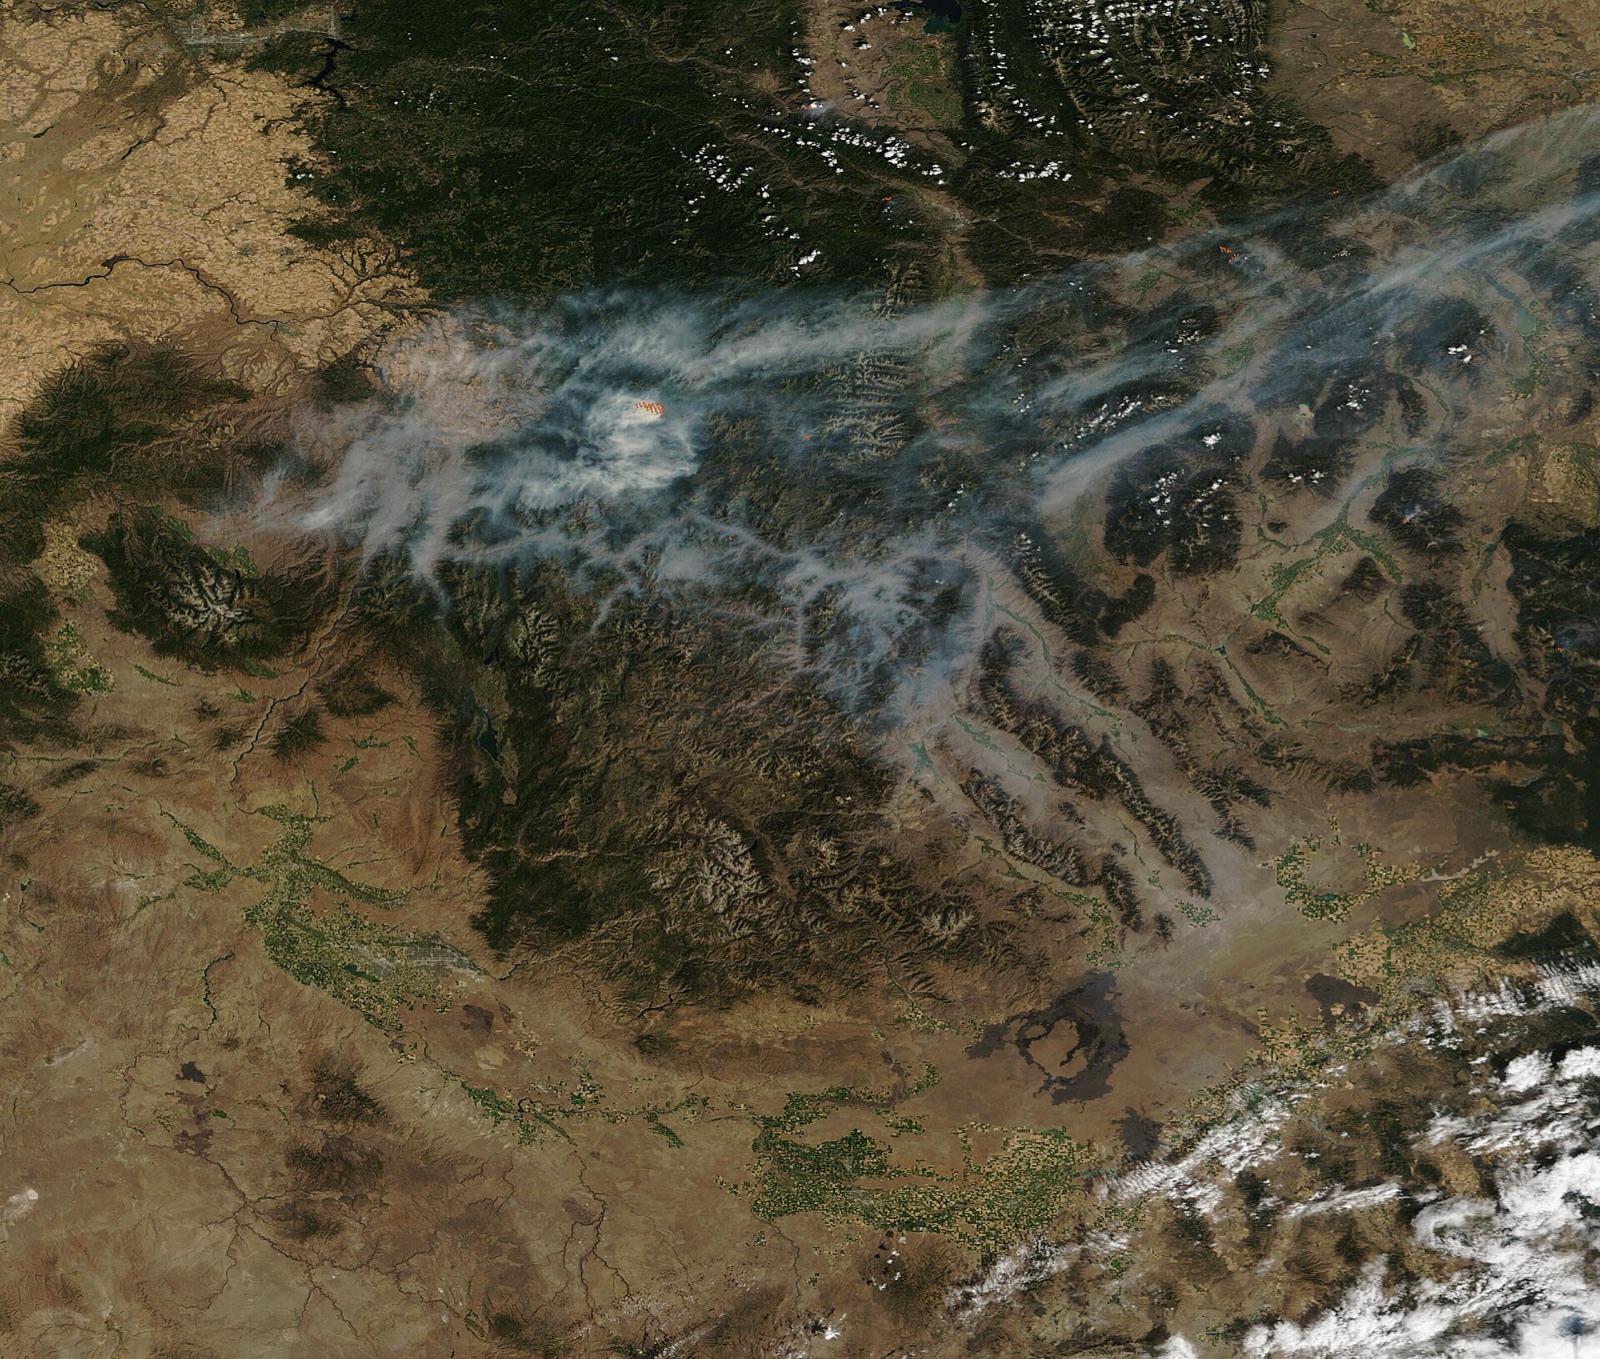
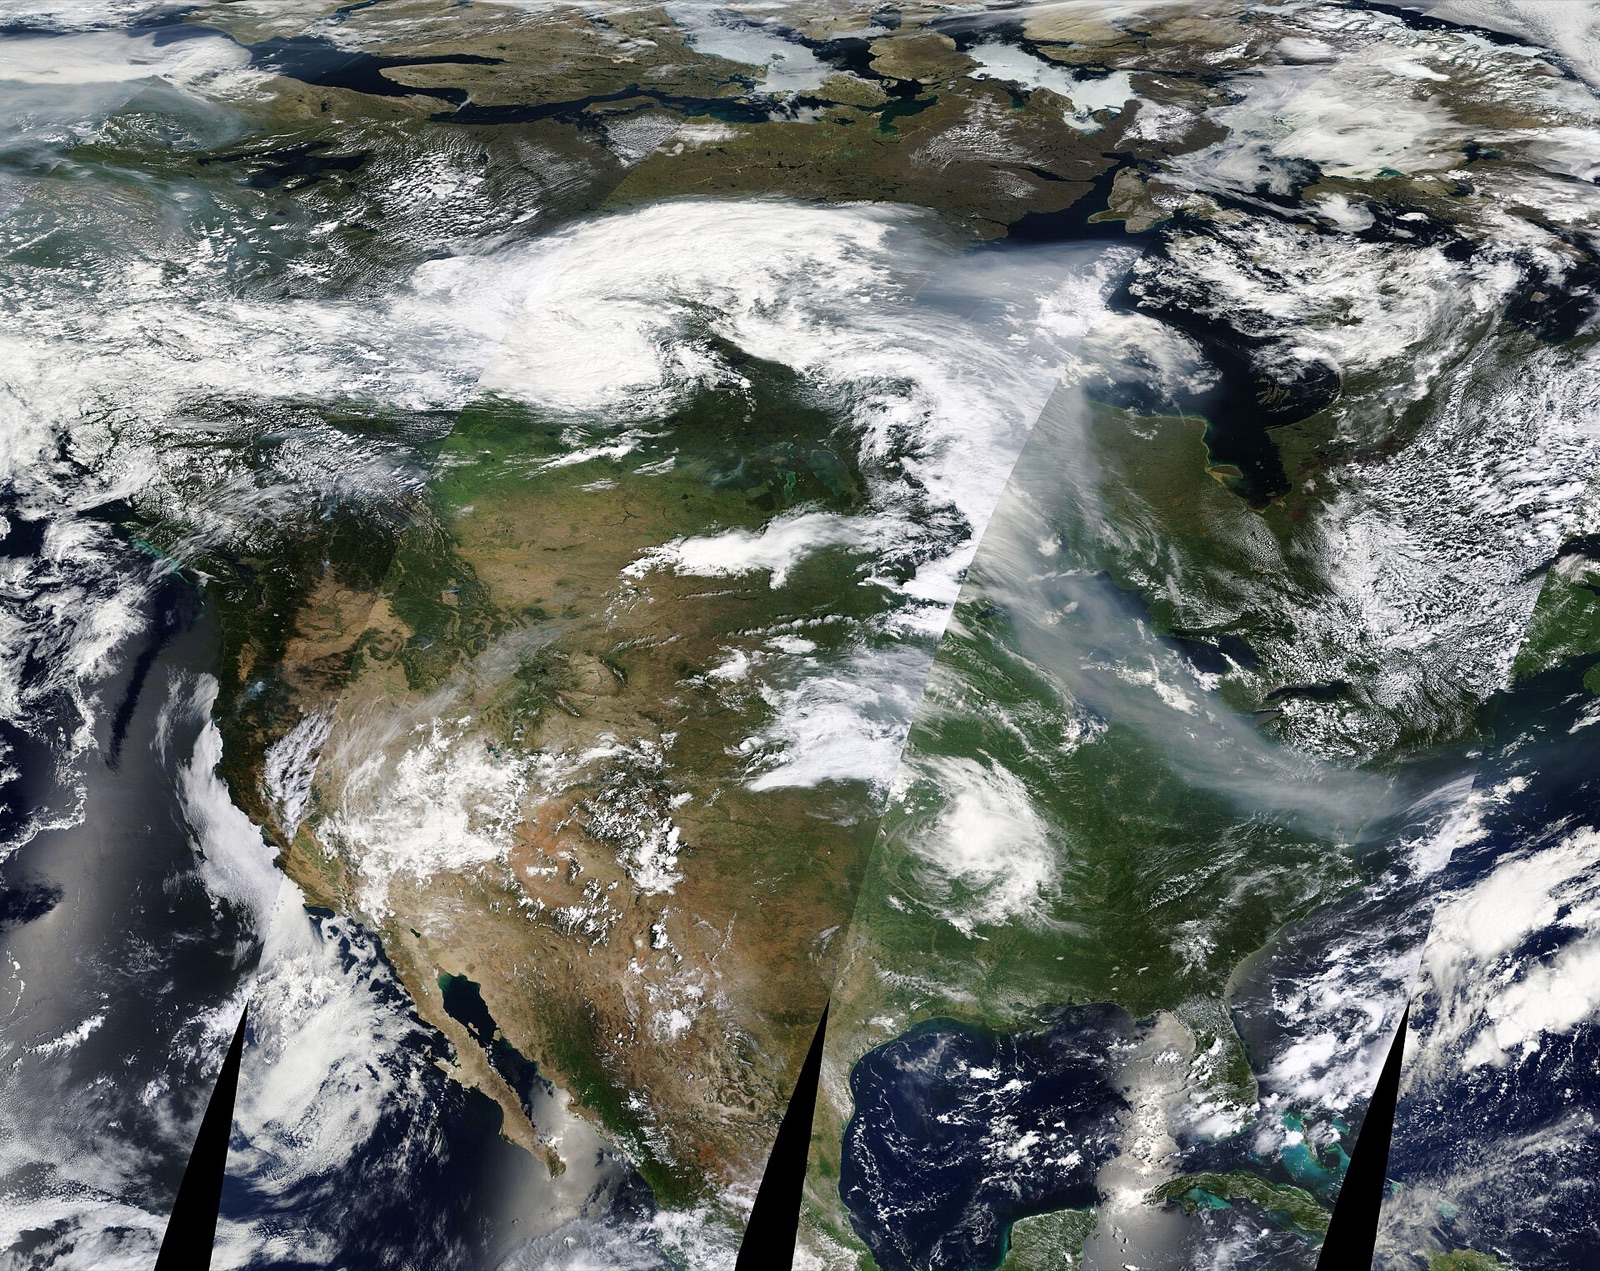
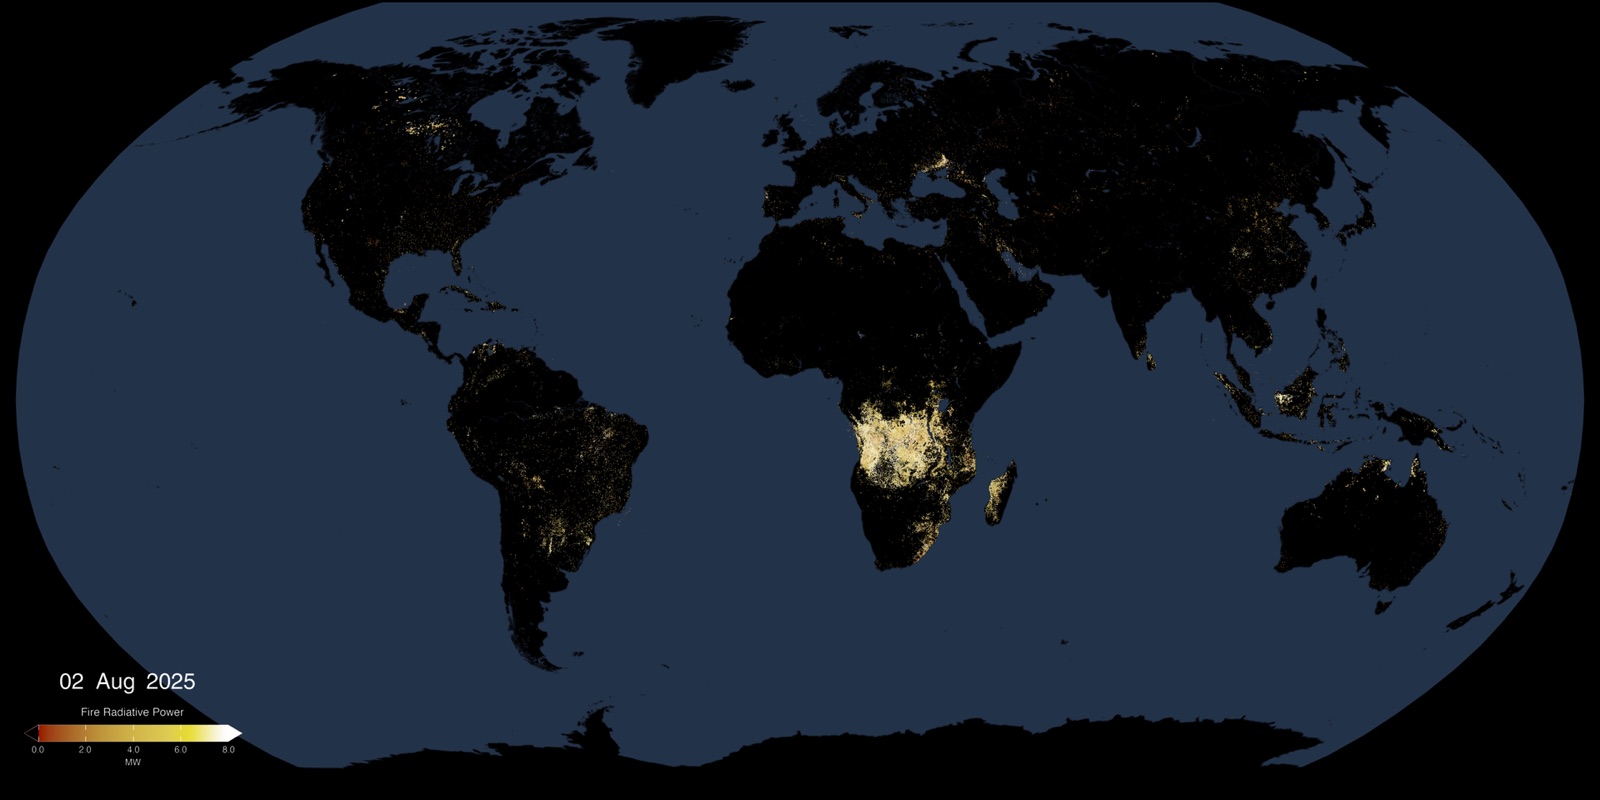
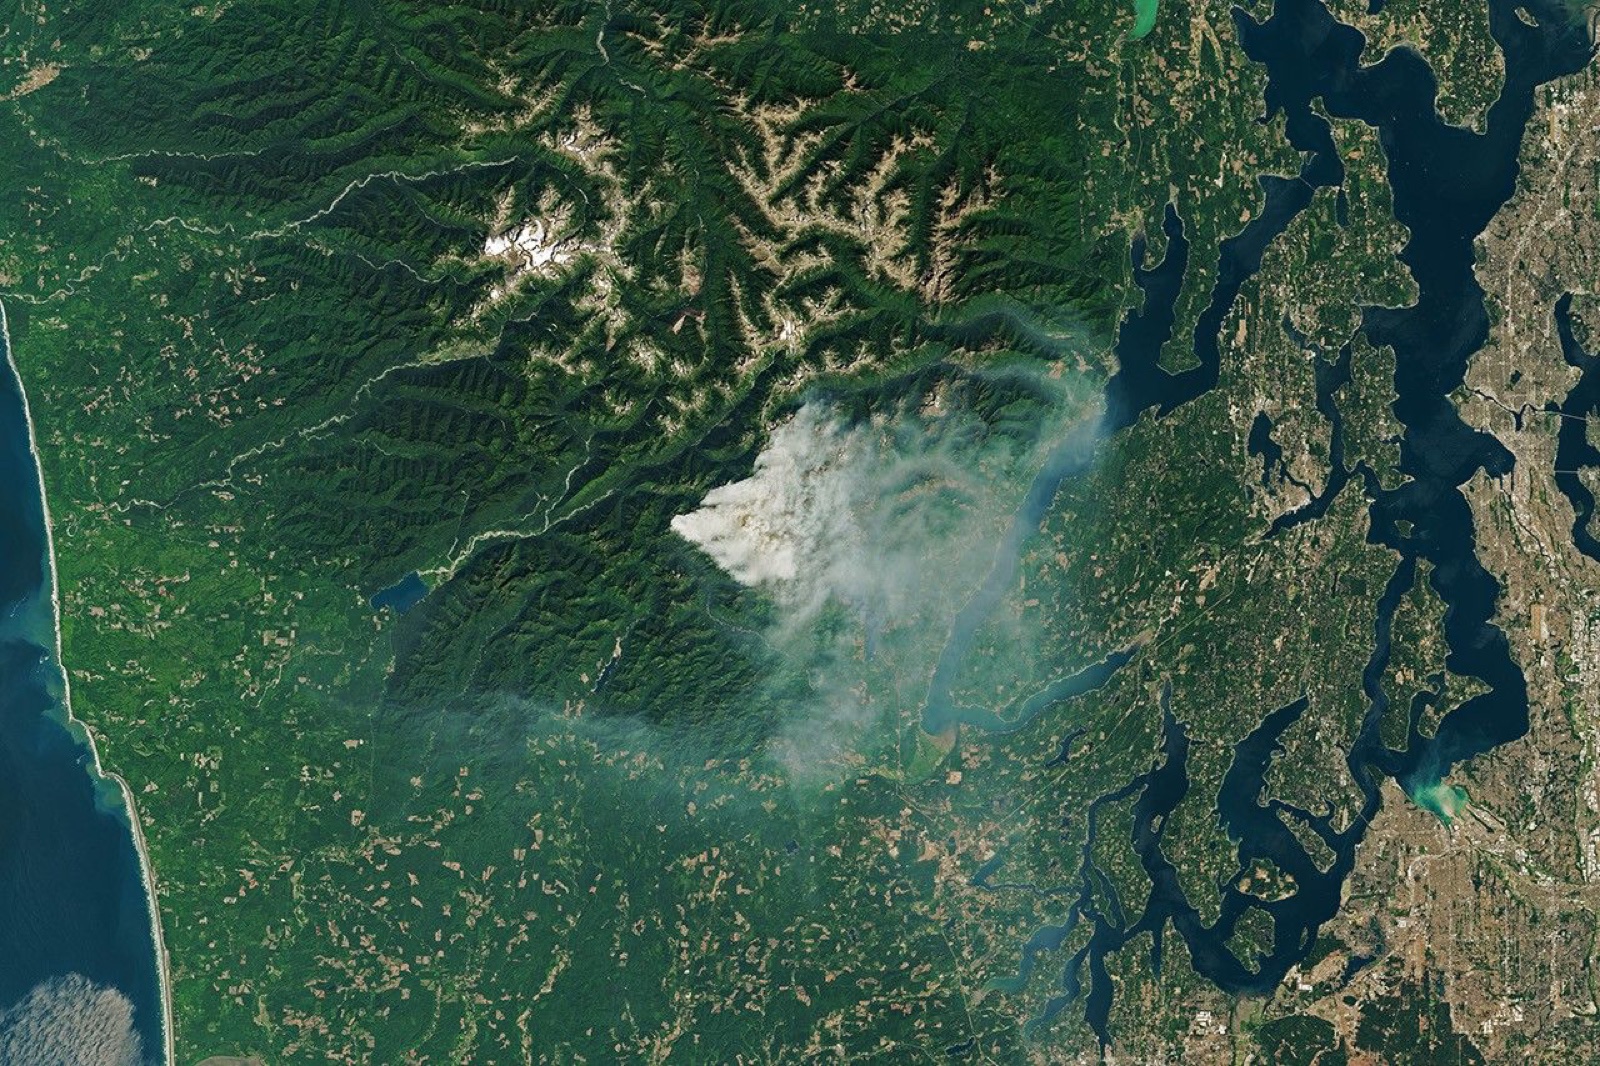
Full-area scanningMany fires and smoke plumes across one region, seen in a single pass.
Disaster response and management
Wildfire Disaster Response and Management Before, During and After a Fire
Satellite wildfire detection uses thermal infrared sensors to find heat anomalies from orbit, high-resolution optical and radar imagery to confirm and map the fire, and spectral indices such as NBR to measure what burned. XRTech Group covers the whole wildfire management cycle as one service: risk warning and prevention before a fire, real-time monitoring and response during it, and loss assessment and recovery after it.
Emergency departments, government leaders and rescue teams get one current picture of every fire, so command decisions on crews, aircraft and evacuations rest on data rather than on reports from the ground alone. The same imagery then supports insurance claims, recovery funding and restoration.
When smoke, cloud or night hides the fire from optical satellites, GF-3 and LT-1 SAR imagery keeps the perimeter and terrain under watch. For fires, floods and other disasters that cannot wait, see emergency satellite imagery and satellite imagery for disaster management.
Prepare and prevent
Before the fire
Fire risk maps, fuel load and dryness, firebreak and prescribed burn planning, plus minute-by-minute scanning that raises suspected fire points automatically. Used by forest agencies, planners and fire prevention teams to place resources before the season.
Respond and suppress
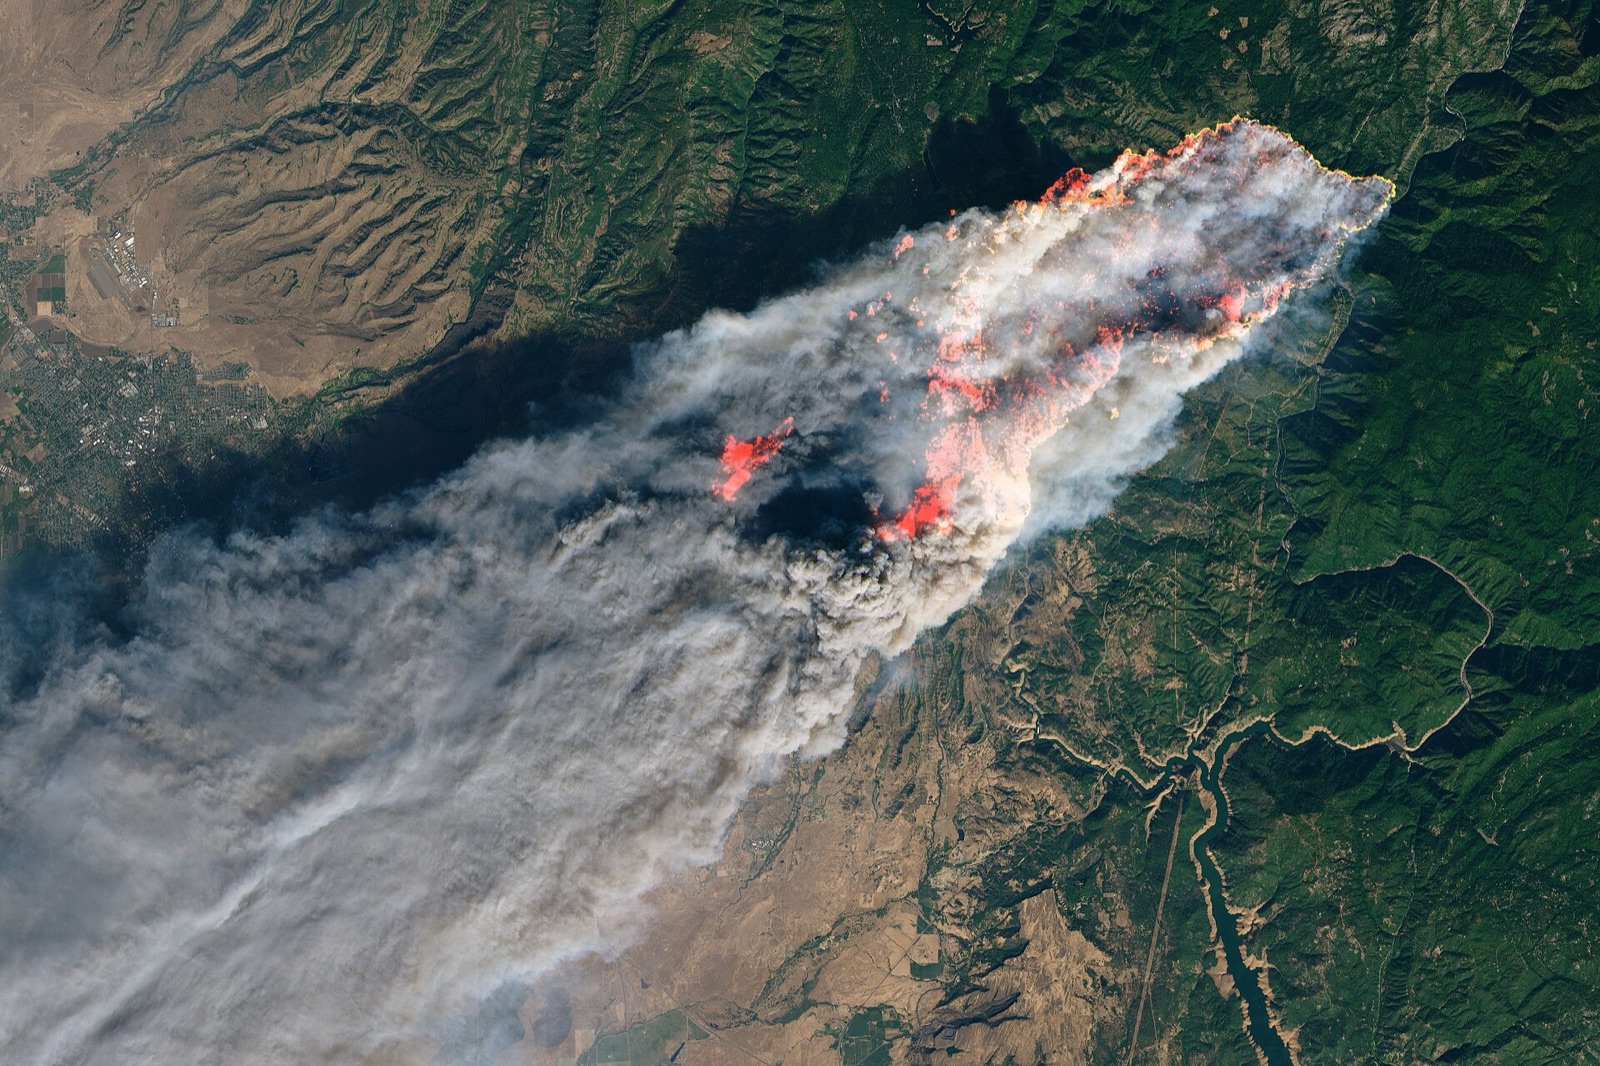
During the fire
Fire point verification, continuous tracking, spread prediction, smoke impact and emergency imaging of the fire line and threatened communities. Used by incident commanders, fire crews and evacuation planners.
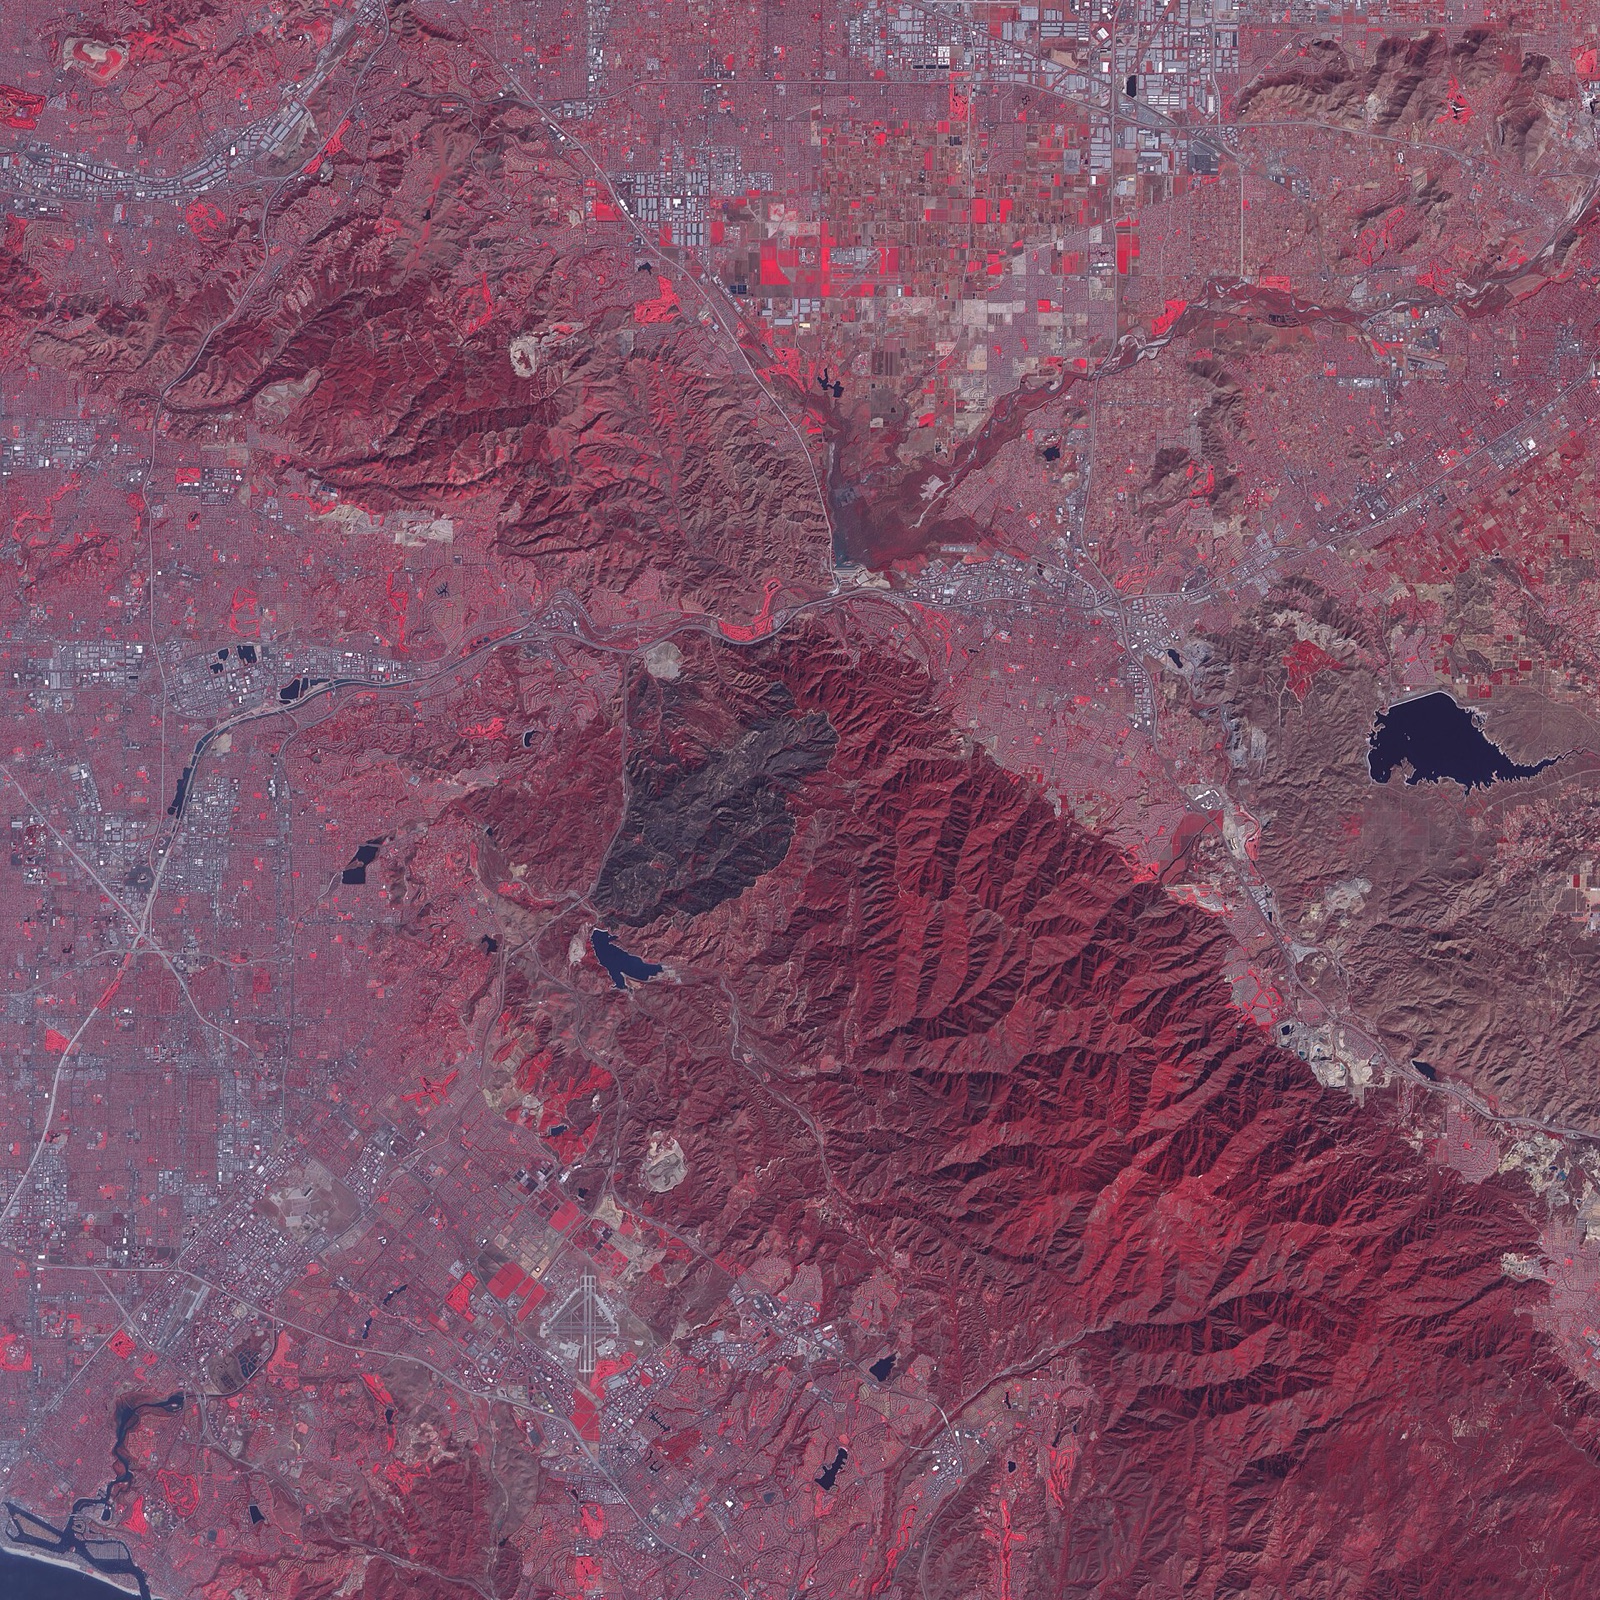
Assess and recover
After the fire
Affected range extraction, burned area and burn severity, building and asset damage, fire reports, then restoration planning and regrowth monitoring. Used by recovery agencies, insurers, NGOs and restoration teams.
Wildfire pricing
Wildfire Satellite Imagery Prices by Response Speed
XRTech Group's prices in US dollars per km², the same for any fire anywhere in the world. Choose by how fast you need the data: emergency tasking for an active fire, priority for fast follow-up, standard for post-fire mapping and archive for the pre-fire baseline.
Post-Fire Mapping
Captured within 7 days | 30cm to 2m
30cm new tasking:
USD 30/km² (min. 100 km²)
50cm new tasking:
USD 20/km² (min. 100 km²)
For burned area, burn severity and recovery mapping after containment.
Get a QuoteFastest response
Active Fire Emergency
Tasked immediately | imagery within 24 hours
30cm emergency:
USD 80/km²
50cm emergency:
USD 66/km²
For active fires, spread tracking and evacuation decisions.
Request Emergency CapturePriority Tasking
Captured in 3 to 5 days | 30cm and 50cm
30cm priority:
USD 45/km²
50cm priority:
USD 37/km²
For containment checks, fire line review and damage verification.
Get Priority TaskingPre-Fire Baseline
Archive before image | 30cm to 2m
30cm archive:
USD 20/km² (min. 25 km²)
2m archive:
USD 1/km² (min. 25 km²)
Delivered within 48 hours of order approval.
Order the Before ImageWhat changes a wildfire quote
Sensor: optical prices above; thermal hotspot monitoring and SAR are quoted per event or per fire season
Area: new tasking from 100 km², archive from 25 km²
Smoke and cloud: SAR is added when smoke blocks optical imaging
Analysis: burned area, burn severity, loss reports and fire risk maps quoted with the imagery
Monitoring: single event, fire season or year-round national programme
Wildfire products
Wildfire Detection, Analysis and Recovery Products
Twelve products cover every stage of a fire, from risk mapping to restoration. Each one is delivered georeferenced and ready for your GIS, incident map or report. Swipe or use the arrows to see them all.
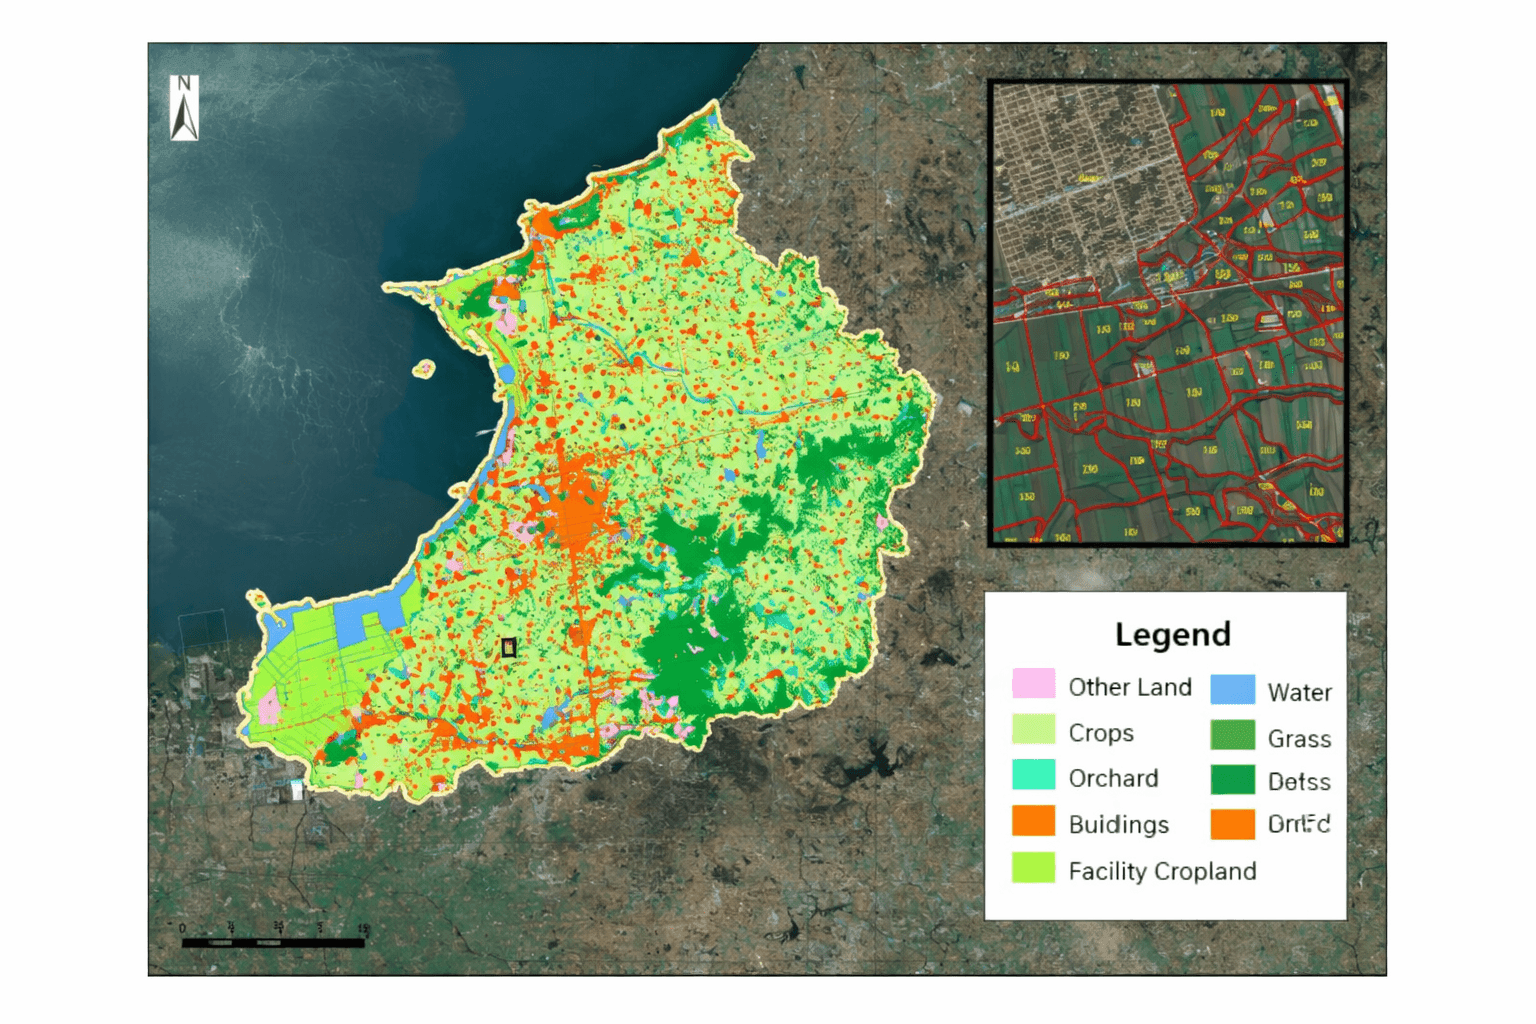
Fire risk and fuel load maps
NDVI, NDMI, land cover, slope
Shows where vegetation is dry and dense enough to burn, combined with slope, weather and past burn scars. Why it matters: crews, budgets and fuel reduction go to the zones most likely to burn.
Used by forest agencies, emergency planners and fire prevention teams
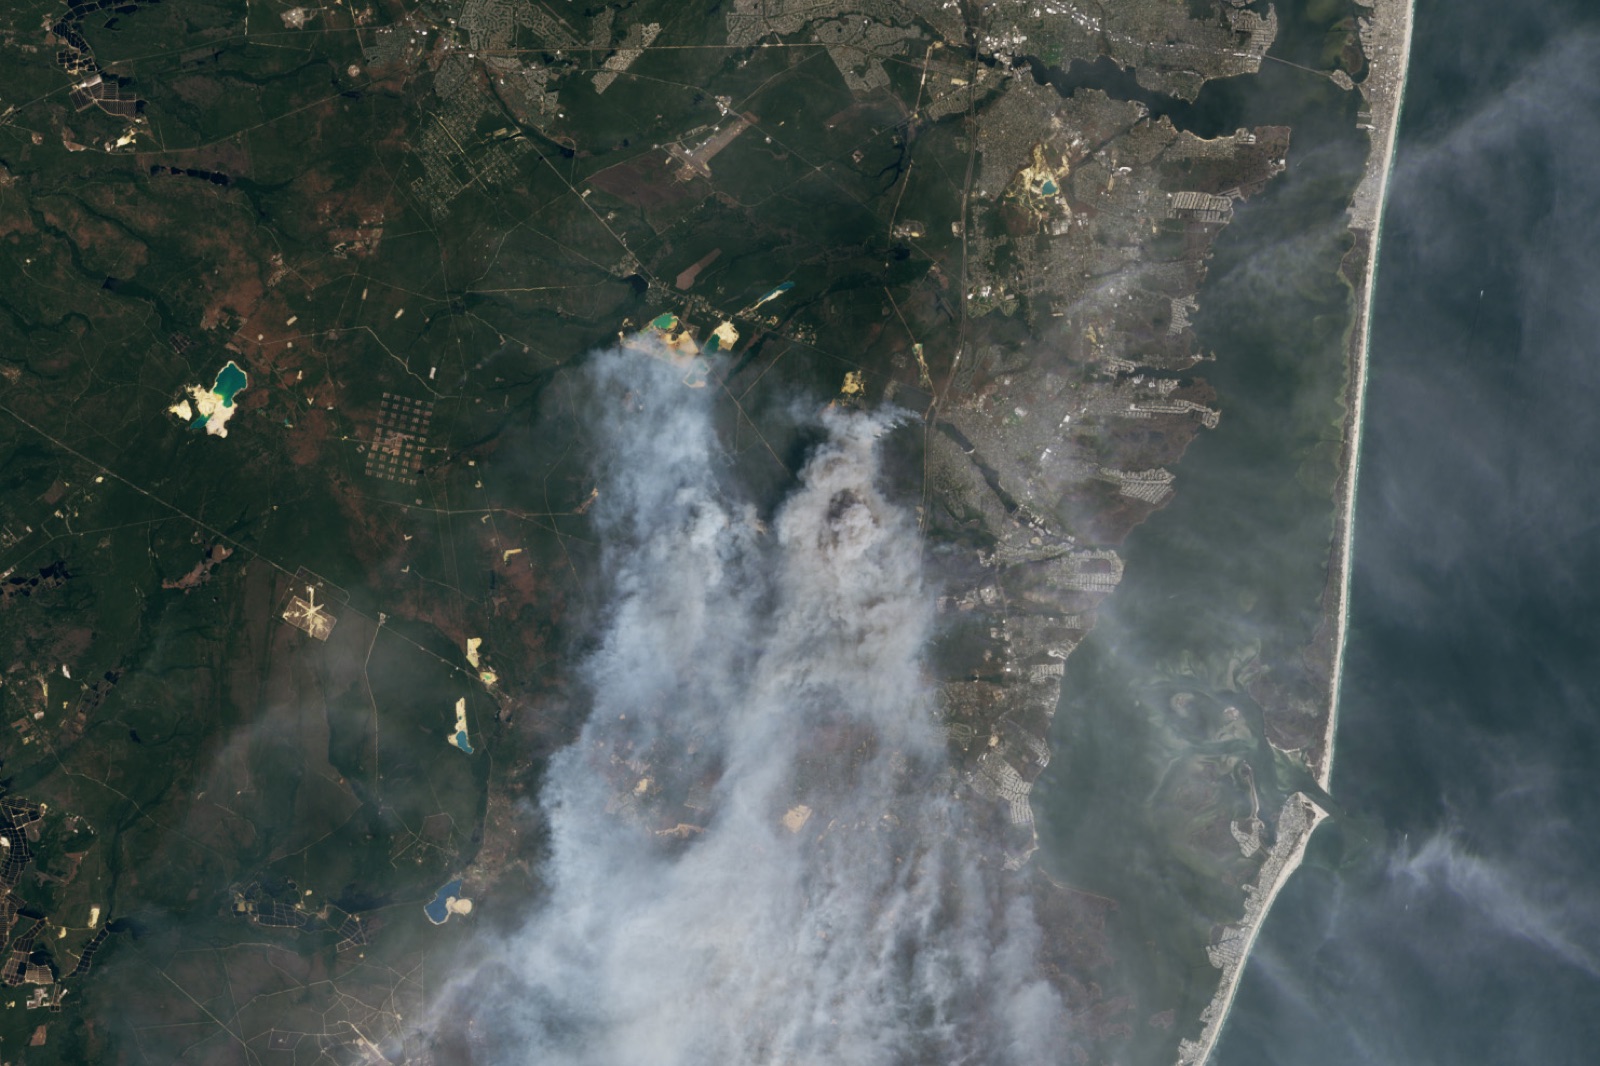
Fire prevention planning
Firebreaks and prescribed burns
Vegetation density, access roads and distance to homes and infrastructure show where to cut firebreaks and when to run prescribed burns. Why it matters: prevention is planned with data instead of guesswork.
Used by land managers, municipal planners and Indigenous communities
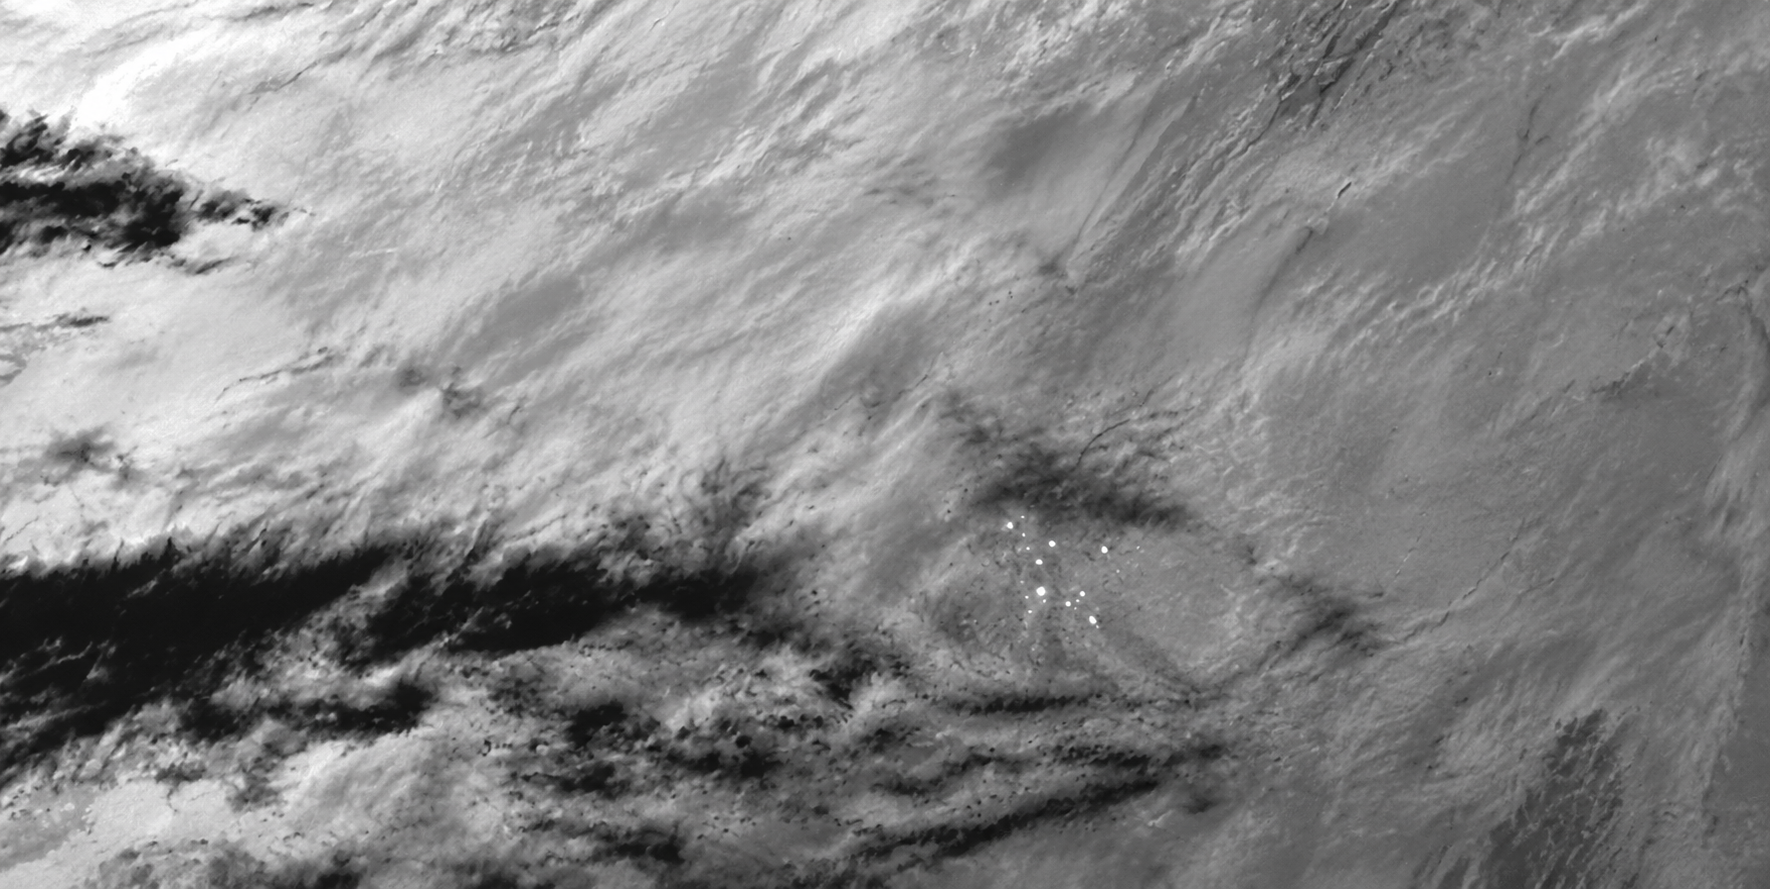
Active fire hotspot alerts
Thermal infrared
Mid-wave infrared finds heat anomalies far smaller than a pixel, even in remote, hard-to-reach forests, and alarms go out automatically with location, time and confidence. Why it matters: new fires are found while they are still small. See GF-4 satellite imagery.
Used by fire services and emergency command centres
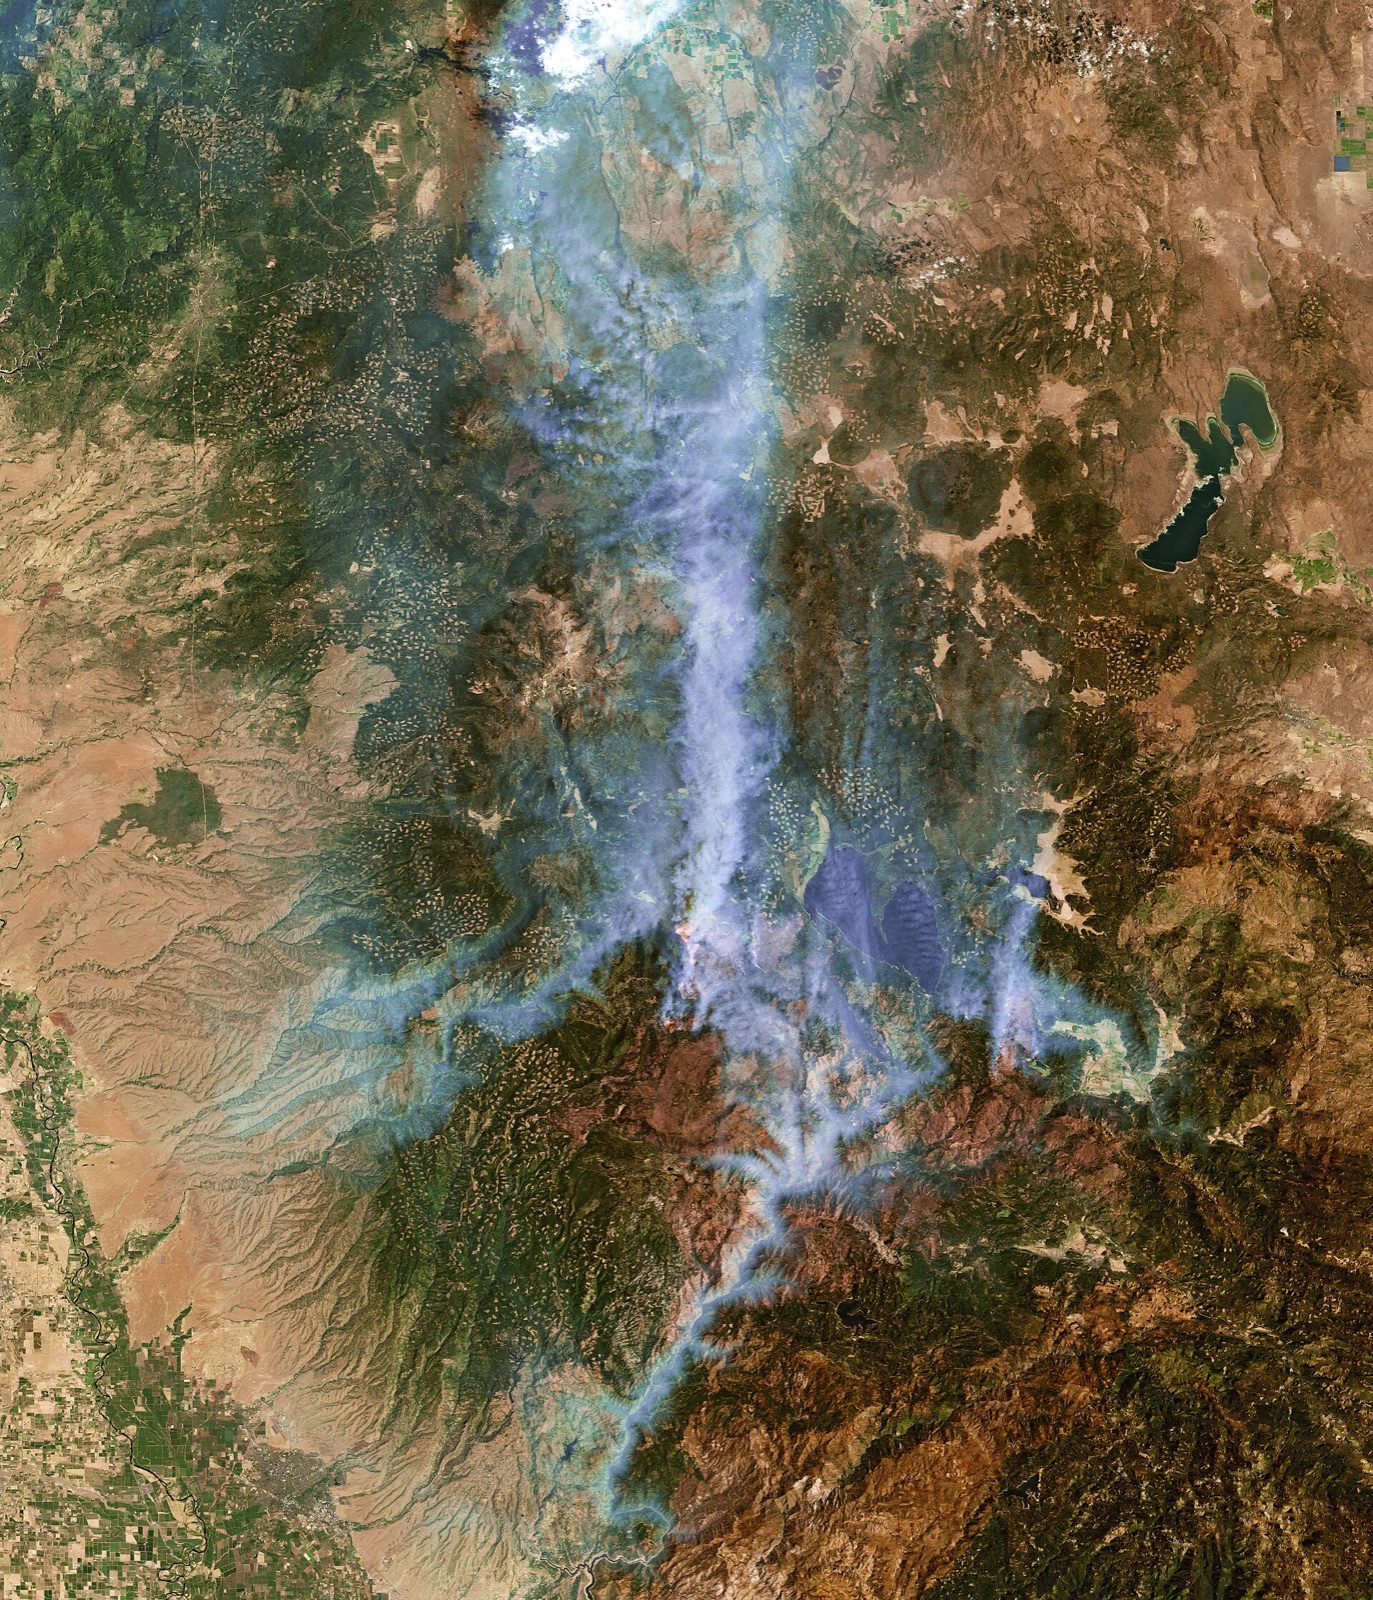
Fire point verification
Sub-metre to 2m
High-resolution optical imagery confirms each hotspot is a vegetation fire, not a factory, gas flare or sun glint. Why it matters: crews and aircraft are not sent to false alarms.
Within 24 hours on emergency tasking
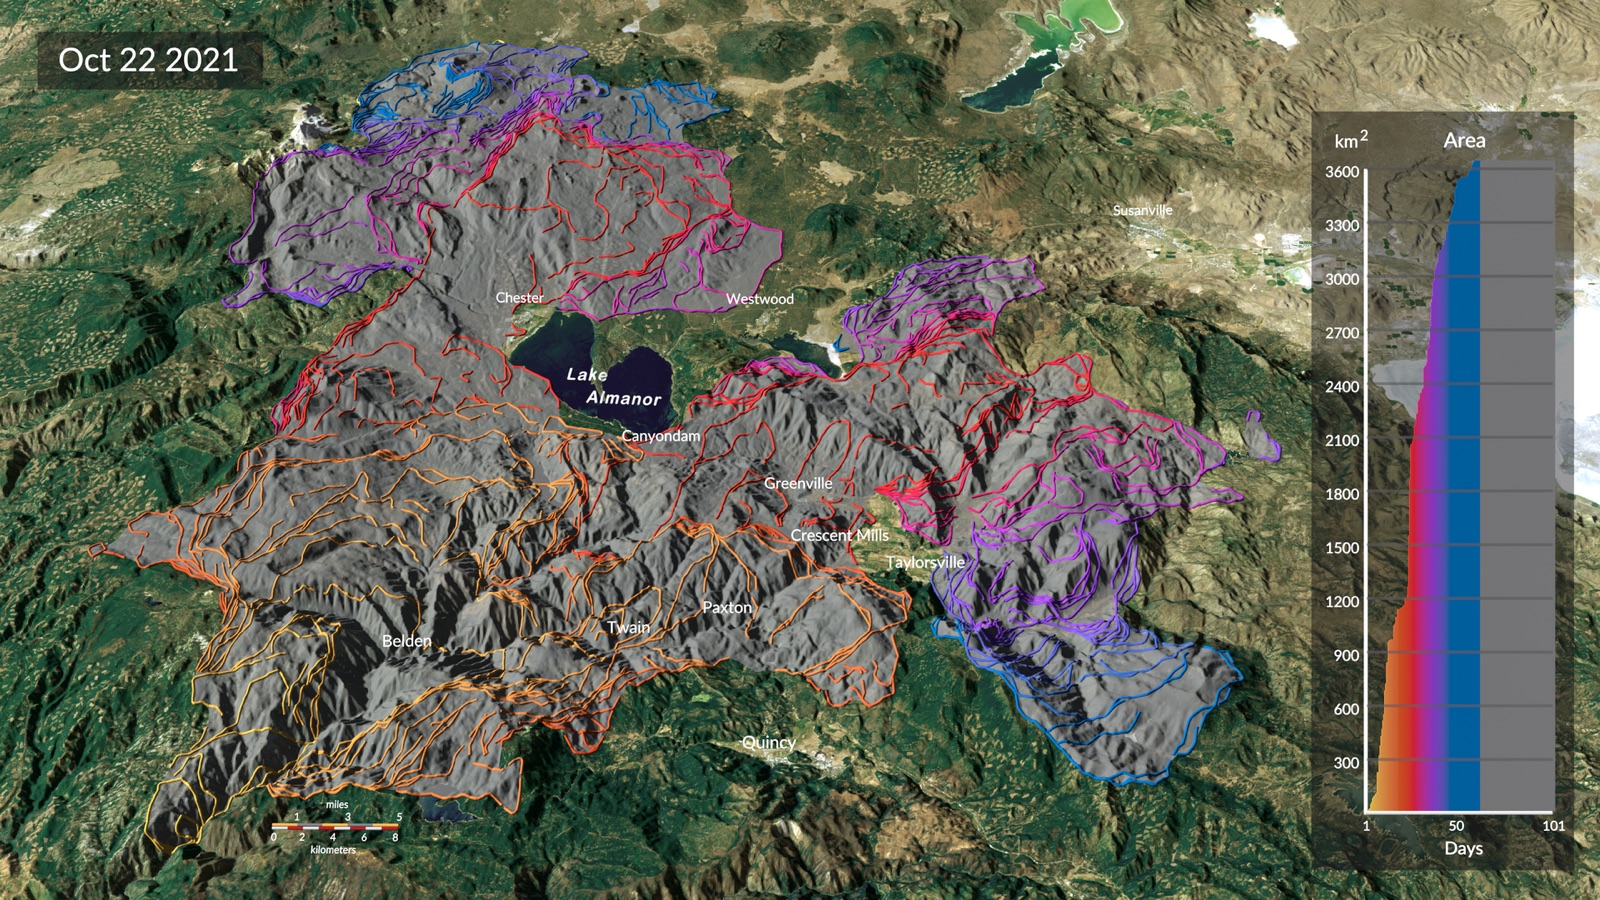
Fire spread analysis
Perimeters and prediction
The fire perimeter is mapped pass by pass and combined with wind, terrain and fuel to estimate spread direction and speed for the next hours and days. Why it matters: evacuations start in time and crews are positioned ahead of the fire.
Used by incident commanders and evacuation planners
Fire behaviour and smoke modelling
Satellite and weather
Satellite observations are combined with weather and terrain to model fire intensity and smoke movement. Why it matters: public health warnings, road closures and safe aircraft routes are based on where the smoke is going.
Used by fire behaviour analysts and air quality agencies
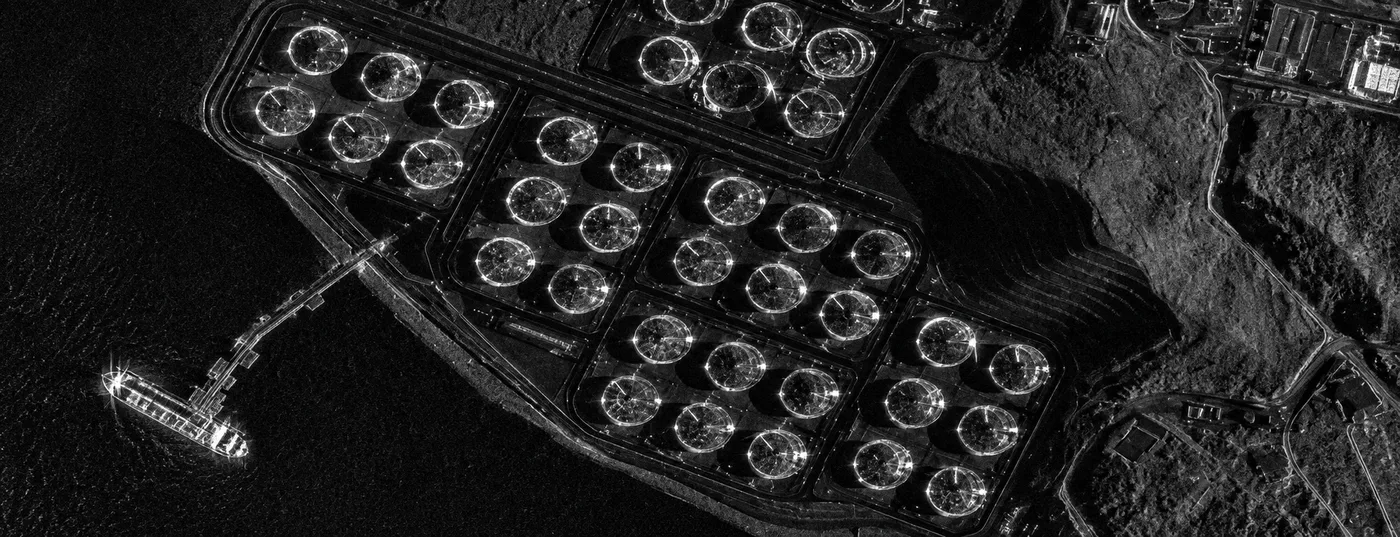
All-weather SAR monitoring
C-band and L-band radar
Radar images through smoke, cloud and darkness, so the fire area stays under watch when optical satellites see only smoke. Why it matters: no blind nights or smoky days. See how radar sees through cloud.
GF-3 at 1m, LT-1 at 3m
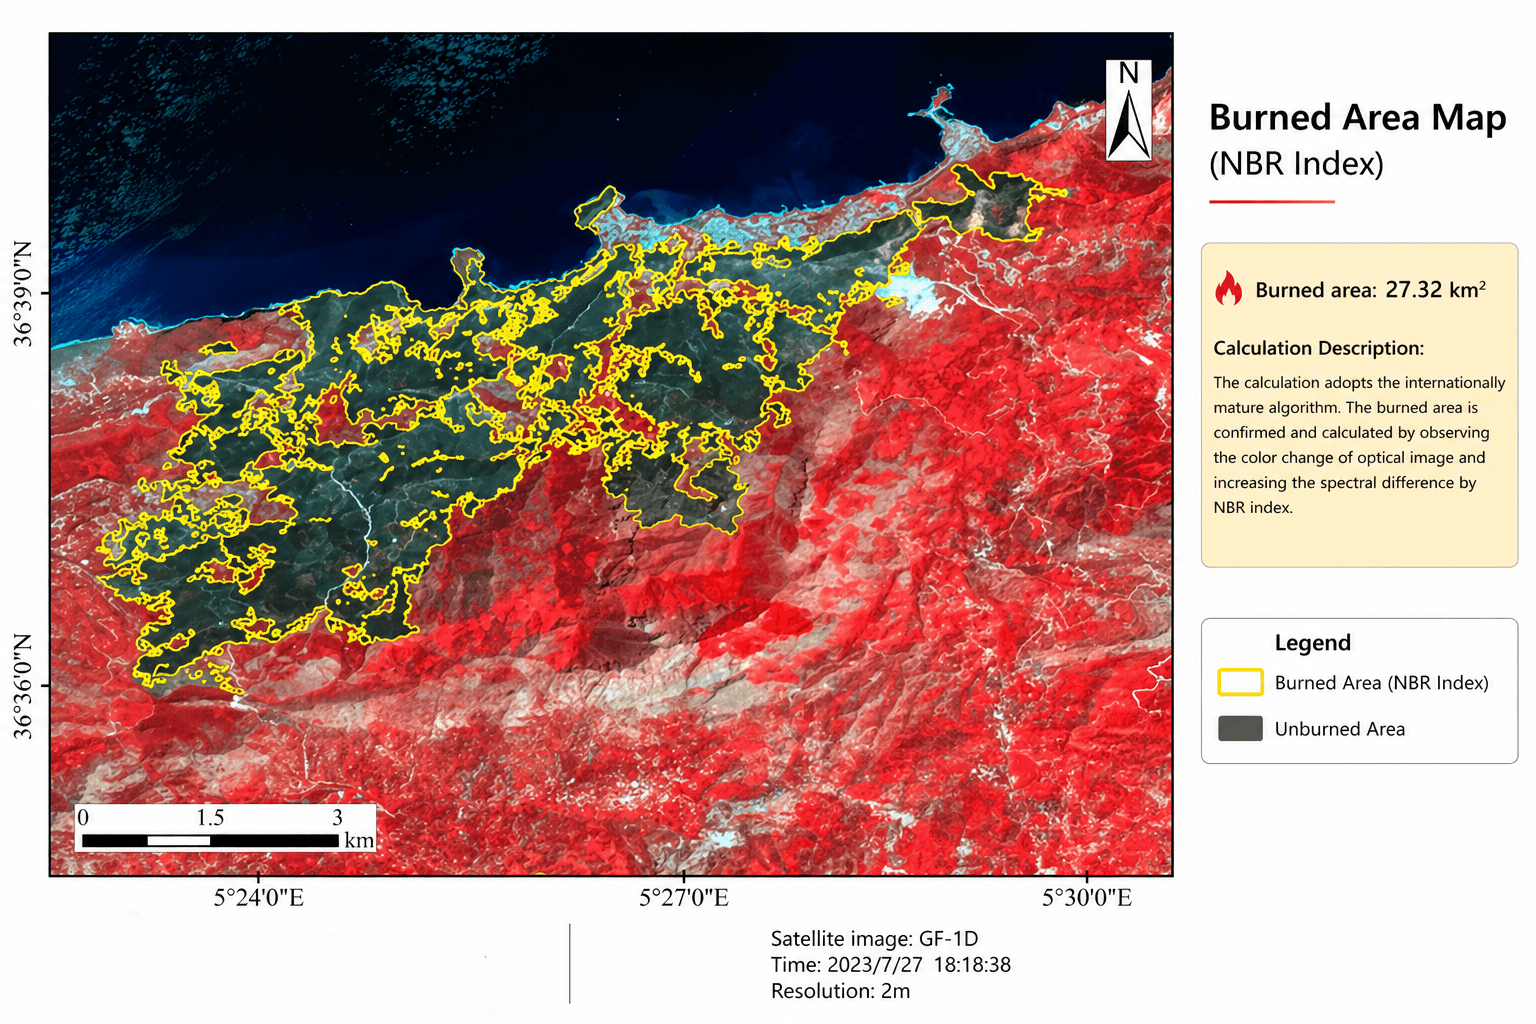
Burned area mapping
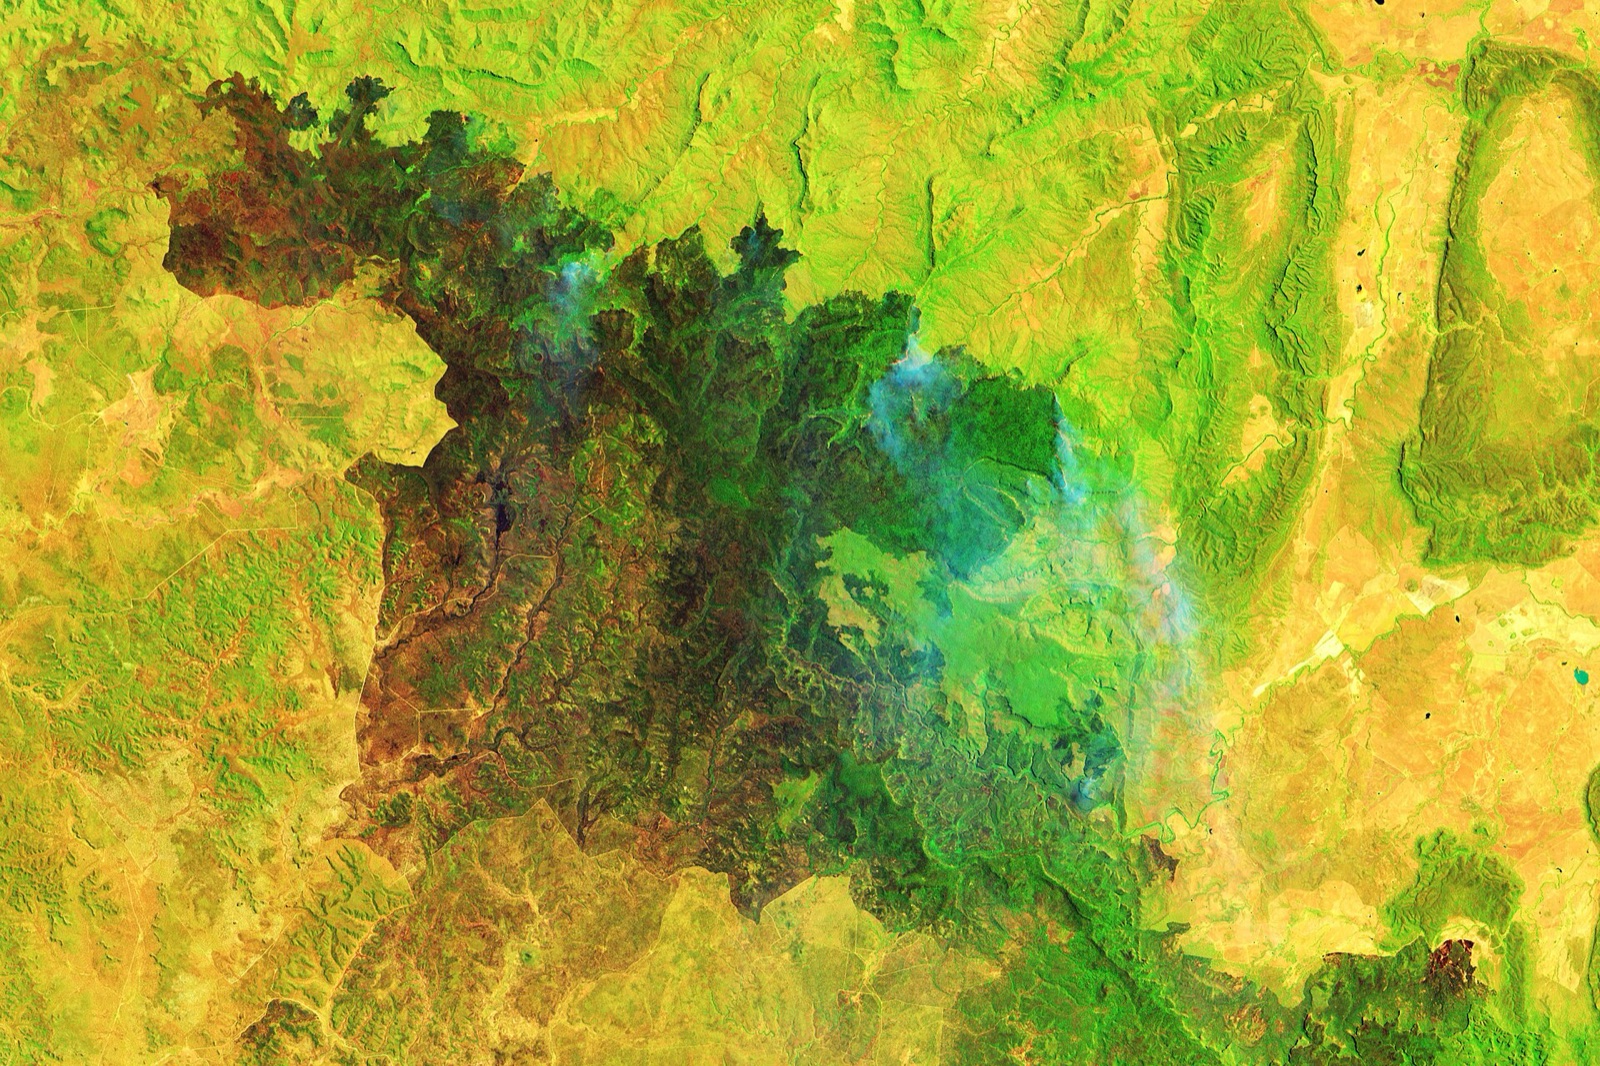
NBR and BAI
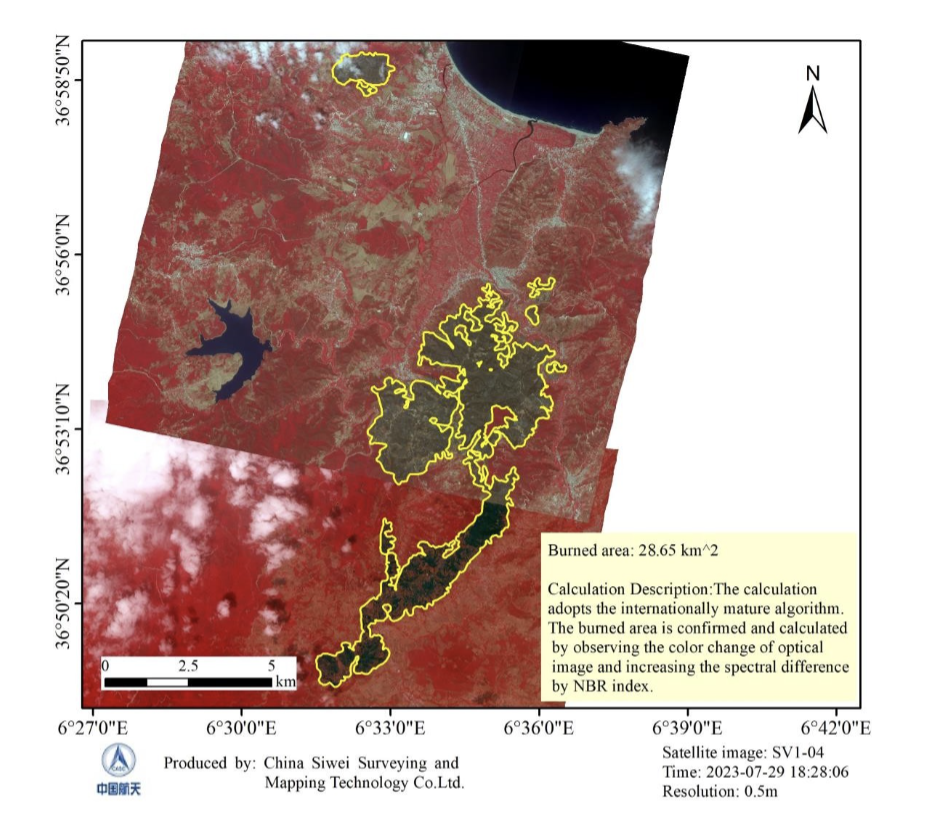
Burned land shows lower near-infrared and higher short-wave infrared reflectance, so burned and unburned zones are outlined and measured. Why it matters: one objective measure of the fire for recovery work, insurance claims and ecological studies.
Area in hectares and km², SHP and KML boundaries
Burn severity and damage assessment
dNBR and 50cm imagery
Before and after imagery classifies burn severity and counts damaged buildings, roads, power lines and forest stock within days of containment. Why it matters: faster claims, funding and repair priorities.
Used by recovery agencies, insurers and loss adjusters
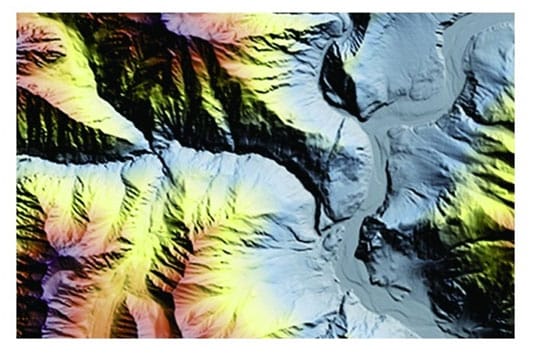
Restoration and recovery planning
Severity, slope, soil, water
Burn severity is combined with slope, soil and drainage to flag erosion, landslide and debris flow risk and to rank areas for replanting and habitat repair. Why it matters: restoration money goes where it has the most effect. See DEM services.
Used by land agencies, NGOs and conservation groups
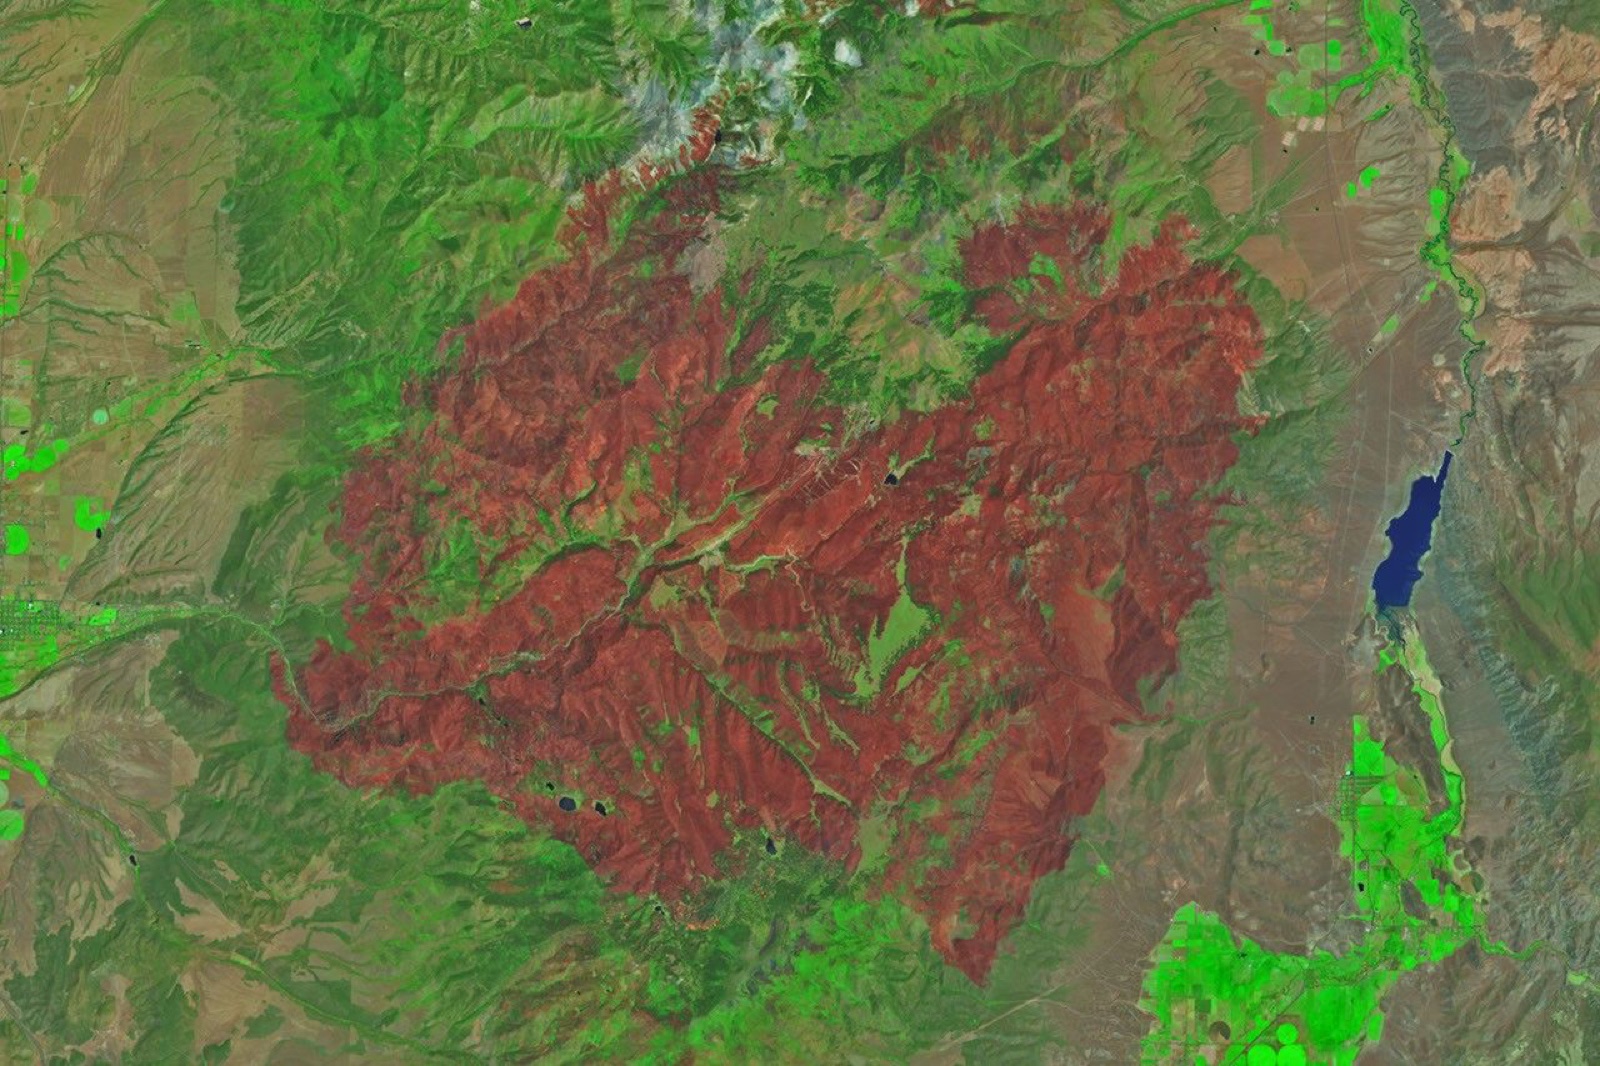
Recovery monitoring and change detection
Time series
Vegetation indices are tracked month by month to measure regrowth, reforestation and ecosystem health, and compared with more than 25 years of archive. Why it matters: proof that recovery is working, fire history for future risk, and data for sustainable forestry.
Monthly, seasonal or yearly updates
Thematic maps and fire reports
Ready for leadership
Affected range, burned area, severity and statistics are published as clear thematic maps and a written fire report. Why it matters: leaders, donors and insurers get one trusted document.
PDF maps, statistics and GIS layers
Need imagery of an active fire today? Emergency satellite imagery →
Analysis
How to Analyse Wildfires With Satellite Imagery
The same five-step workflow XRTech Group analysts run for every fire, from choosing the area to a finished fire report. Send your area and we run it for you, or take the layers into your own GIS.
Step 1: Set the area of interest and find active fires
Draw or upload the fire area as KML, KMZ, SHP or GeoJSON. Active fire detections and hotspot lists show where fire activity is right now, so imagery is searched and tasked only where it matters.
Who it is for
Who Uses Satellite Wildfire Monitoring
Each team asks a different question during fire season. Here is what each one needs from satellite data and how XRTech Group delivers it.
Fire Departments and Wildland Fire Services
Fire chiefs and wildland crews need to know where the fire is now, where it is heading and which roads and water sources are still usable. XRTech Group sends hotspot alerts, fire perimeter maps and fresh high-resolution imagery of the fire line, ready to load into your GIS or incident map.
• Active fire perimeter and hotspot maps
• Spread direction from wind, slope and fuel
• Access roads, water sources and firebreaks
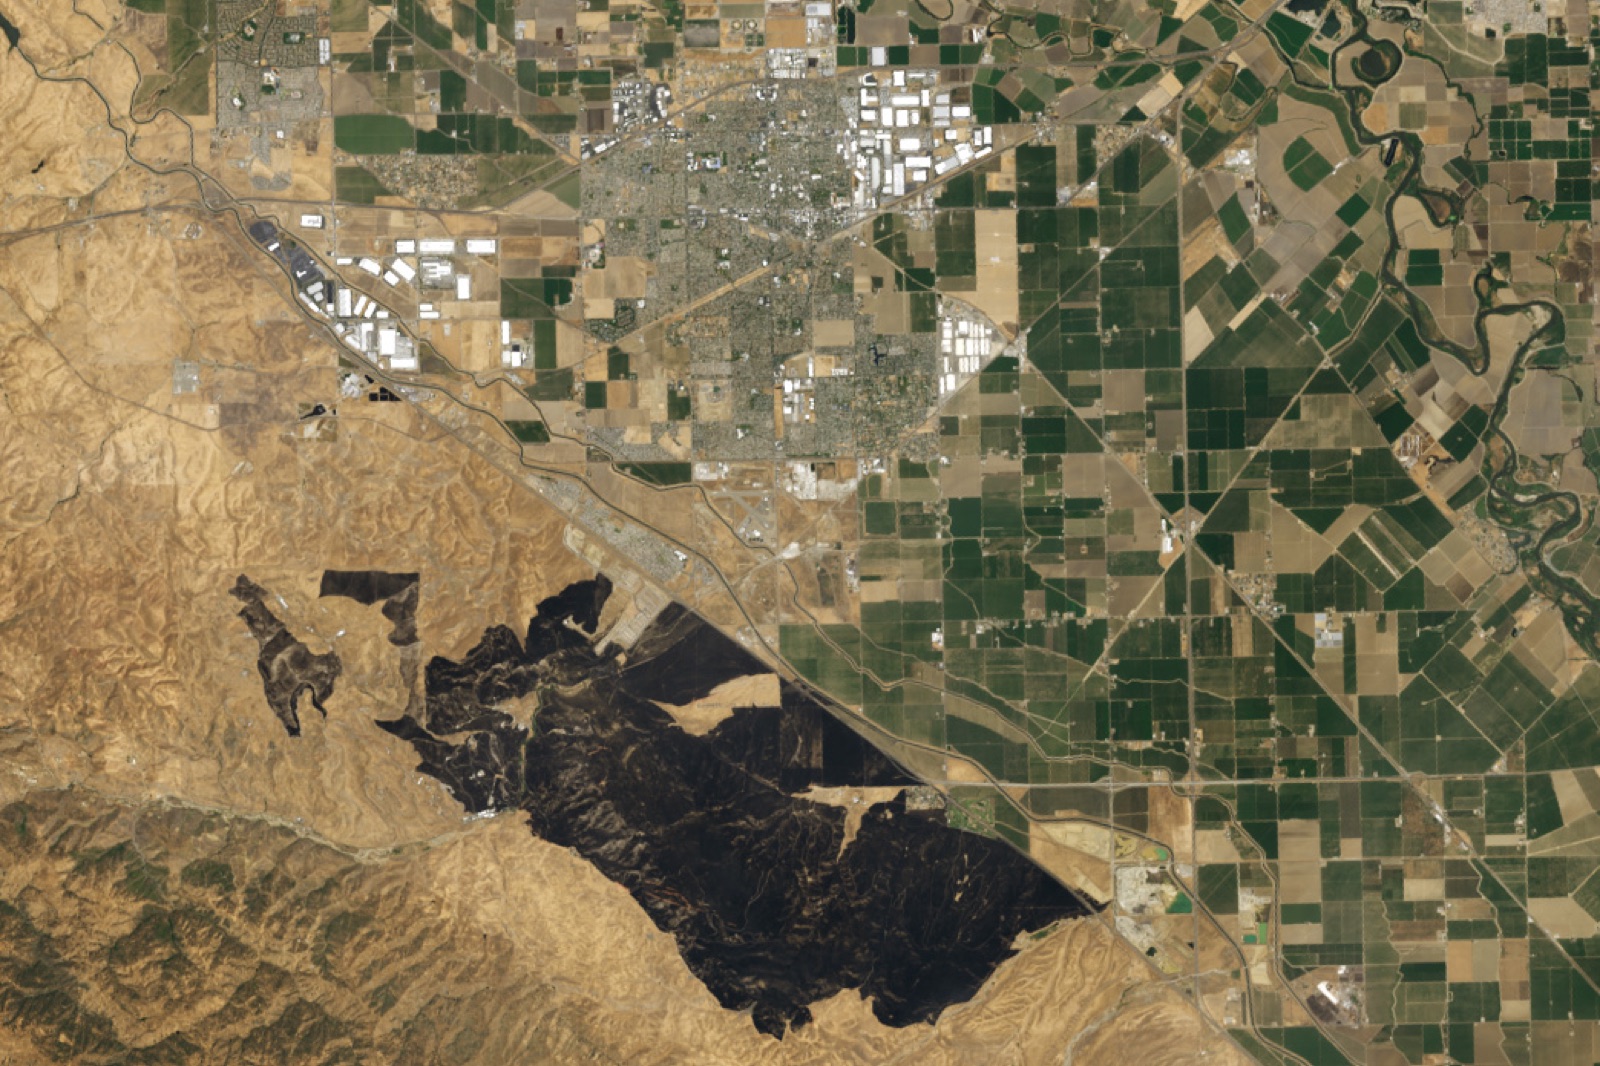
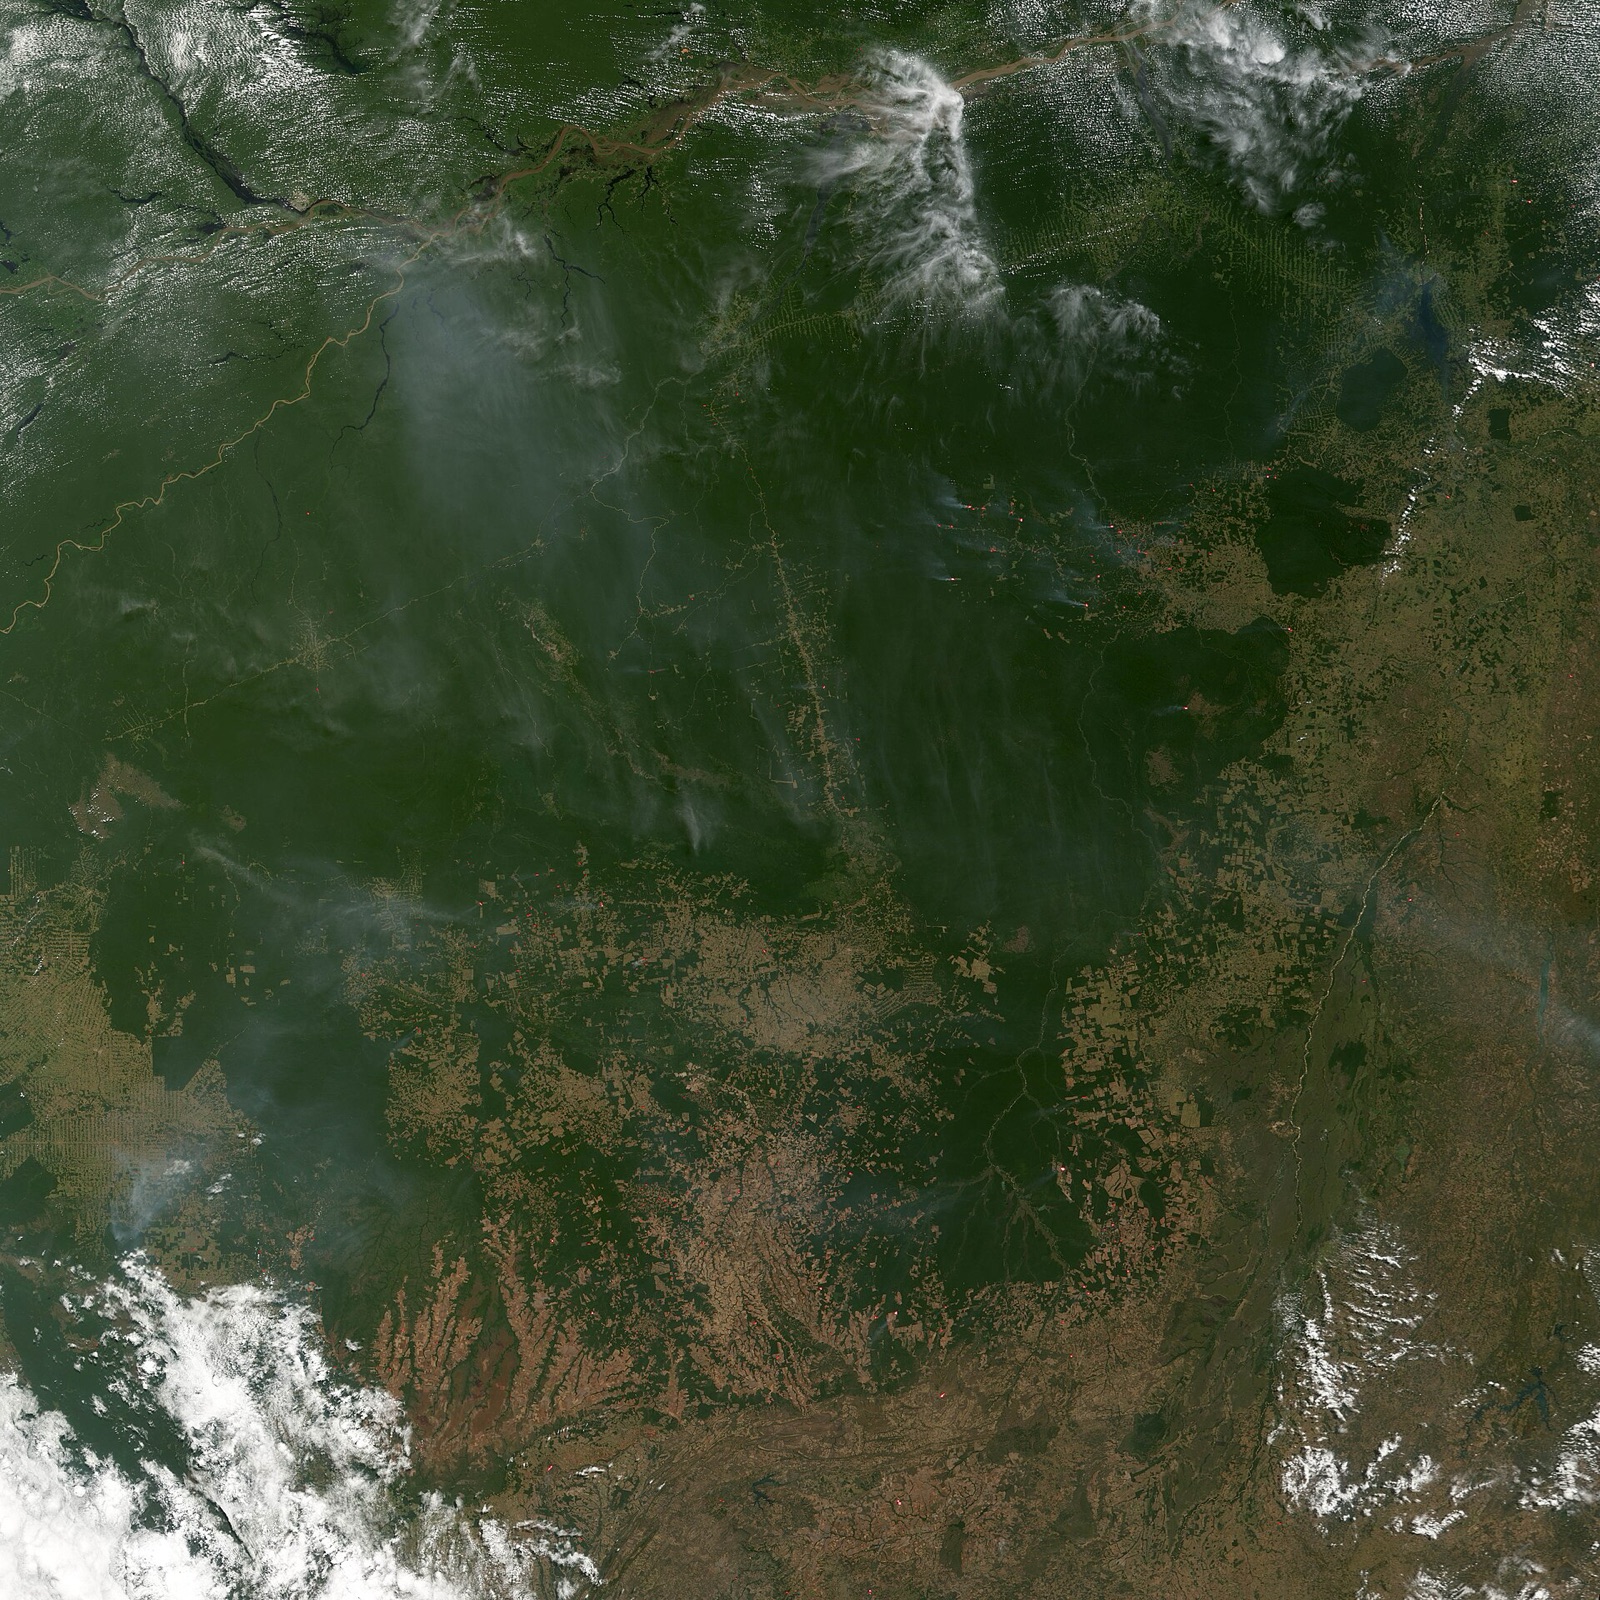
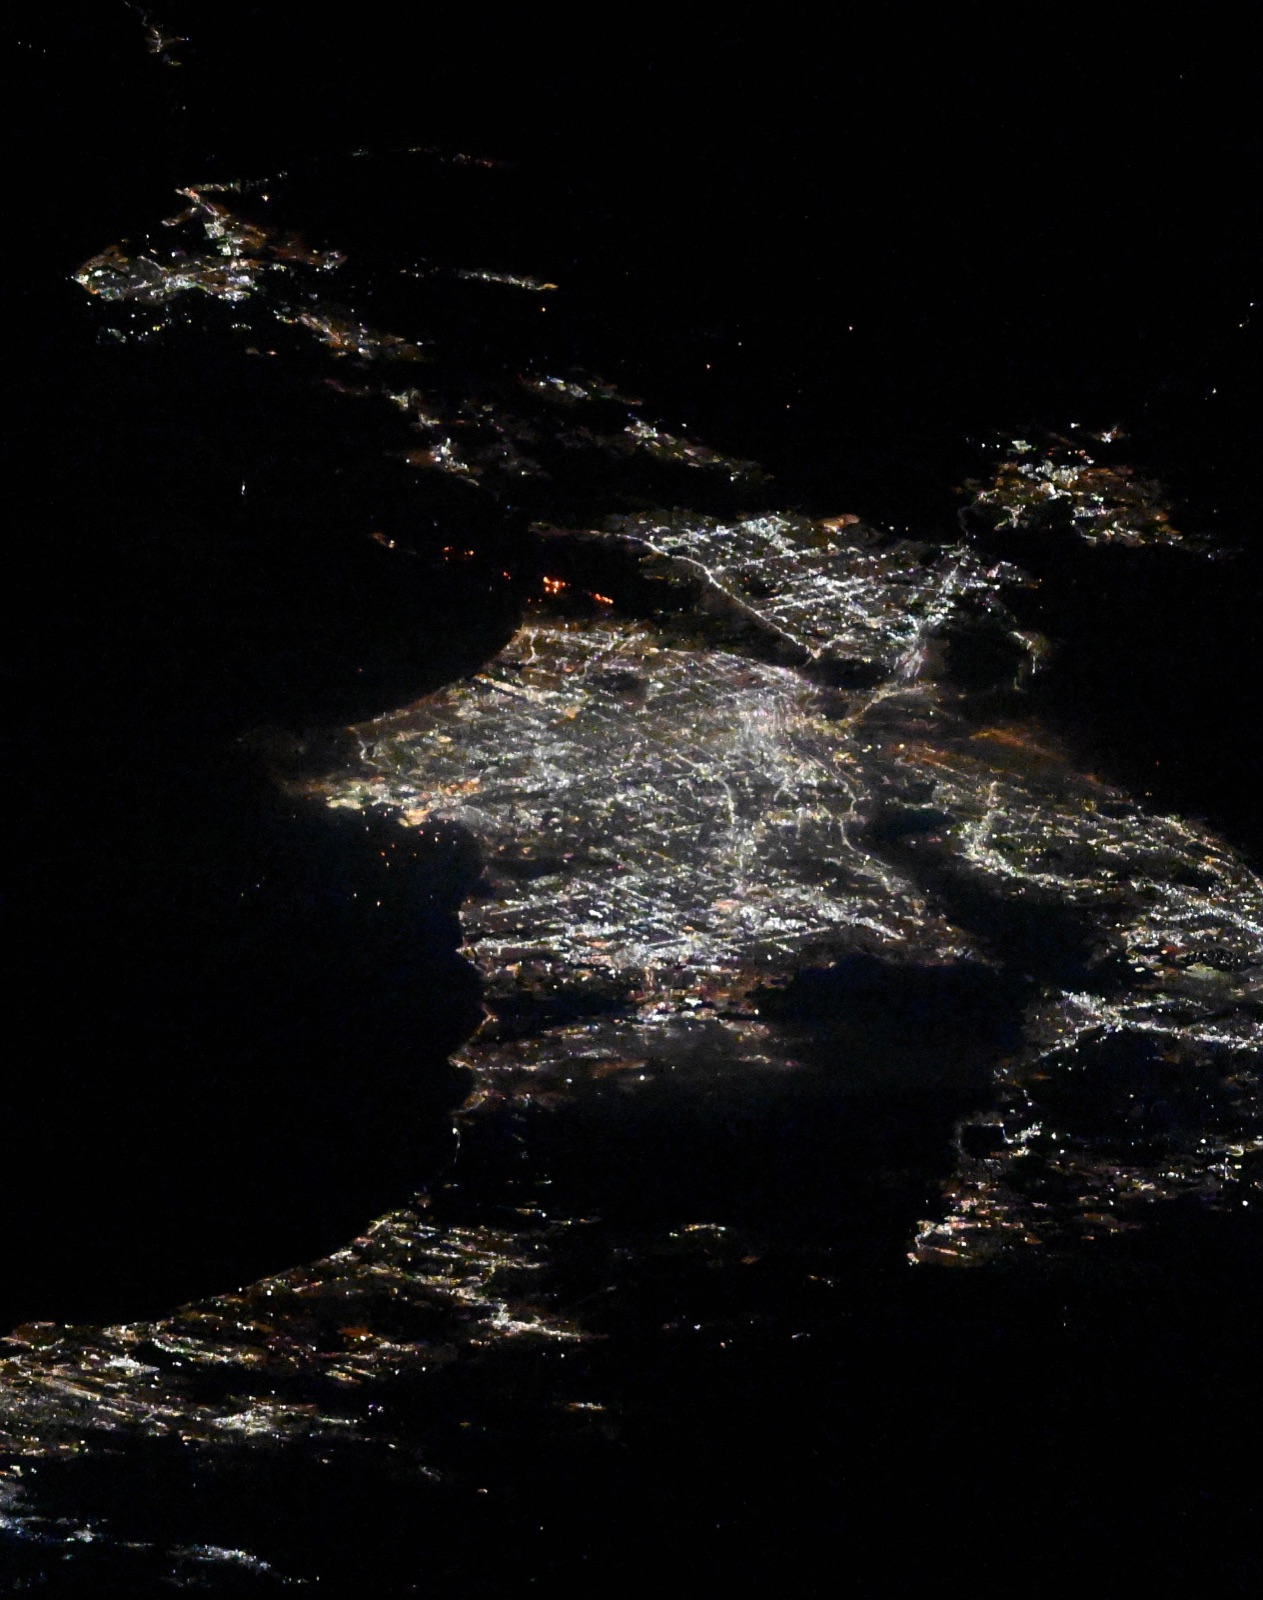
Satellites
Multi-Sensor Fire Detection From Geostationary Orbit to Radar
No single satellite sees everything about a fire. XRTech Group combines staring thermal sensors for detection, high-resolution optical imagery for confirmation and mapping, and radar that sees through smoke, then dispatches them together over the fire area.
✓GF-4 geostationary at 36,000 km: 50m visible and near infrared staring camera plus 400m mid-wave infrared (3.5 to 4.1 µm), refreshed every 20 seconds
✓GF-5B VIMS: mid-wave and long-wave infrared from 3.5 to 12.5 µm at 20m to 40m for surface heat distribution
✓SuperView-1, SuperView-2, CB-04A, GF-1, GF-6, HJ-2A and HJ-2B: optical imaging at sub-metre, 2m and 16m
✓GF-3 C-band SAR at 1m and LT-1 L-band SAR at 3m through smoke, cloud, fog and darkness
✓Emergency dispatch of optical, hyperspectral and radar satellites over the fire area
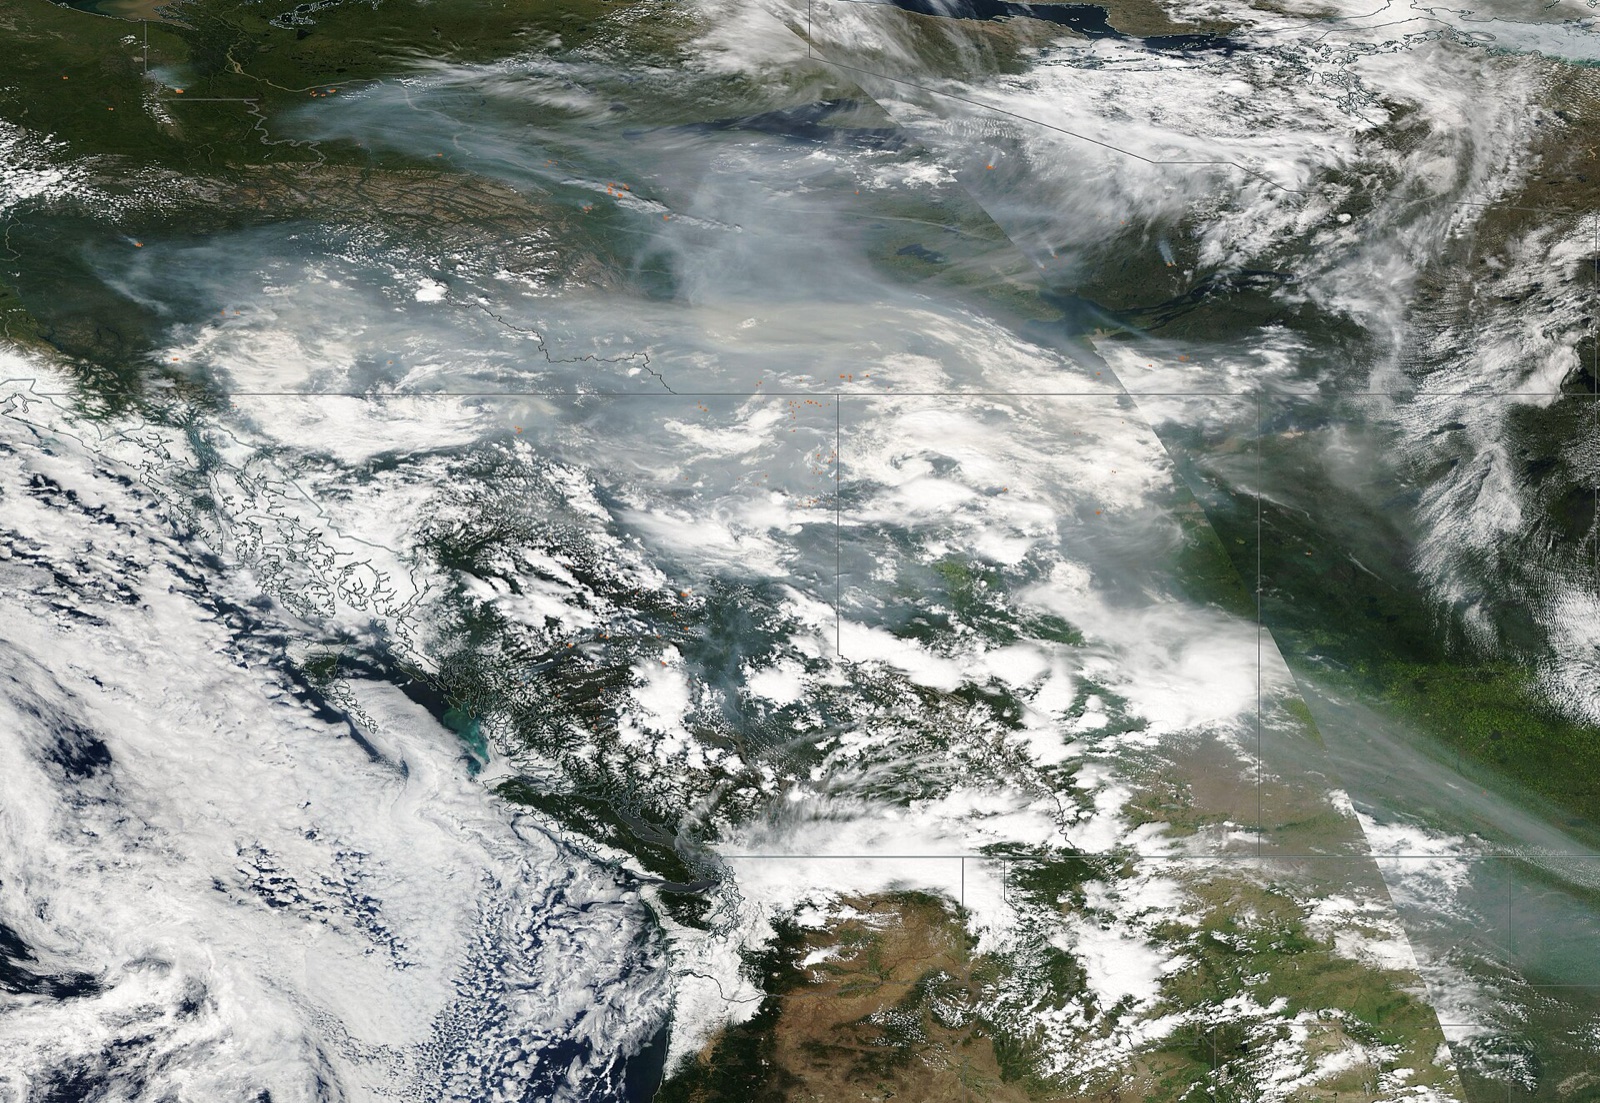
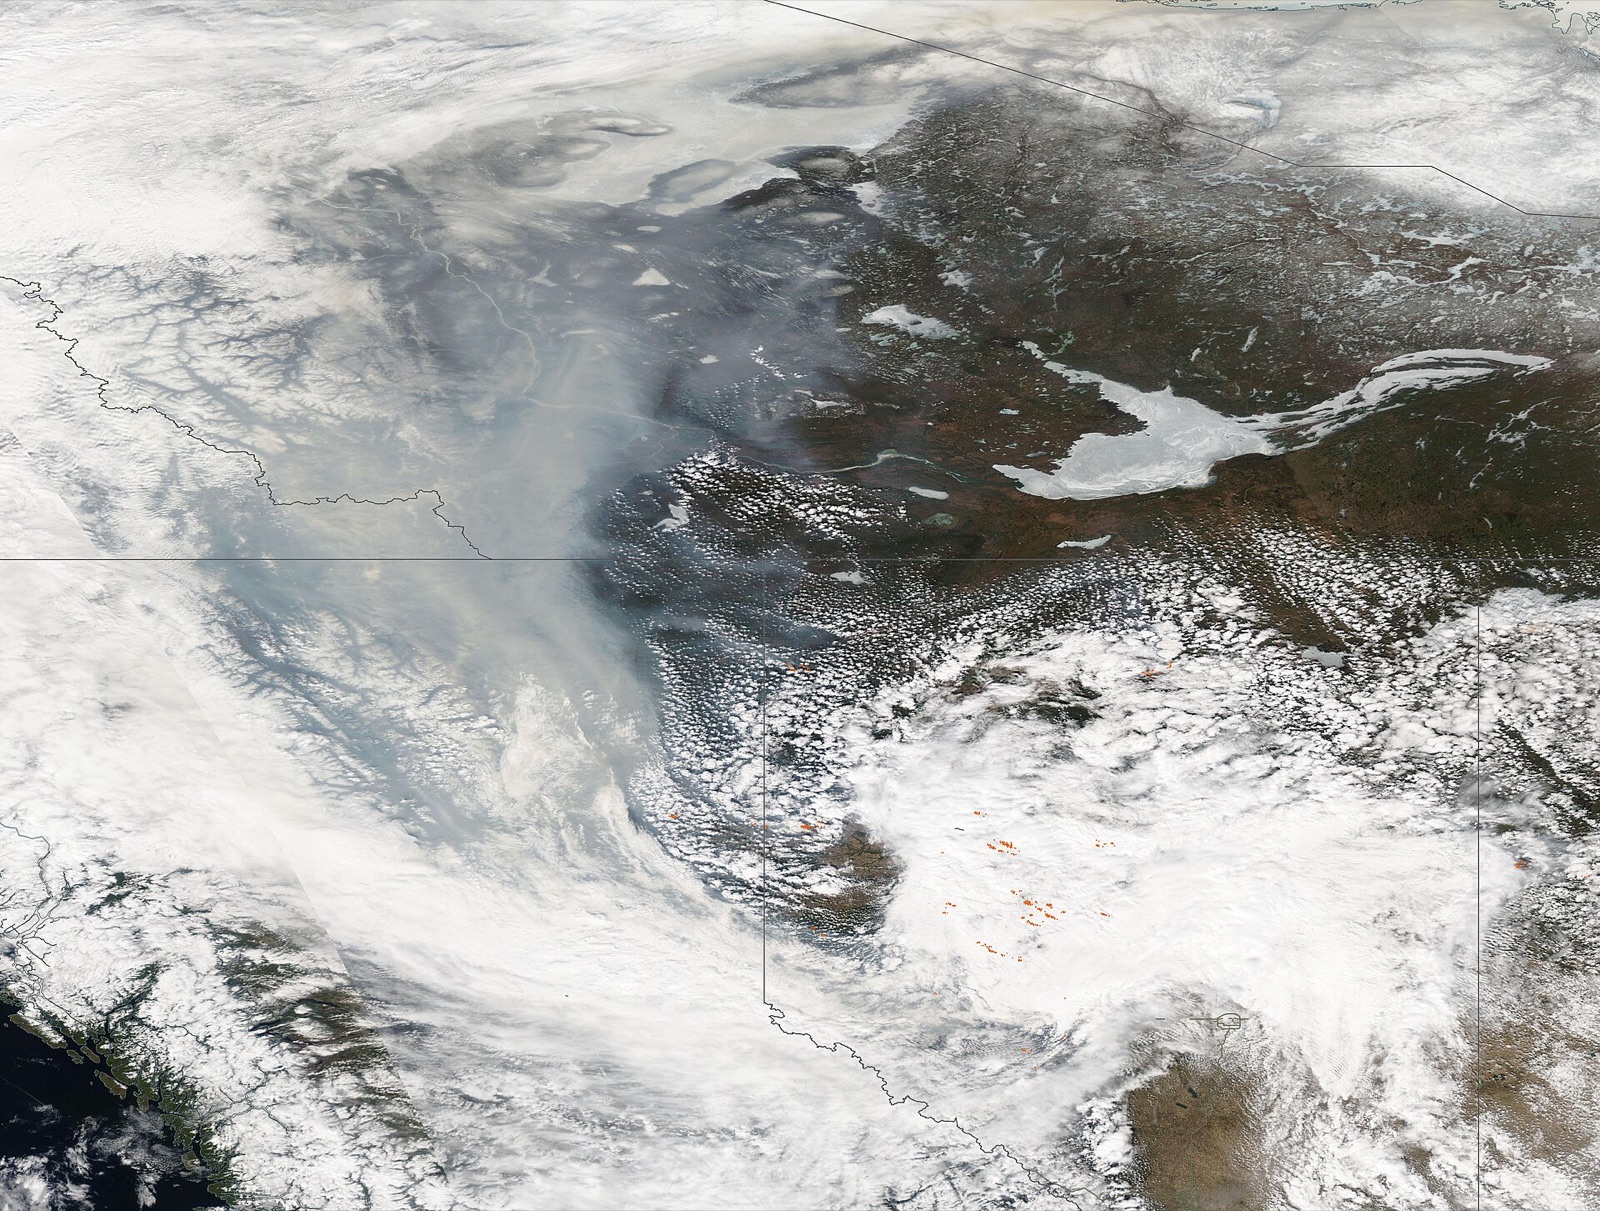
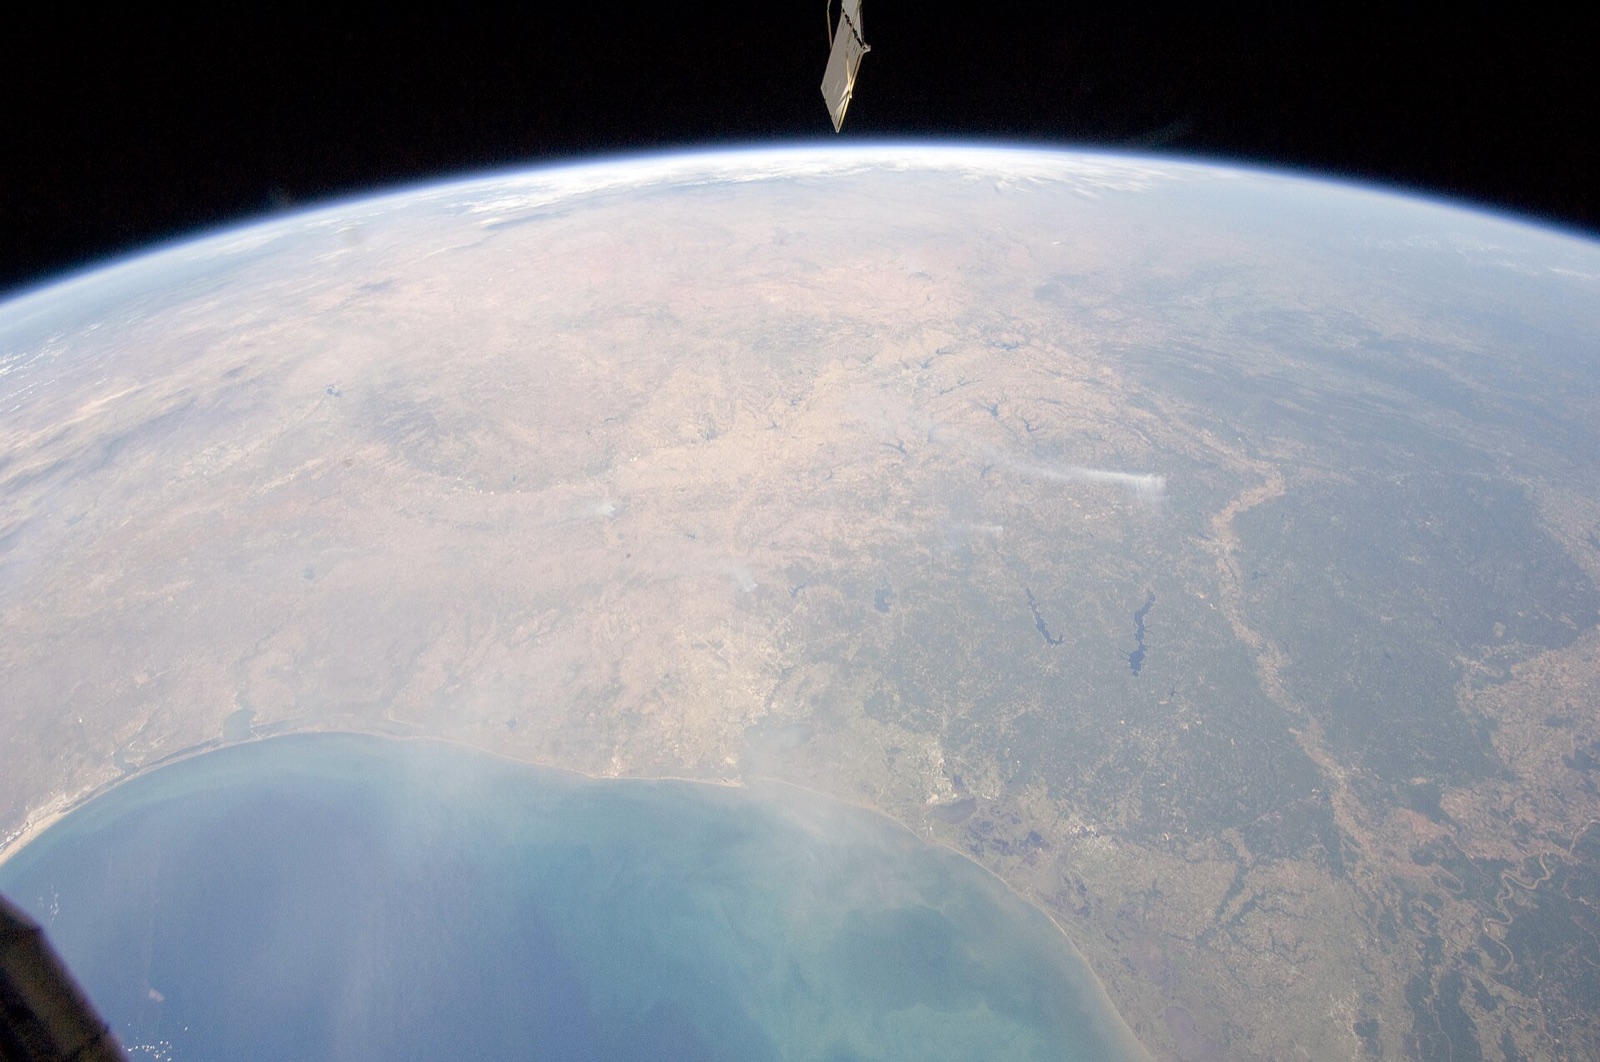
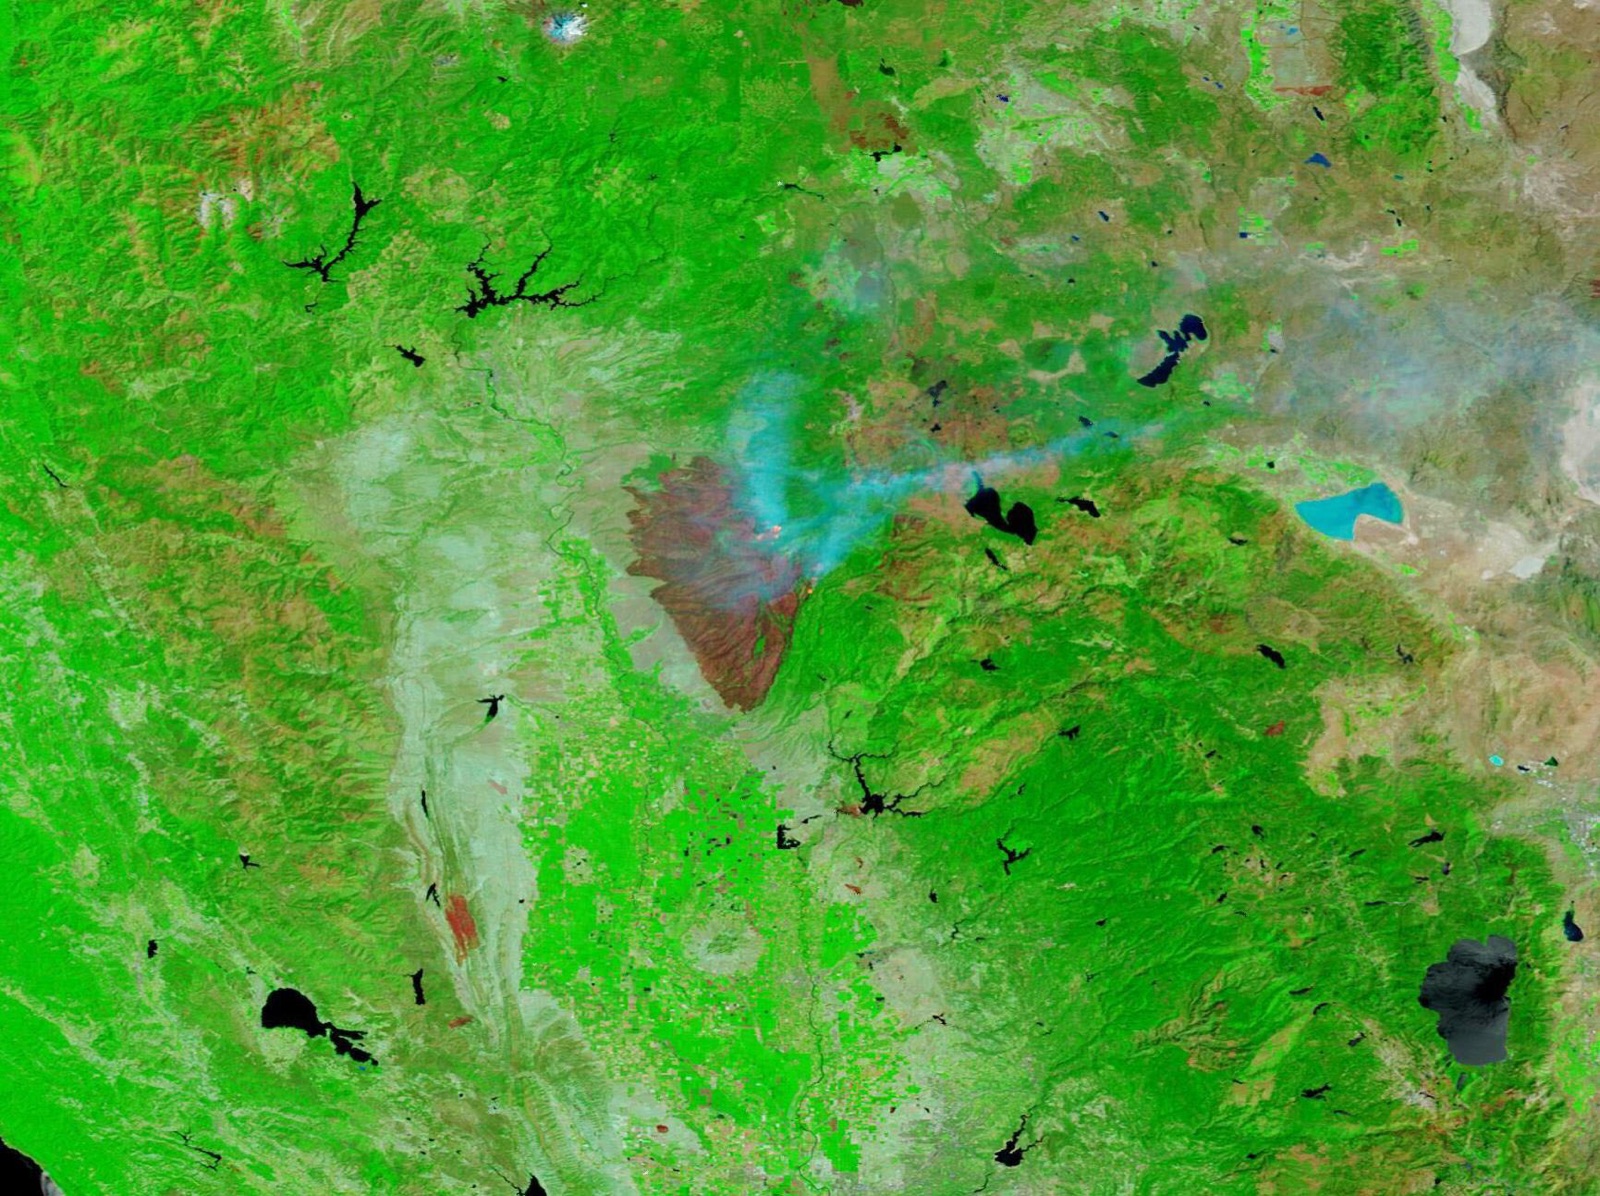
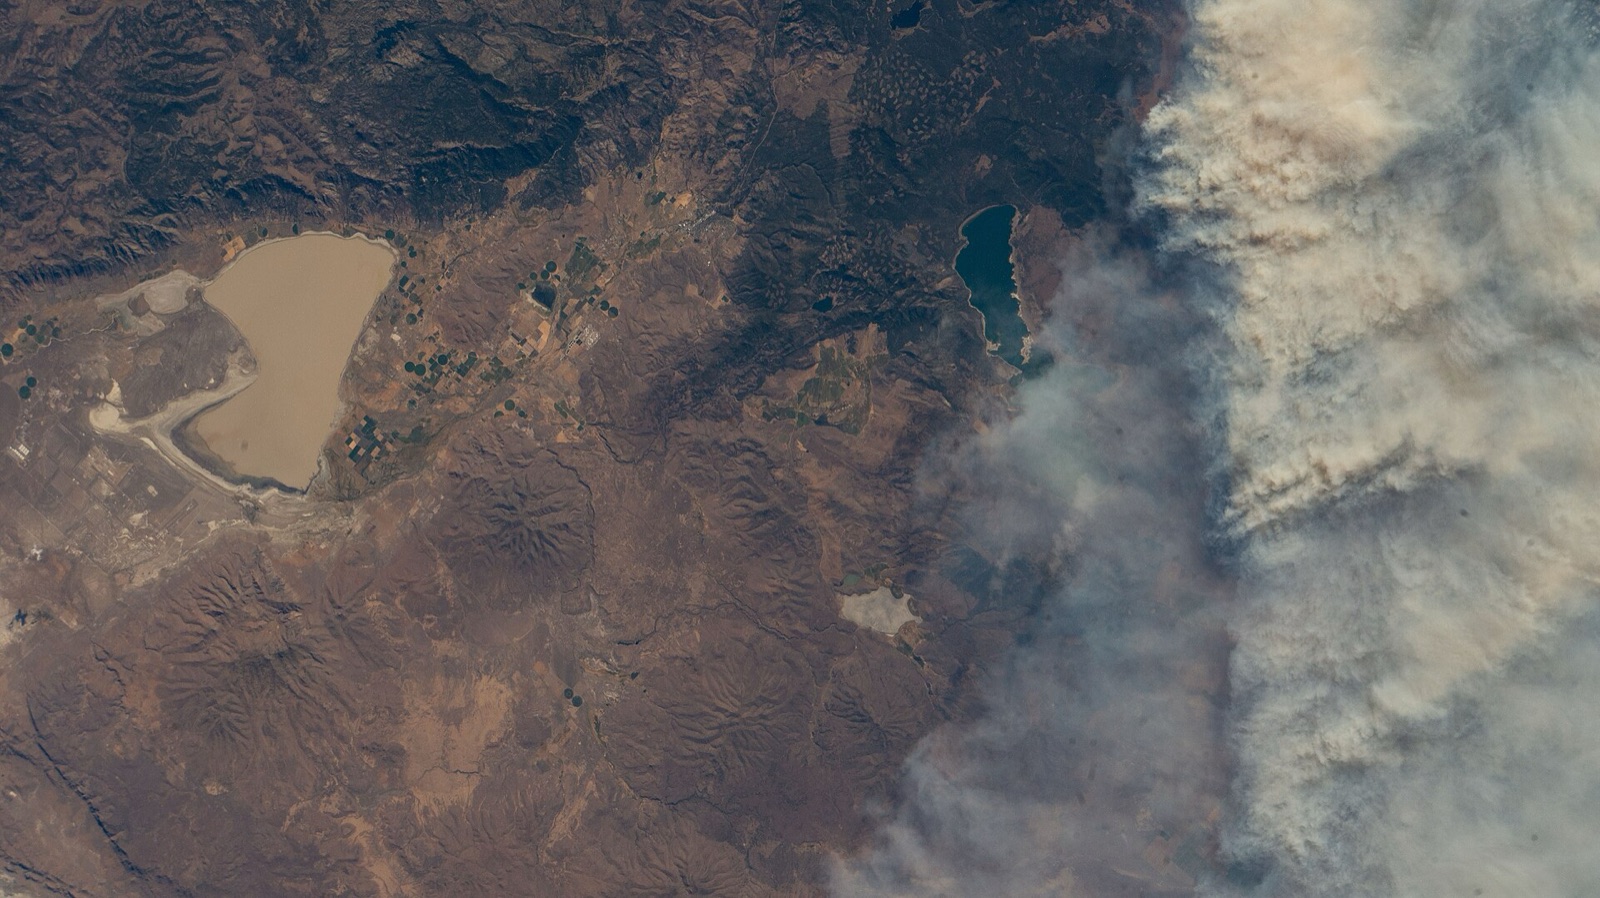
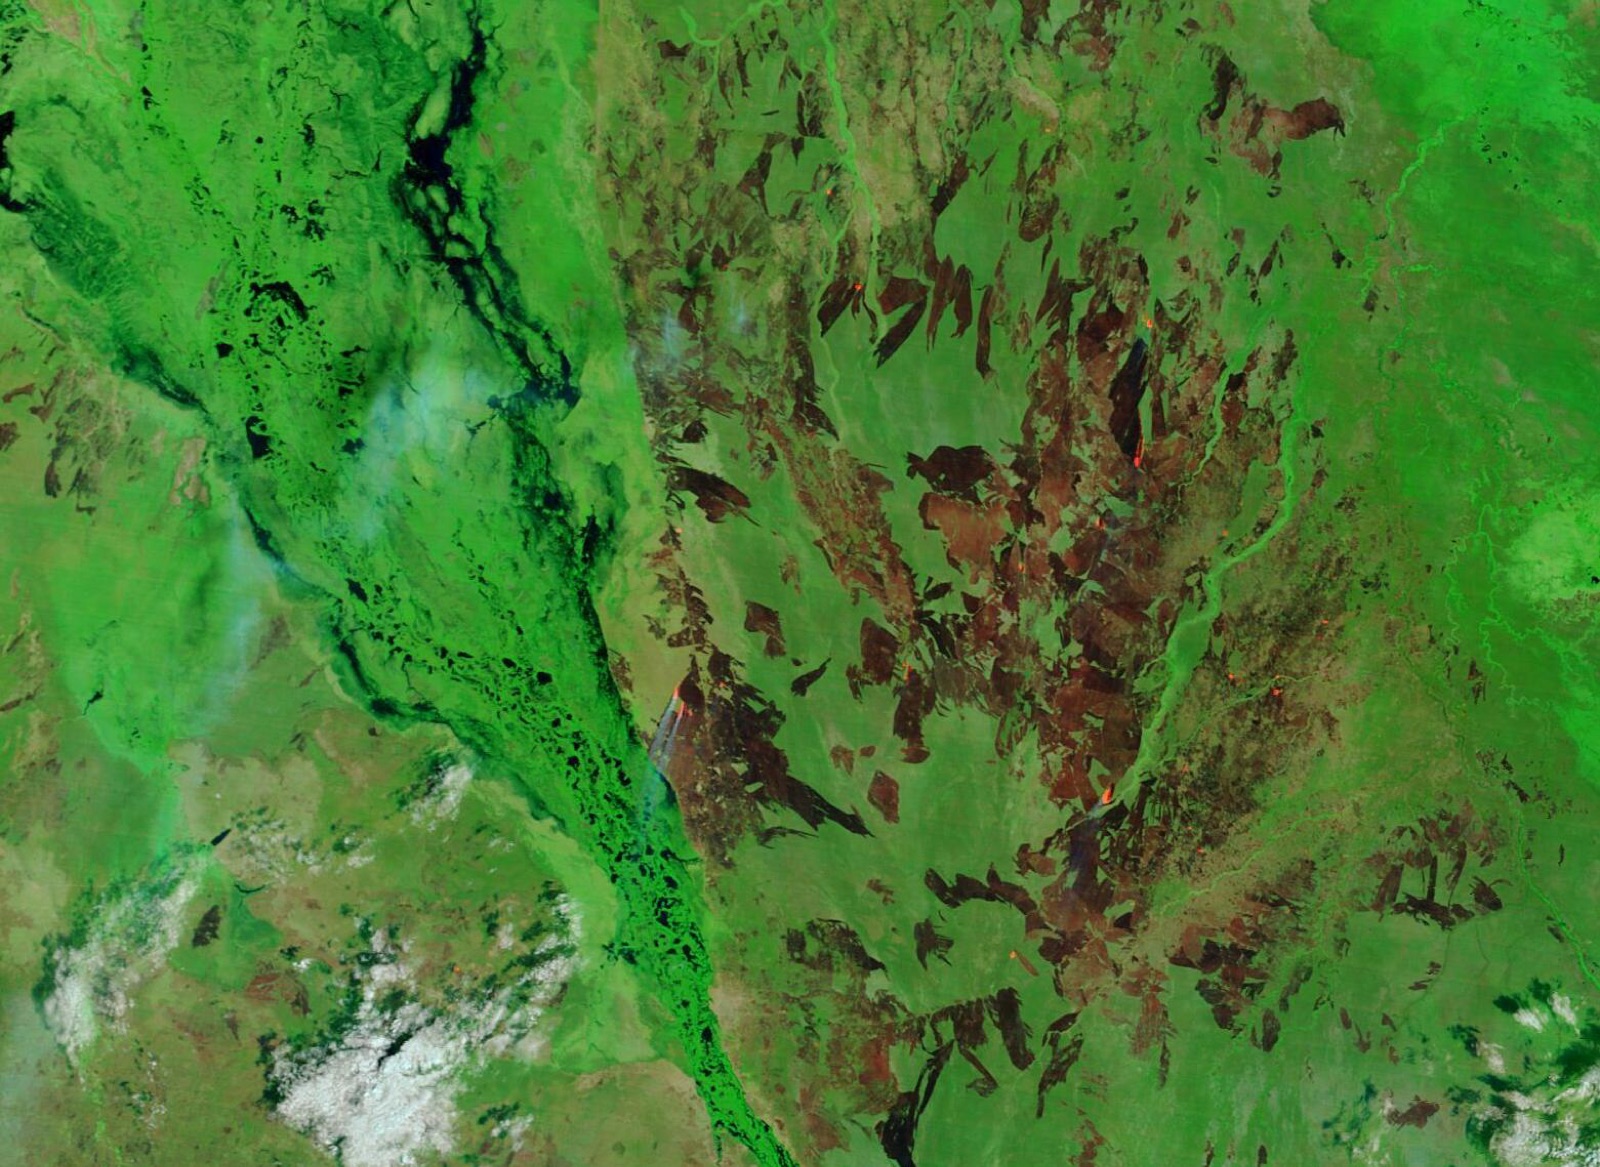
Wide-area fire watchLarge fires and smoke across boreal forest, seen in one wide-swath pass.
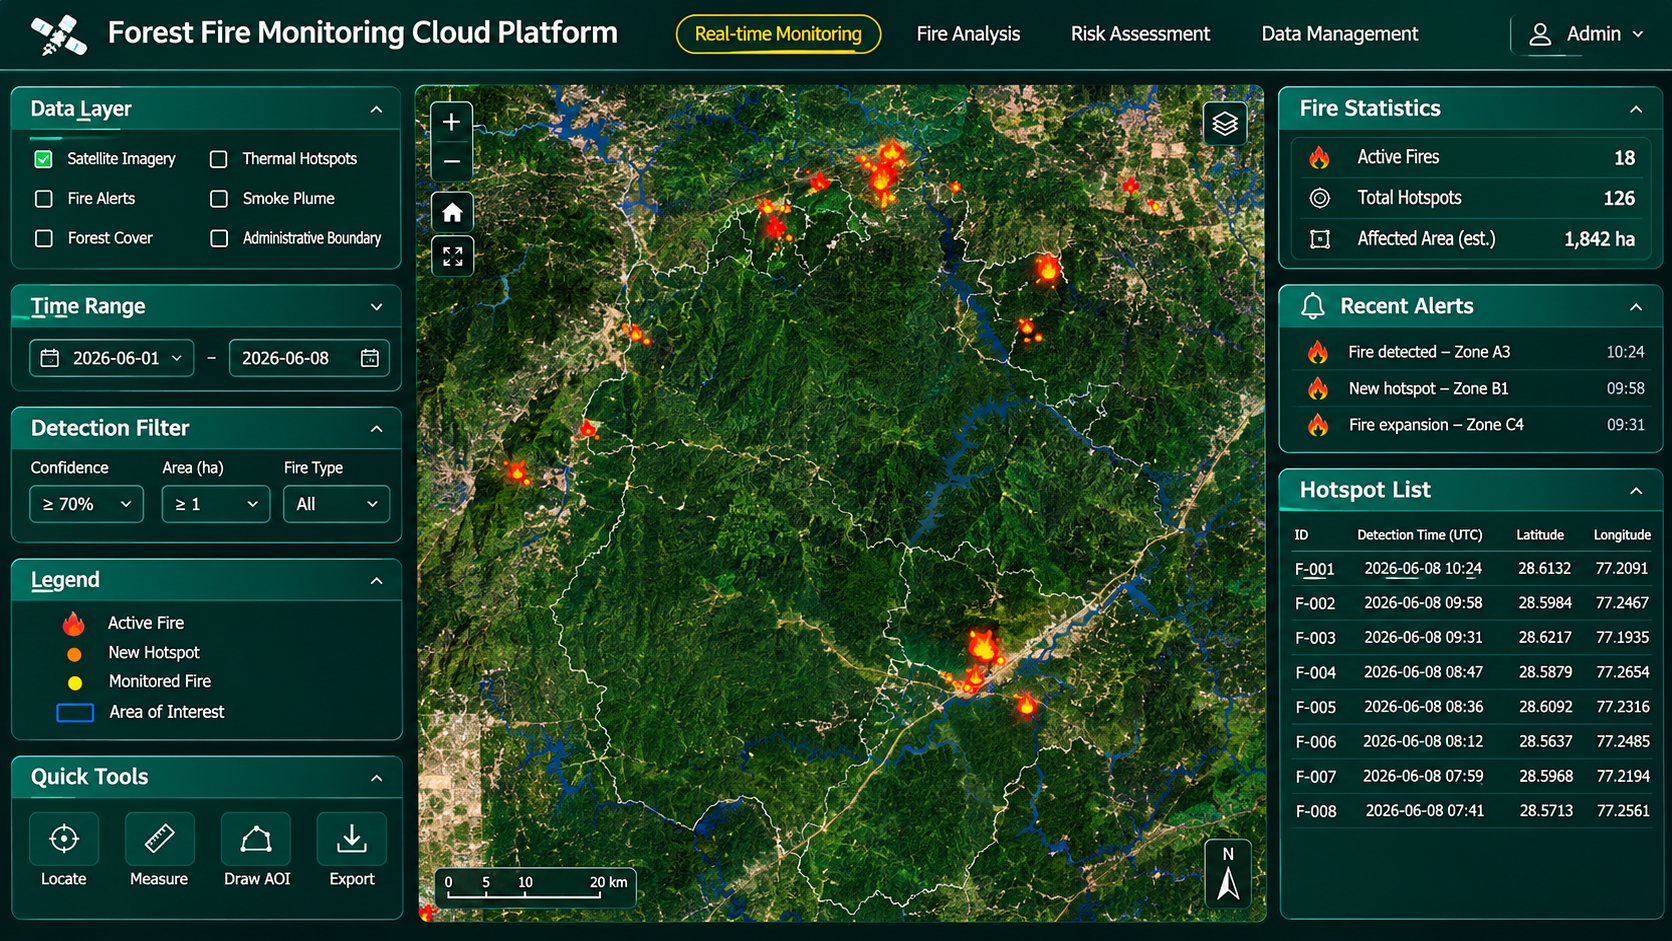
Forest fire monitoring platformActive fires, hotspot list, alerts and affected area in one view.
Platform
Space-Sky-Ground Forest Fire Monitoring Platform
XRTech Group's forest fire monitoring platform brings satellite, weather, vegetation and ground sensor data into one cloud system. AI models detect fire points automatically, predict spread from wind, terrain and fuel load, and push minute-by-minute updates to emergency teams.
✓Automatic fire point alarms with no manual screening and fewer missed fires
✓Rapid fire point positioning and verification with high-resolution imagery
✓Spread prediction from weather, slope and biomass fuel load
✓Affected range extraction and affected area statistics
✓3D fire views, thematic maps and fire reports for command and leadership
Case studies
Forest Fire Monitoring Projects Delivered
Real wildfire detection, burned area and repeat monitoring work delivered by XRTech Group.
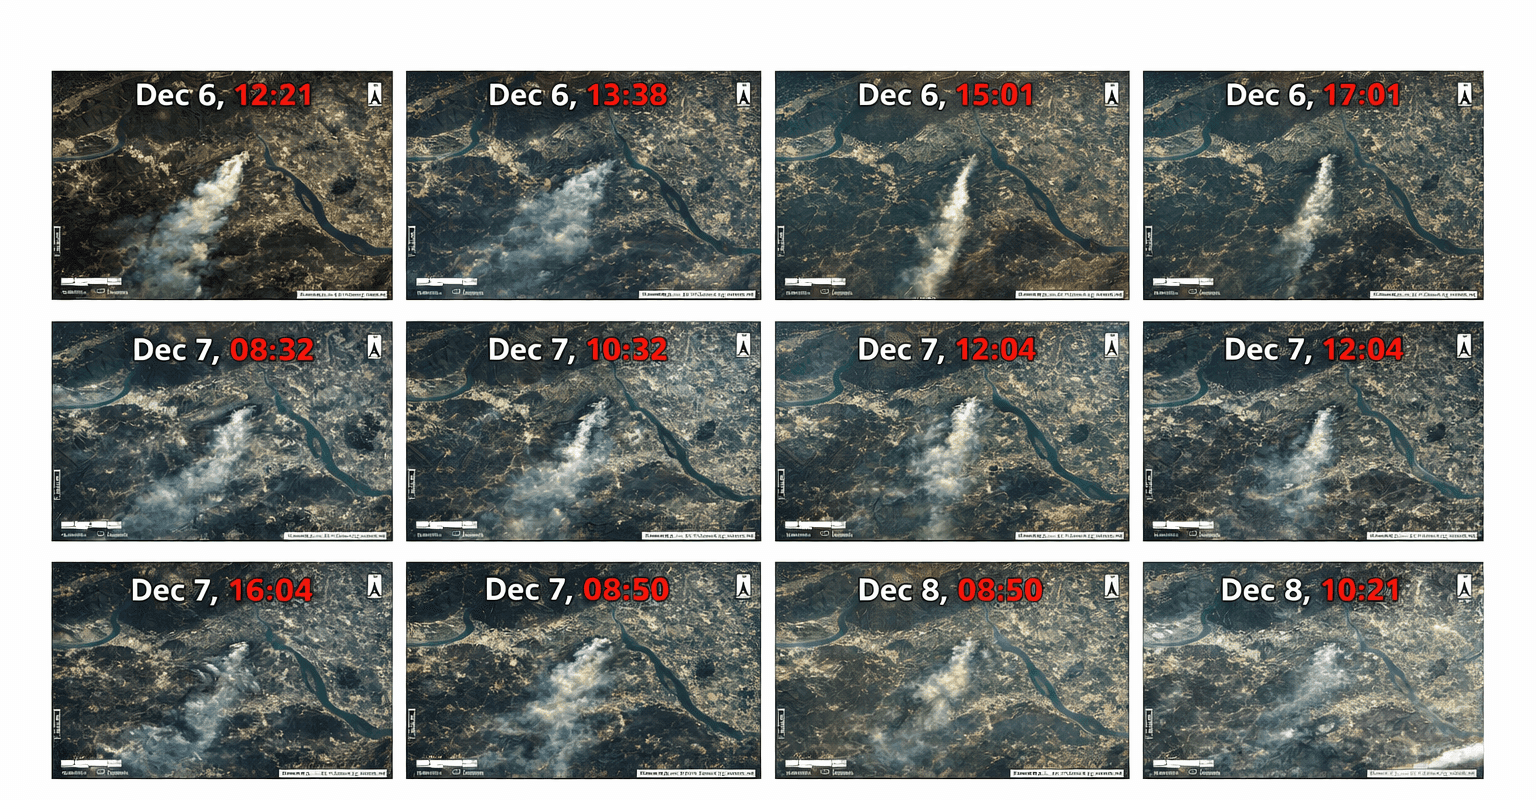
National programme: 29 large fires
Every large fire covered
Challenge: A national emergency management department needed independent, near real-time satellite intelligence on every large forest and grassland fire in the country, from first alarm to final damage report.
What we delivered: Satellite monitoring of 29 large fires: fire point alarms, continuous tracking, emergency imaging and post-fire loss assessment for each event, covering 100% of large fires.
Alarm · tracking · loss assessment
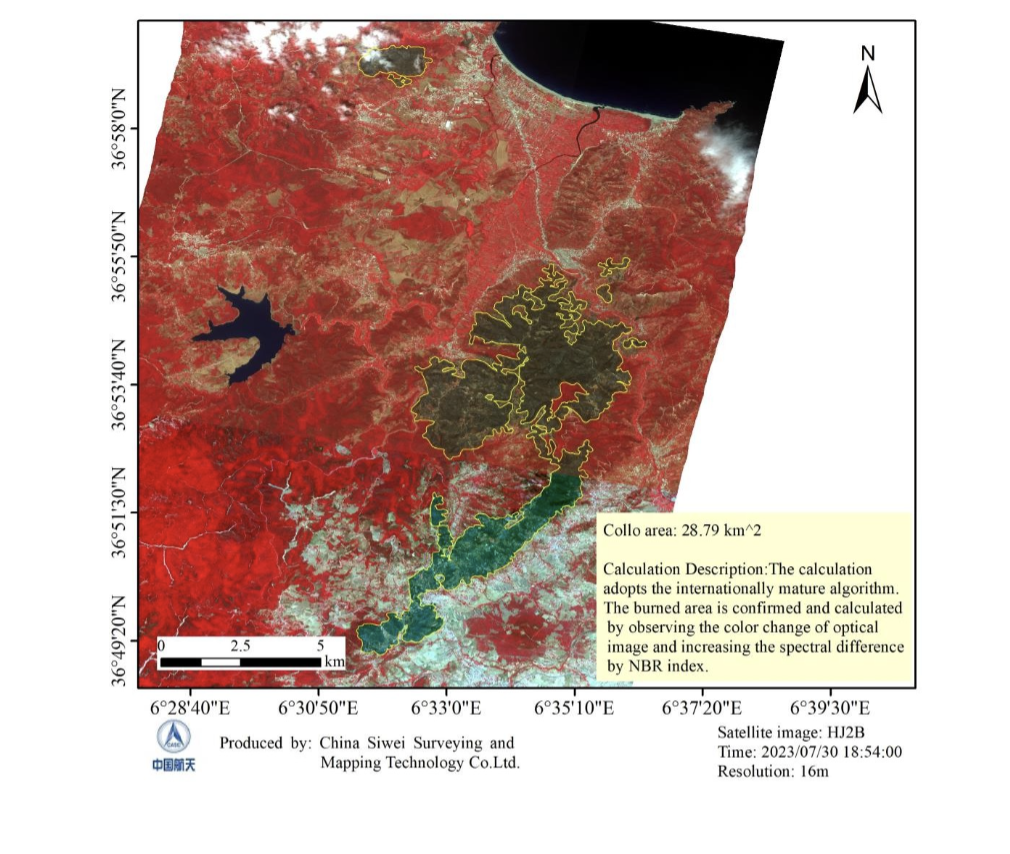
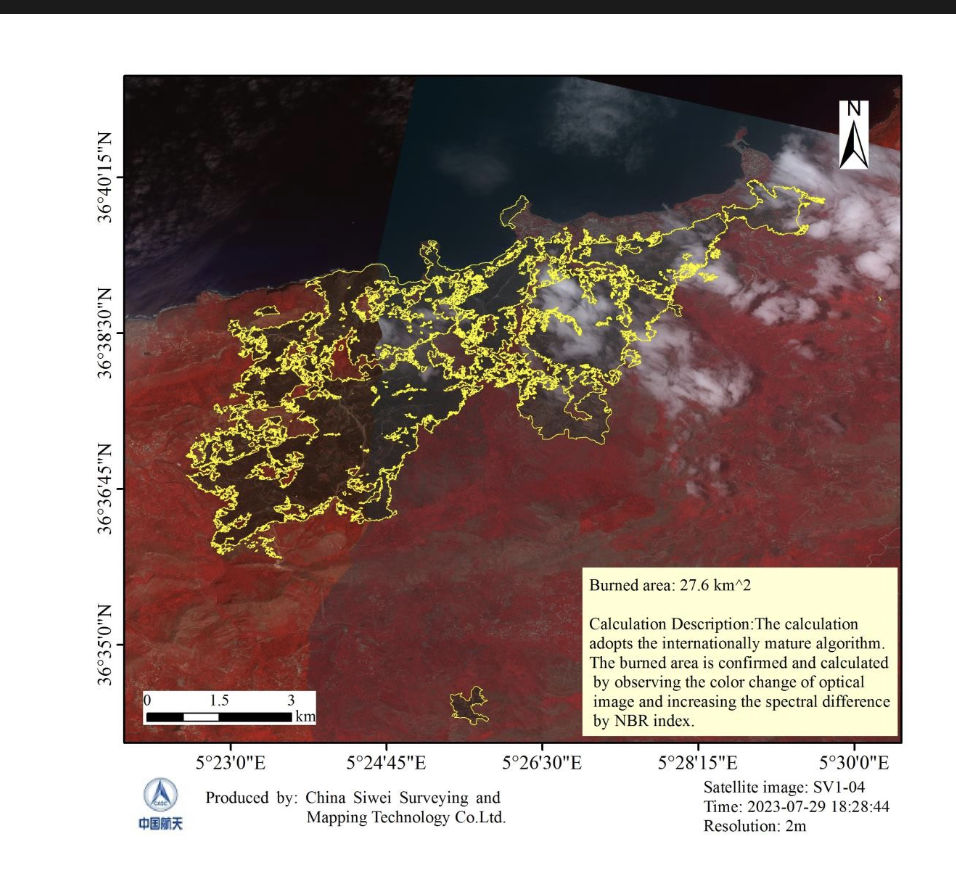
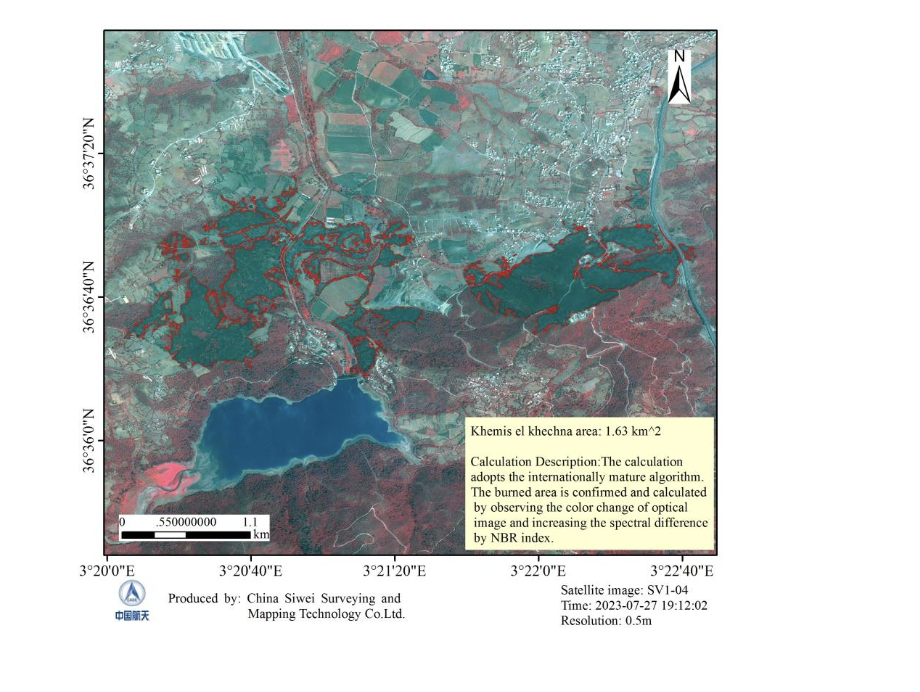
Algeria wildfires: multi-sensor time series
4 fire zones, 7 maps
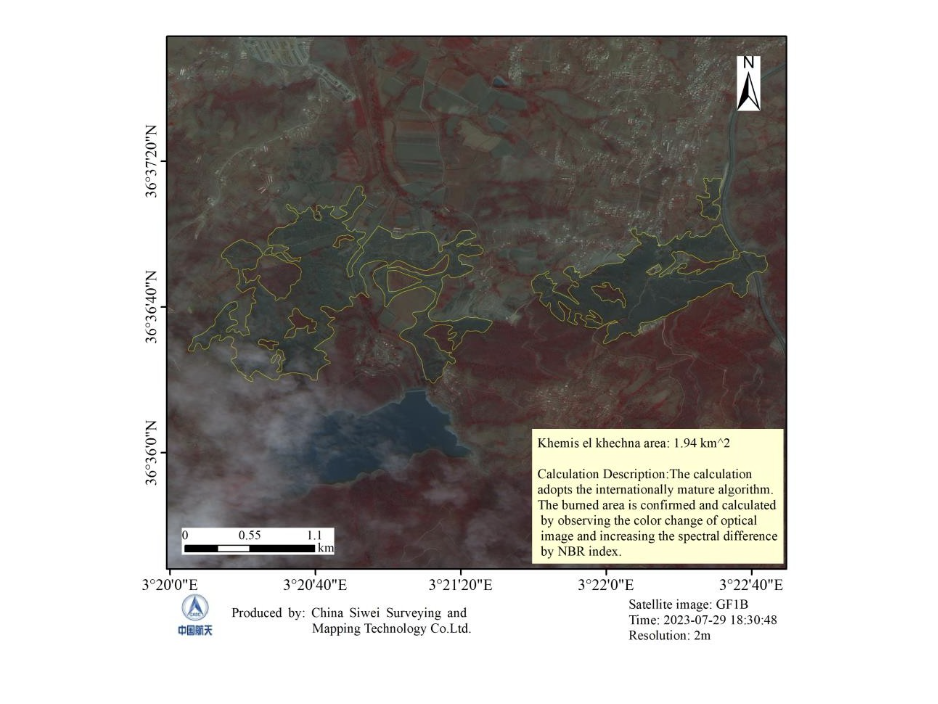
Challenge: Several large coastal wildfires burned at once across northern Algeria, and responders needed burned area figures for each zone that stayed current as the fires moved.
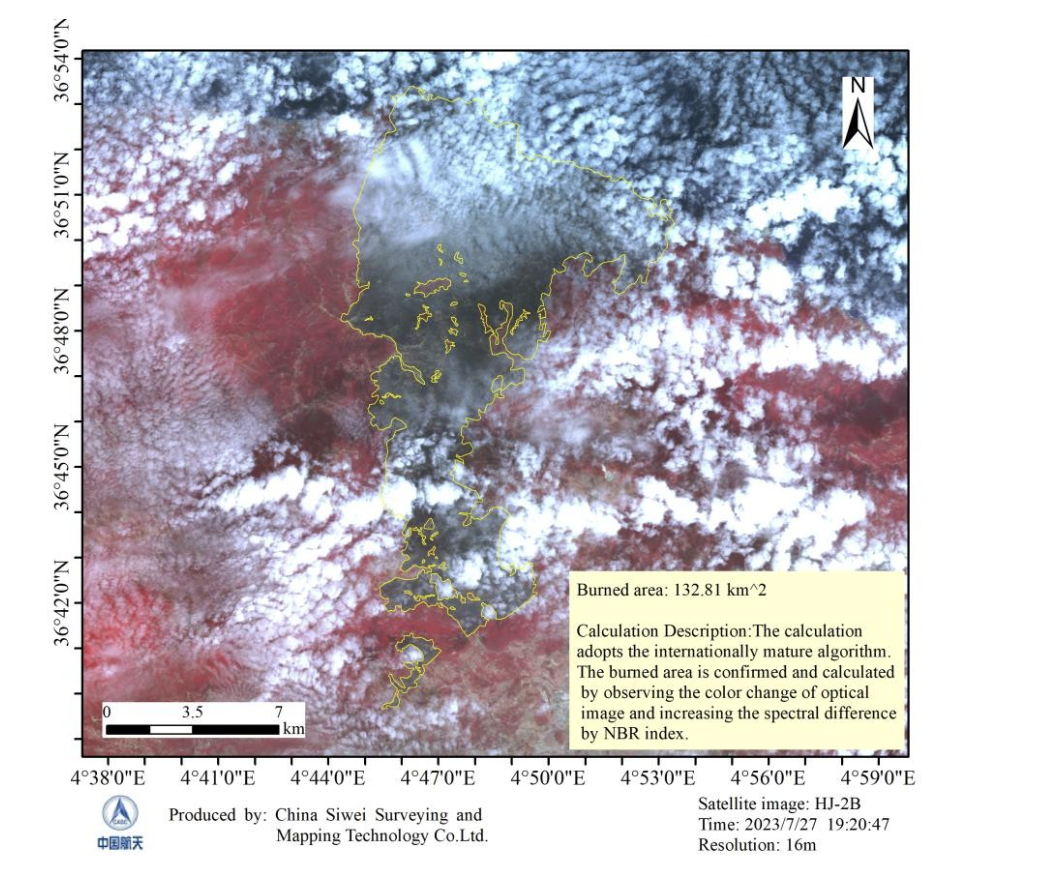
What we delivered: Burned area maps from GF-1D, GF-1B, SuperView and HJ-2B over consecutive days, at 0.5m to 16m: 132.81 km² regional extent, 27.32 to 27.6 km² near the Béjaïa coast, 28.65 to 28.79 km² at Collo and 1.63 to 1.94 km² at Khemis El Khechna.
NBR · 0.5m to 16m · repeat passes
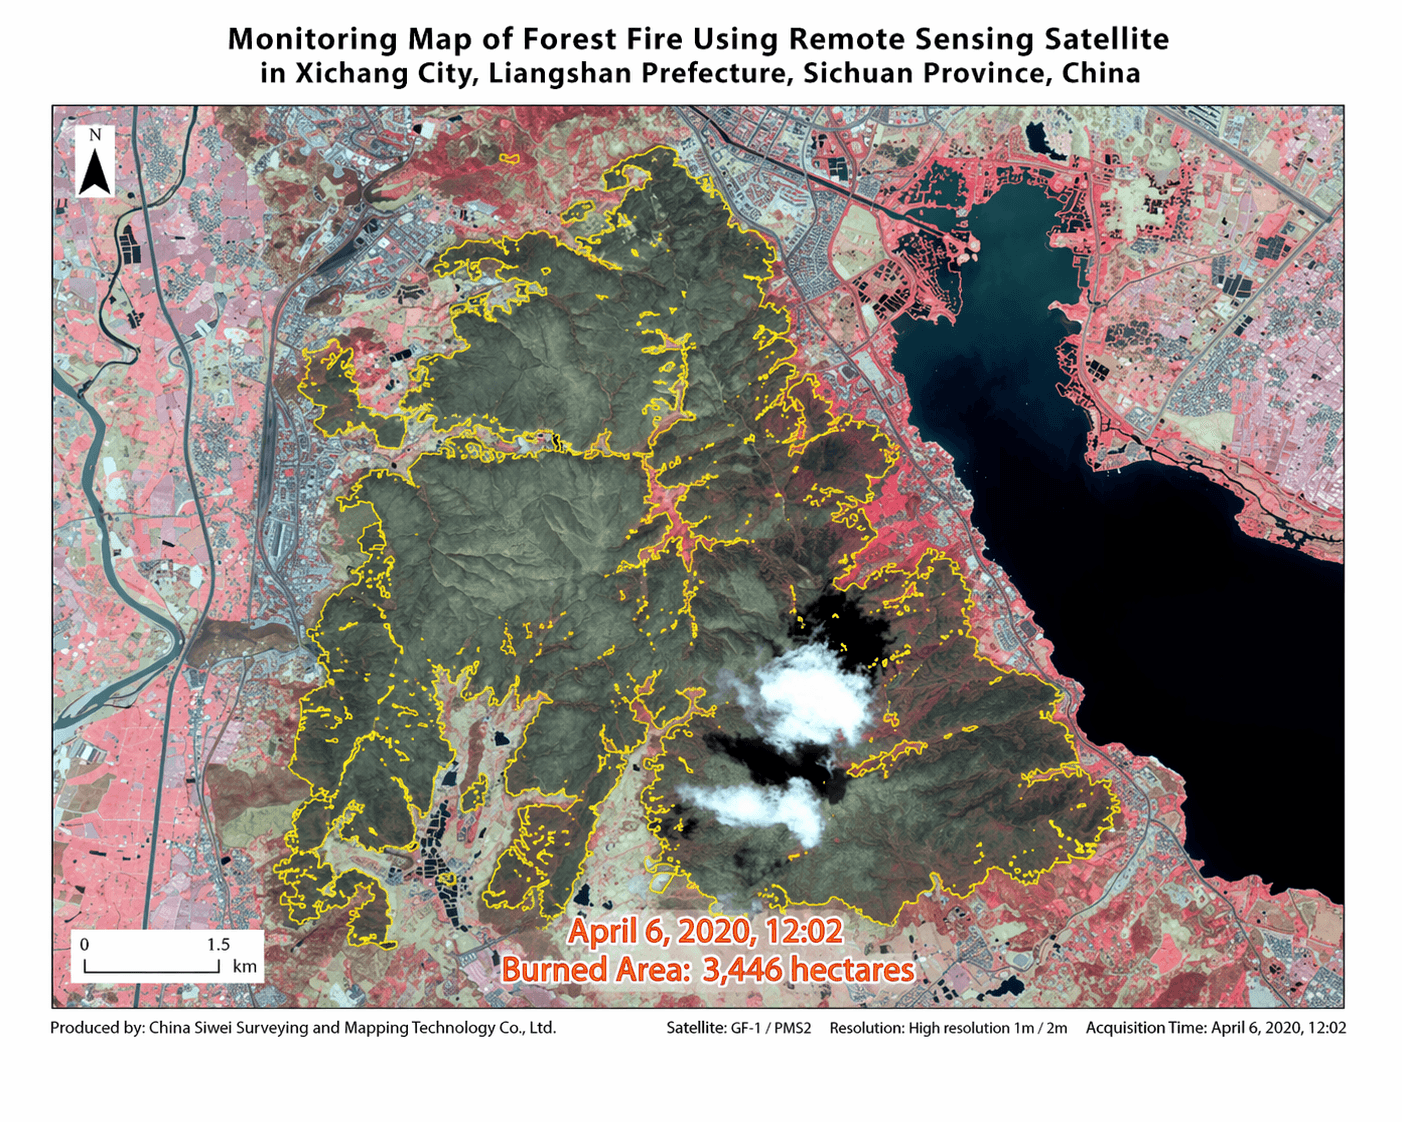
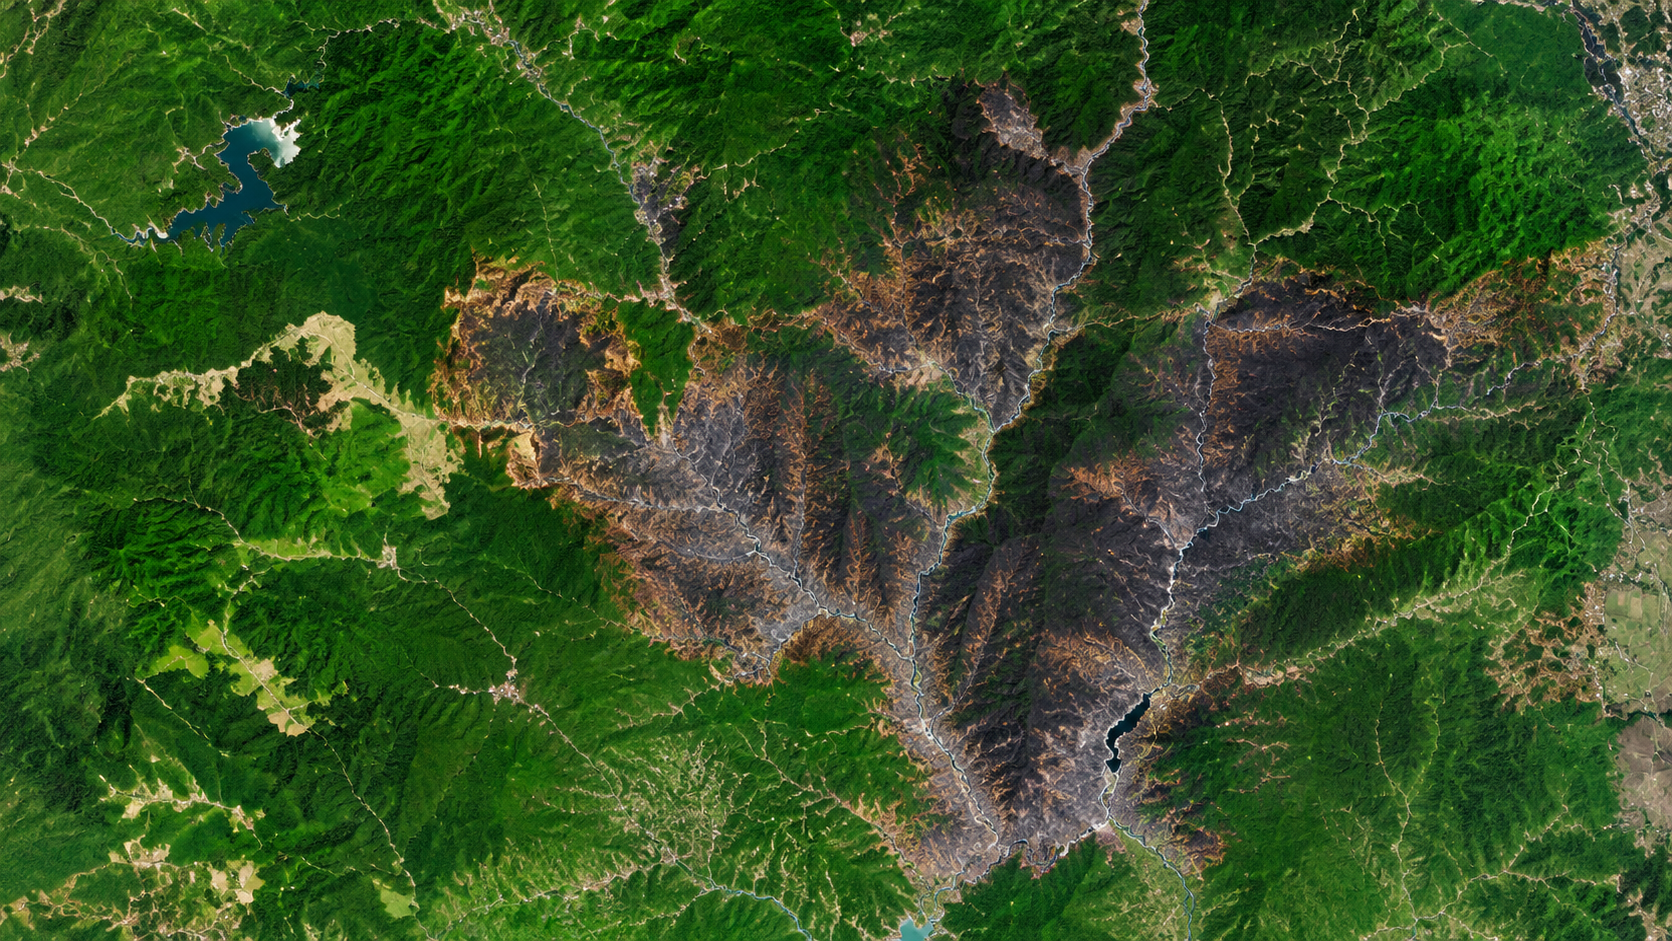
Xichang forest fire: 3,446 ha mapped
3,446 hectares
Challenge: A mountain forest fire burned right next to Xichang City and a lake in Sichuan, and responders needed the exact burned extent while the fire was still being contained.
What we delivered: A burned area monitoring map from 1m and 2m GF-1 imagery, with the fire boundary traced and the burned area measured at 3,446 hectares.
Burned area · 1m to 2m optical
How to order
How to Order Wildfire Satellite Data in 3 Steps
Active fires are handled as emergencies: send the location and tasking starts straight away. Use the request form or WhatsApp.
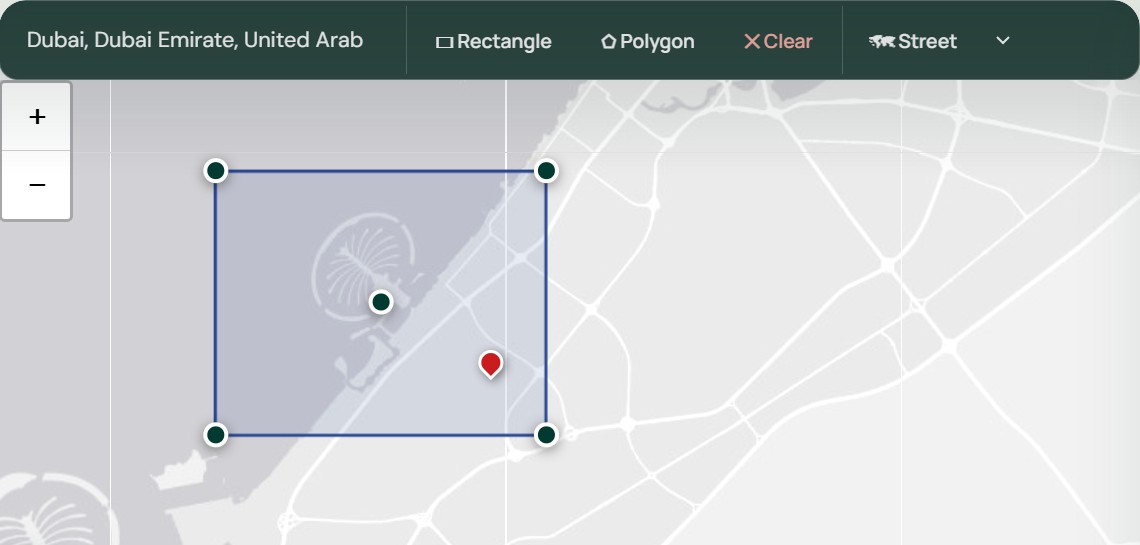
Step 1: Send the fire location or area
Send a place name, coordinates or a boundary file (KML, KMZ or SHP), tell us whether the fire is active, and list the products you need, such as hotspot alerts, perimeter, burned area or recovery monitoring.
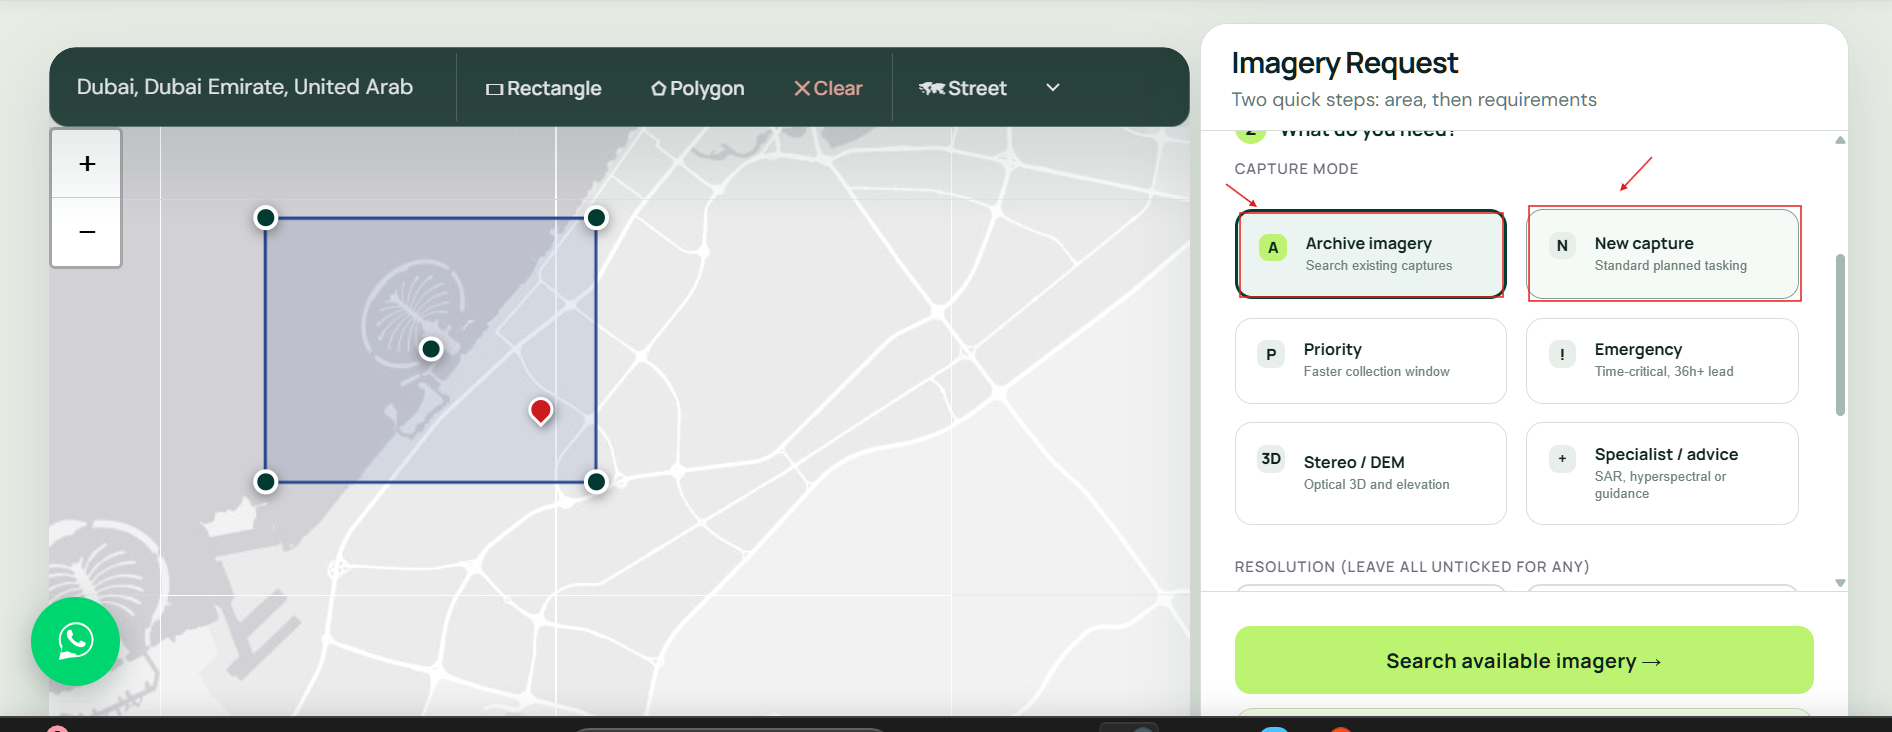
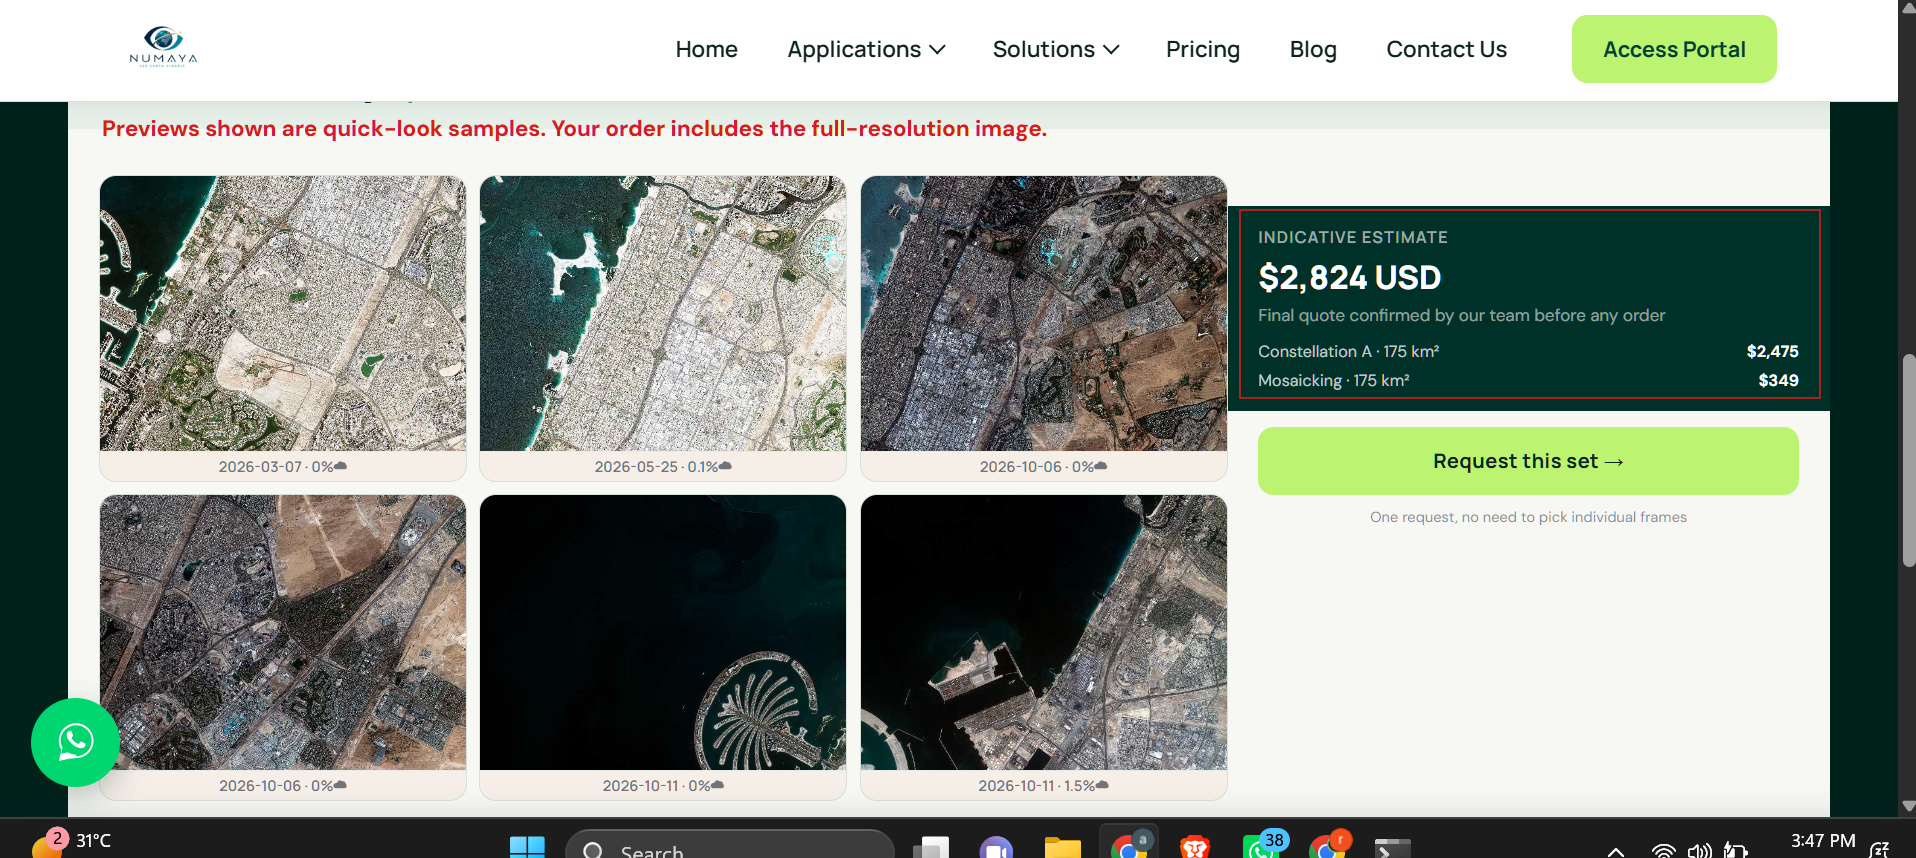
Active fires answered first
Request Wildfire Satellite Data
Send the fire location, the service you need and how urgent it is. XRTech Group replies with satellite passes, a tasking plan and a price per km².
FAQ
Wildfire Detection and Forest Fire Monitoring: Your Questions Answered
What is satellite wildfire detection?
Satellite wildfire detection uses thermal infrared sensors in orbit to find heat anomalies caused by fires, then uses high-resolution optical and radar imagery to confirm and map them. XRTech Group combines geostationary GF-4 thermal alerts every 20 seconds with sub-metre optical and SAR imagery, and burned area analysis after the fire.
How do satellites detect forest fires?
Fires are far hotter than the land around them, so they glow strongly in the mid-wave infrared band near 3.5 to 4.1 µm. Satellite algorithms compare each pixel with its background and flag heat anomalies, even when the fire covers only a small part of the pixel. High-resolution imagery then confirms whether it is a vegetation fire.
Can satellites detect wildfires in real time?
Close to it. The geostationary GF-4 satellite stares at the same region and refreshes every 20 seconds, which allows minute-by-minute fire tracking. Polar-orbiting satellites add sharper views a few times a day. XRTech Group combines both for continuous monitoring.
Can satellites see wildfires through smoke and clouds?
Thermal infrared sees active fire through thin smoke, but optical cameras are blocked by thick smoke and cloud. Radar is not: XRTech Group uses GF-3 C-band SAR at 1m and LT-1 L-band SAR at 3m to map fire perimeters and terrain through smoke, cloud and darkness.
How fast can XRTech Group deliver imagery of an active wildfire?
Emergency tasking starts as soon as the request is confirmed and delivers fresh imagery within 24 hours. Priority tasking captures in 3 to 5 days and pre-fire archive images are delivered within 48 hours of order approval.
How much does wildfire satellite imagery cost?
XRTech Group emergency tasking costs USD 80/km² at 30cm and USD 66/km² at 50cm. Priority tasking is USD 45 and USD 37, standard tasking USD 30 and USD 20, and pre-fire archive starts at USD 1/km² at 2m. Thermal monitoring, SAR and analysis are quoted per event or per fire season.
What is burned area mapping and how does NBR work?
Burned area mapping outlines and measures land burned by a fire. The Normalized Burn Ratio, NBR = (NIR − SWIR) / (NIR + SWIR), drops sharply after a fire because burned vegetation reflects less near infrared and more short-wave infrared. XRTech Group delivers burned area in hectares and km² with GIS boundaries.
How is burn severity measured from satellite imagery?
Burn severity is measured with dNBR, the difference between NBR before and after the fire. Larger drops mean more severe burning. The result is classified from unburned to high severity and used to plan erosion control, replanting and recovery funding.
How can satellite data help prevent forest fires?
Before the season, NDVI and NDMI show where vegetation is dry and fuel loads are high, elevation models show steep slopes, and past burn scars show where fires repeat. Prevention teams use these fire risk maps to place firebreaks, schedule prescribed burns and position crews.
Can satellite data predict where a wildfire will spread?
Yes, as an estimate. XRTech Group combines the latest fire perimeter with wind, terrain and fuel load to model likely spread direction and speed. Predictions are refreshed with each new pass so incident teams can update evacuation routes and crew positions.
Which satellite resolution is best for wildfire monitoring?
Detection uses thermal infrared at 375m to 1 km, or 400m from GF-4. Fire lines and burned area need 2m to 16m. Building damage and insurance loss checks need 30cm to 50cm. Most programmes mix all three.
Who uses satellite wildfire monitoring?
Fire departments, first responders and incident commanders, national and regional emergency management agencies, forestry and park services, NGOs and UN agencies, insurers, power utilities and pipeline operators, plantation and carbon project owners, and city planners in the wildland-urban interface.
How do fire departments use satellite data?
Fire departments use satellite hotspot alerts to find new fires early, perimeter maps to see how far the fire has spread, and high-resolution imagery to check access roads, water sources and firebreaks. XRTech Group delivers these as KML and SHP layers for incident maps.
How can NGOs and humanitarian teams get wildfire damage maps?
Send the affected area through the request form or WhatsApp. XRTech Group returns burned area maps, affected settlement and farmland counts, and before and after imagery for needs assessments and donor reports, with archive before images delivered within 48 hours.
Can insurers use satellite imagery for wildfire claims?
Yes. Pre-fire archive and post-fire imagery at 30cm to 50cm show which buildings and assets burned, so insurers can verify claims and size portfolio losses without sending adjusters into unsafe areas. See satellite imagery for insurance.
Which satellite indices are used for wildfire monitoring?
NDVI, NDMI and NDWI show vegetation greenness, moisture and water content before a fire; thermal anomaly bands find active fires; BAI, NBR, NBR2 and MIRBI map burned land; and dNBR grades burn severity. XRTech Group works with more than 20 indices plus custom false-colour band combinations.
How does time series analysis show rising wildfire risk?
Repeated NDVI, NDMI and NDWI measurements over weeks and months show vegetation losing greenness and moisture. When a forest dries faster than normal for the season, ignition risk is rising, so prevention teams can act before a fire starts. The same series later measures recovery after a burn.
What is the difference between NASA FIRMS and XRTech Group?
NASA FIRMS and Copernicus EFFIS give free active fire pixels at 375m to 1 km from a few passes a day. XRTech Group adds 20-second geostationary alerts, sub-metre confirmation imagery, SAR through smoke, emergency tasking within 24 hours, and burned area and loss analysis.
How do I use satellite images for forest fire monitoring?
Set your area of interest, choose a clear pre-fire scene and the newest post-fire pass, apply indices such as NBR, NDVI and NDMI or a short-wave infrared band combination, then compare dates with change detection and time series. XRTech Group runs this workflow for you and delivers the maps, or sends the layers for your own GIS.
What is change detection in wildfire monitoring?
Change detection compares satellite images of the same place before and after a fire to show exactly what changed. With NBR and NDVI built in, it reveals burned areas, how badly vegetation was affected and, over later months, how fast it grows back.
How soon after a wildfire can burn severity be mapped?
Burned area can be mapped from the first clear pass after the fire, often within days of containment, and emergency tasking delivers imagery within 24 hours. Severity classes from dNBR follow as soon as before and after scenes are available.
Can satellite data help plan firebreaks and prescribed burns?
Yes. Vegetation density, fuel moisture, slope, access roads and distance to homes and power lines show where firebreaks protect the most and where prescribed burns are safe to run, so prevention budgets go to the highest-risk zones.
How does satellite data support wildfire restoration?
Burn severity is combined with slope, soil and drainage to rank areas for erosion control, replanting and habitat repair, then vegetation indices track regrowth month by month so restoration teams can prove progress to funders.
What happens after a wildfire, and can satellites monitor recovery?
Burned slopes can erode and slide when rain returns. XRTech Group uses elevation models and burn severity to flag erosion, landslide and debris flow risk, then tracks vegetation regrowth over months to years to guide replanting and restoration.
What do I receive with a wildfire order?
Georeferenced imagery as GeoTIFF, fire perimeters and burned area as SHP, KML or GeoJSON, hotspot lists as CSV, and thematic maps and a fire report as PDF. Data comes by secure cloud link, ready for ArcGIS, QGIS or Google Earth.
Can you monitor a whole fire season or a whole country?
Yes. XRTech Group runs fire season monitoring and year-round national programmes with full-area scanning, automatic alarms and regular updates, and has supported a national emergency department across 29 large fires.
Do I need an export licence to buy wildfire satellite data?
No. XRTech Group is a non-US provider, so orders are not subject to ITAR or EAR export licences. Data comes with flexible team-wide licensing for your organisation.
Reviewed by Mustafa Jawaad, General Manager, XRTech Group. Prices are XRTech Group's published list prices in USD per km².