Quick answer: SAR (synthetic aperture radar) is a radar on a satellite or aircraft that takes pictures of the ground, day or night and through clouds. InSAR (interferometric SAR) compares two or more SAR images of the same place to measure how far the ground moved, down to millimeters. Inverse SAR (ISAR) flips the idea: the radar stays in place and uses a moving target, such as a ship, aircraft or satellite, to build a picture of that one object. In short, use SAR to see, InSAR to measure movement and ISAR to identify a moving target.
The three names sound alike because they share the same core trick. However, they answer different questions, need different data and suit different budgets. This guide explains each one in plain words, compares them side by side, lists the main SAR sensors in orbit and shows you how to choose the right one for your project.
What Is SAR (Synthetic Aperture Radar)?
A SAR satellite sends pulses of microwaves toward the ground and records the echoes. Because it makes its own signal, it works at night. And because microwaves pass through clouds, smoke and light rain, it works in almost any weather.
The clever part is the synthetic aperture. A sharp radar picture would normally need an antenna hundreds of meters or even kilometers long. Instead, the satellite records echoes from the same spot while it moves along its orbit, and a computer combines them as if they came from one giant antenna. As a result, an antenna just a few meters long can produce images sharp enough to show single buildings, and in some modes, detail finer than 1 m.
Each pixel in a SAR image stores two things. Amplitude is how strong the echo was, and it becomes the grey picture you see. Phase is the exact point in its wave cycle at which the echo returned. Ordinary SAR images use the amplitude. InSAR, as you will see below, is built on the phase. To see what SAR imagery can do for mapping and monitoring, visit our SAR satellite imagery page.
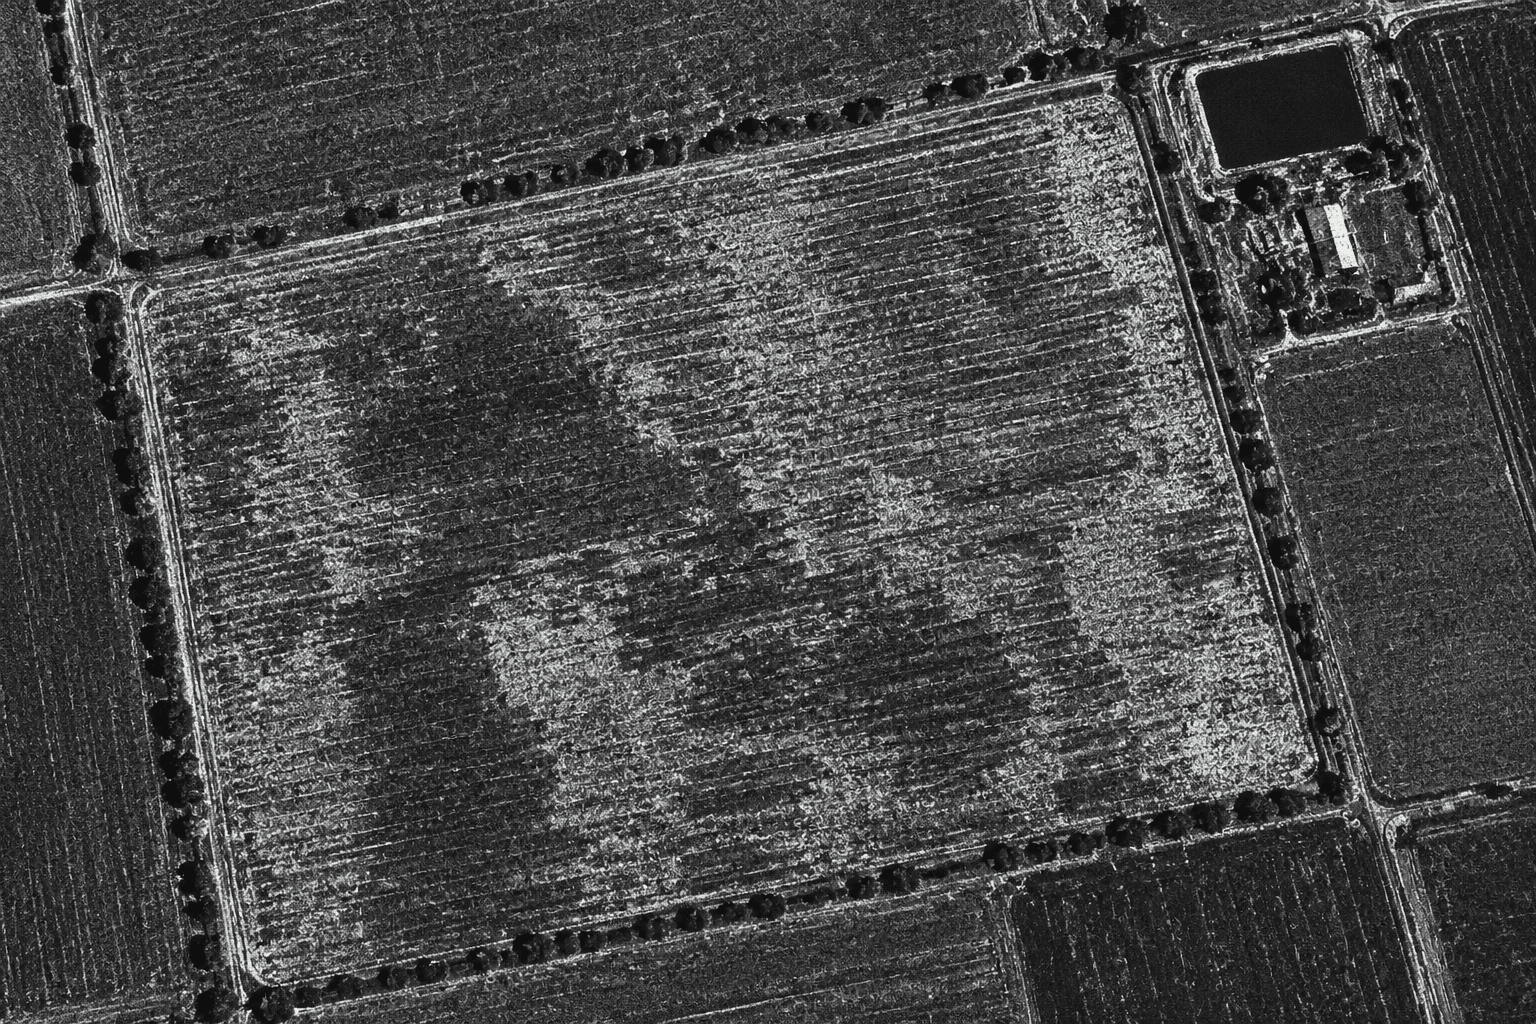
In a SAR image, brightness shows how strongly each surface bounces the radar back. Rough fields and buildings look bright, while smooth water and pavement look dark.
SAR Sensors: Radar Bands and the Satellites That Carry Them
Not all SAR sensors see the same way. The biggest difference is the wavelength, called the band, because it decides how deep the signal reaches and how fine the detail is:
Band (wavelength)
What it is good at
Example satellites
X-band (about 3 cm)
Finest detail: buildings, ships, bridges and other infrastructure
TerraSAR-X, COSMO-SkyMed, most small commercial radar satellites
C-band (about 5.6 cm)
All-round mapping, floods, sea ice, oil spills and regional ground movement
Sentinel-1C and 1D, RADARSAT Constellation, GF-3
S-band (about 10 cm)
Crops, grassland and soil moisture
NISAR, NovaSAR-1
L-band (about 24 cm)
Passes through leaves, so ground movement can be measured under vegetation
LT-1, NISAR, ALOS-4, SAOCOM
P-band (about 70 cm)
Reaches deep into forests to measure wood and carbon
ESA Biomass
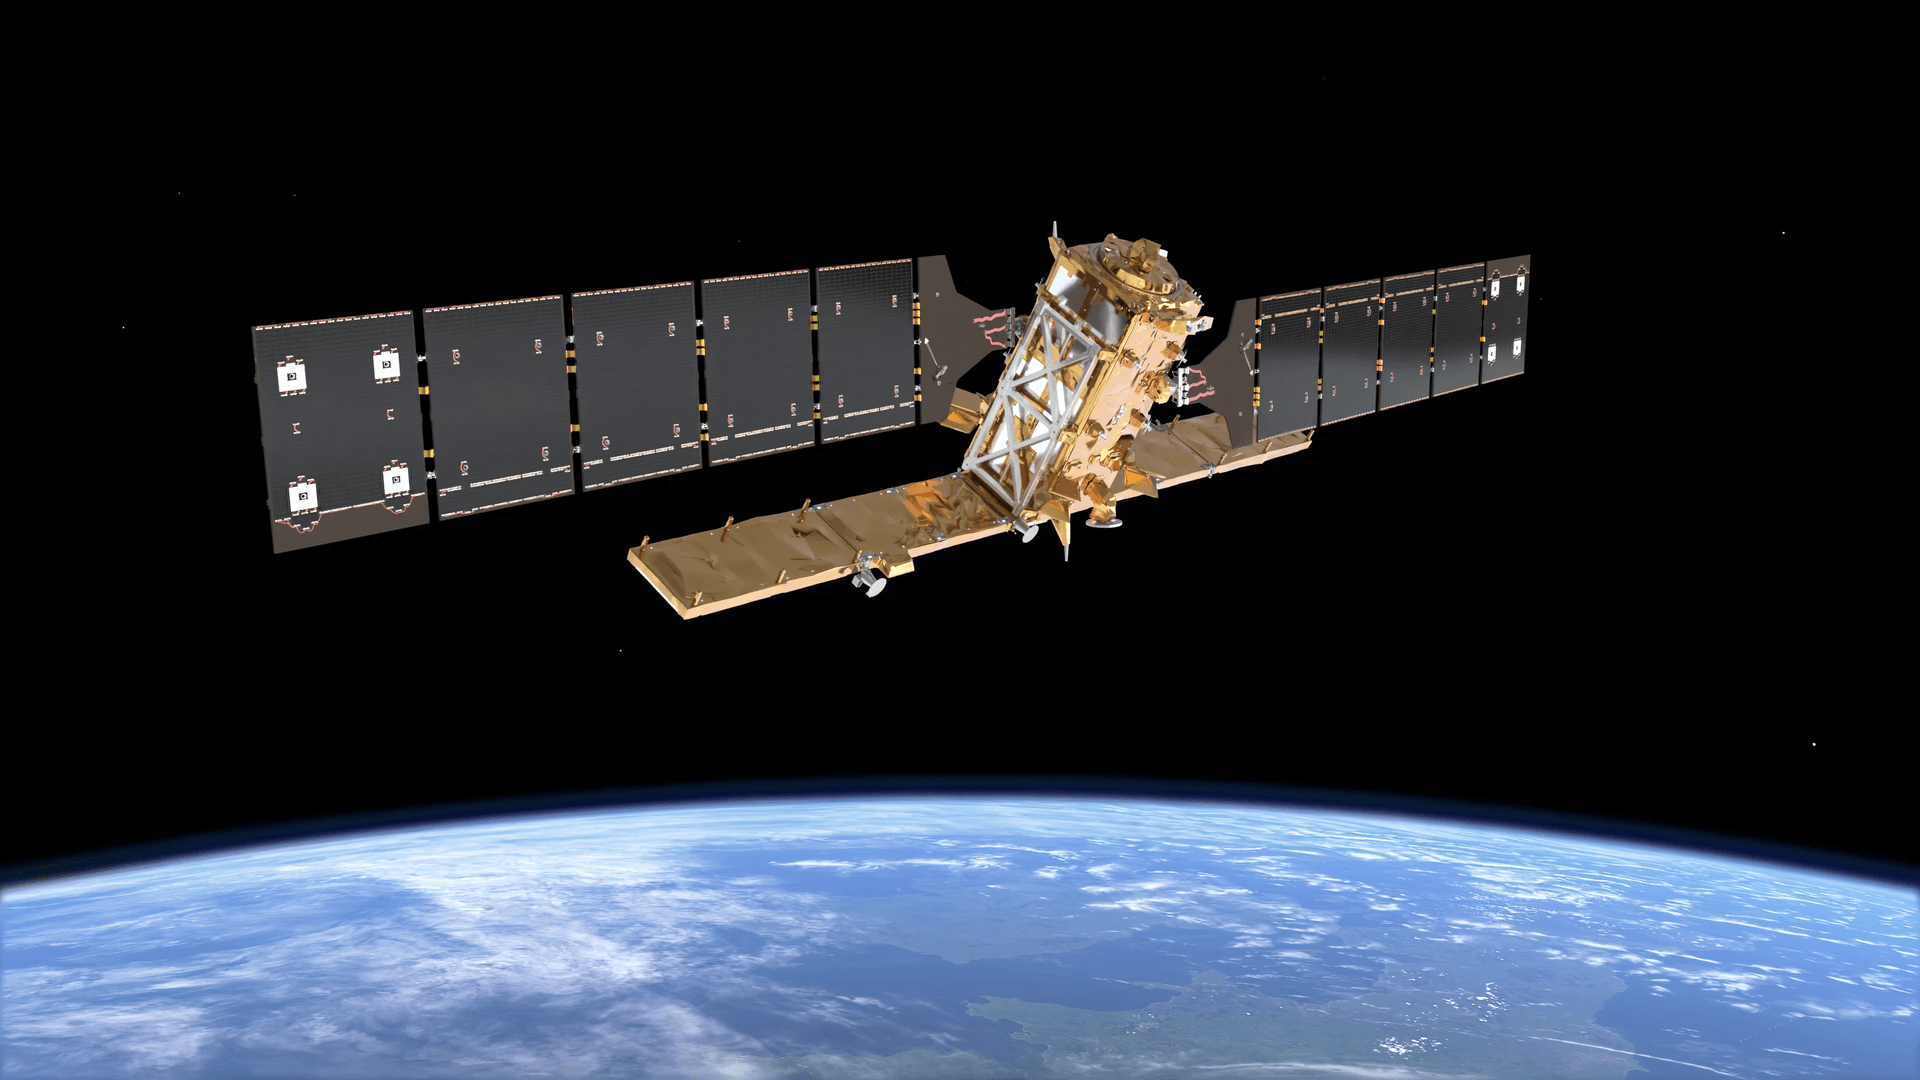
New missions keep raising the bar. Sentinel-1D now flies with Sentinel-1C, which brings back free C-band coverage that repeats every 6 days. NISAR, built by NASA and ISRO, is the first satellite to carry both L-band and S-band radars, and its science data is open to everyone. ESA's Biomass is the first satellite with a P-band radar.
Beyond the band, compare four more things. First, resolution, which ranges from well under 1 m in spotlight modes to around 100 m in wide modes. Second, polarization: sensors that send and receive in both horizontal and vertical directions (VV, VH, HH, HV) reveal more about the type of surface. Third, how often the satellite repeats the same pass. Fourth, whether an archive of past images exists for your site.
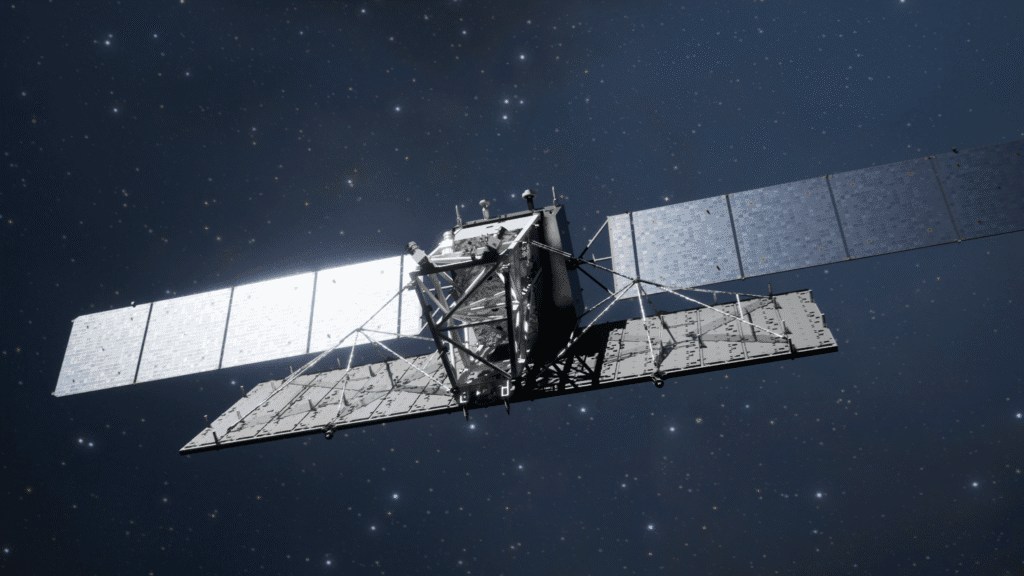
LT-1 is a pair of L-band radar satellites built specifically for InSAR, so it can track ground movement even where plants cover the surface.
What Is InSAR (Interferometric SAR)?
InSAR compares the phase of two SAR images of the same place, taken from almost the same point in orbit. If the ground moved toward or away from the satellite between the two passes, the echo comes back slightly earlier or later, so its phase shifts. Because a radar wave is only a few centimeters long, even a tiny shift is easy to detect. That is why interferometric SAR can reveal ground movement of a few millimeters.
In practice, an InSAR analysis follows these steps:
- Choose images from the same satellite, band and orbit track, all looking at the site from the same angle.
- Line the images up to a fraction of a pixel.
- Compare their phase to create an interferogram, a map of phase differences.
- Remove the parts of the signal caused by terrain height and orbit position, using an elevation model.
- Unwrap the phase, which turns repeating color cycles into one continuous movement map.
- Check coherence, a quality score that shows where the result can be trusted.
The main types of InSAR
- Differential InSAR (DInSAR): uses two images to capture one event, such as an earthquake, a sinkhole or a mine collapse.
- Persistent scatterer InSAR (PS-InSAR) and SBAS: use dozens or hundreds of images over months or years. They track stable points, such as buildings and rocks, and report movement in millimeters per year.
- Single-pass InSAR: two antennas image the same area at the same moment, so nothing on the ground can change in between. Instead of movement, it measures height, which is how global digital elevation models are made from radar.
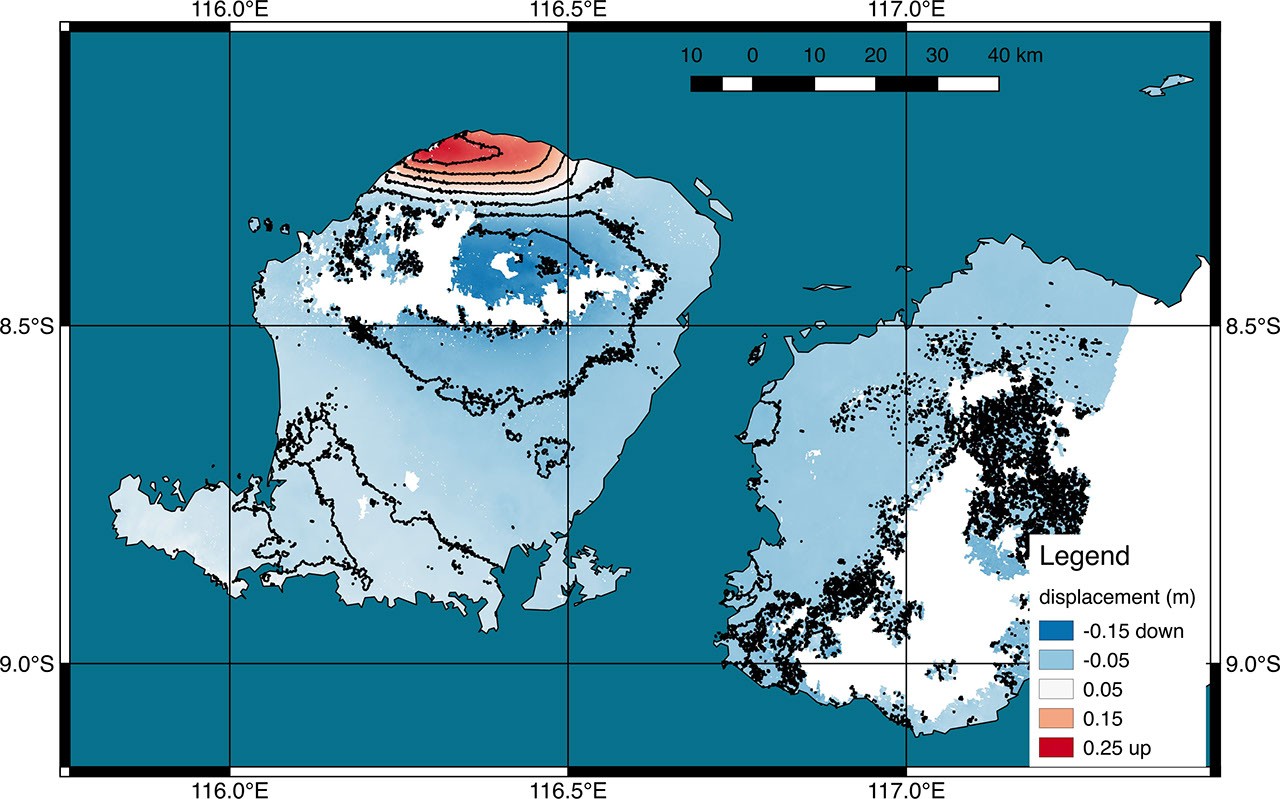
An InSAR displacement map of an earthquake on Lombok, Indonesia. Red areas rose by up to about 25 cm and blue areas sank by up to about 15 cm. Image: NASA/JPL-Caltech, using Copernicus Sentinel-1 data.
How to Read InSAR Images
InSAR images usually come in three forms, and each one is read differently:
- Wrapped interferogram: rainbow bands called fringes. Each full cycle of colors equals movement of half the radar wavelength along the satellite's line of sight, which is about 2.8 cm for Sentinel-1. So count the fringes toward the center of a pattern to estimate the total movement. Tightly packed fringes mean a sharp change over a short distance.
- Displacement or velocity map: the unwrapped result, shown in centimeters, or in millimeters per year for time series. Red and blue often mean toward and away from the satellite, but some maps use them for up and down, so always read the legend.
- Coherence map: shades from black to white. Bright areas kept a stable signal and can be trusted. Dark areas, such as water, thick forest or fresh construction, lost coherence, so their results are noise.
Keep one more rule in mind. InSAR measures movement along the radar's tilted line of sight, not straight up and down. To split it into vertical and east-west motion, analysts combine passes from two directions, one flying north and one flying south.
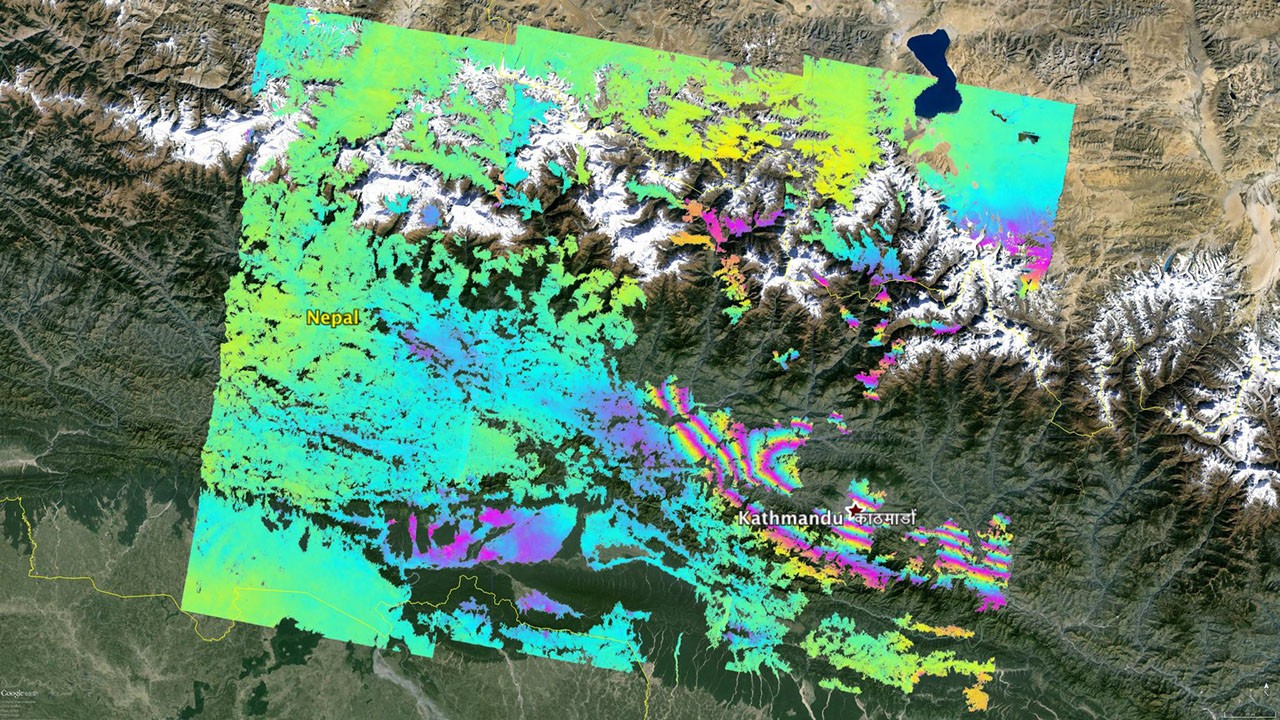
A wrapped interferogram over Nepal, around Kathmandu, after a major earthquake. Each full rainbow cycle marks about 2.8 cm of ground movement toward or away from the satellite. Image: NASA/JPL-Caltech, using Copernicus Sentinel-1 data.
What Is Inverse SAR (Inverse Synthetic Aperture Radar)?
Inverse synthetic aperture radar turns the SAR idea around. In SAR, the radar moves and the ground stays still. In inverse SAR, the radar can sit still on a ship, an aircraft or the ground, while the target moves. As a ship rolls on the waves, or a plane or satellite turns, each part of it moves toward or away from the radar at a slightly different speed. The radar measures these small Doppler shifts and turns them into a picture of the target's shape.
Because of this, ISAR is not a mapping tool. It images one moving object at a time. Navies and maritime patrol aircraft use it to tell a fishing boat from a warship at long range, even at night. Coast guards use it to classify vessels. Large ground radars also use it to image satellites and space debris, checking their shape and condition, for example after a failure in orbit.
Here is an easy way to remember the difference: a SAR satellite spots every ship in a harbor as a bright dot, while ISAR zooms in on one of those ships to show its outline, masts and deck.
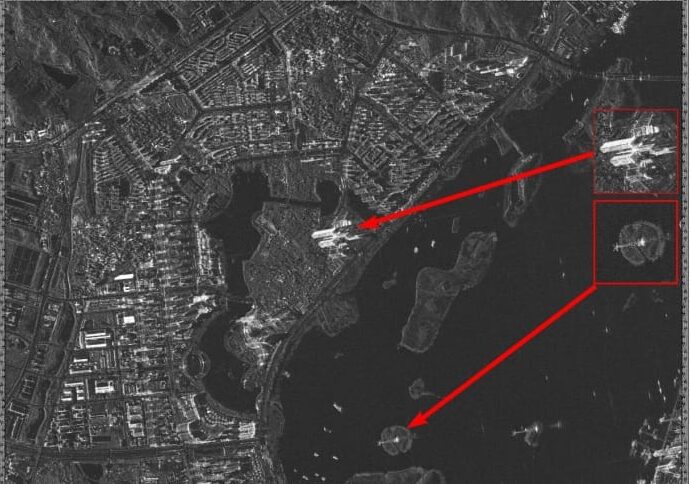
A GF-3 C-band SAR image of a coastline. Ships show up as bright points on dark water. Identifying one of them in detail is where ISAR comes in.
SAR vs InSAR vs ISAR: Side-by-Side Comparison
Feature
SAR
InSAR
Inverse SAR (ISAR)
Question it answers
What is there?
How much did it move?
What exactly is that moving object?
What moves
The radar
The radar, on repeat passes
The target
Data needed
One image
Two or more images from the same geometry
Echoes collected while the target moves
Output
Grey radar image
Interferogram, movement or height map
Picture of one ship, aircraft or satellite
Precision
Detail from under 1 m to tens of meters
Millimeters to centimeters of movement
Enough detail to classify a target
Which One Should You Use?
Start from the question you need answered, not from the technology:
- Use SAR when you need to see what is on the ground through cloud or at night: flood extent, ship positions, new construction or crop condition.
- Use InSAR when you need to know whether the ground, a dam, a mine wall or a building is moving, and by how much. Pick PS-InSAR for slow movement over months, and DInSAR for a sudden event.
- Use single-pass InSAR data when you need a terrain height model and clouds block optical stereo imagery.
- Use ISAR when you need to identify one specific ship, aircraft or satellite. It is usually part of a defense or coast guard radar system, not a satellite data product you buy.
How to choose SAR data for an InSAR project
- Vegetation or farmland: favor L-band, because it keeps a stable signal under plants where shorter bands lose coherence.
- Cities, bridges and mine sites: X-band or C-band give dense, precise measurement points on hard surfaces.
- Slow creep: plan for about 20 or more images from the same orbit track to build a reliable time series.
- Fast movement, such as an active landslide: pick a satellite that revisits often, because too much movement between two passes breaks the measurement.
- Budget: Sentinel-1 data is free, while commercial tasking costs more but adds finer detail, extra bands or faster revisit.
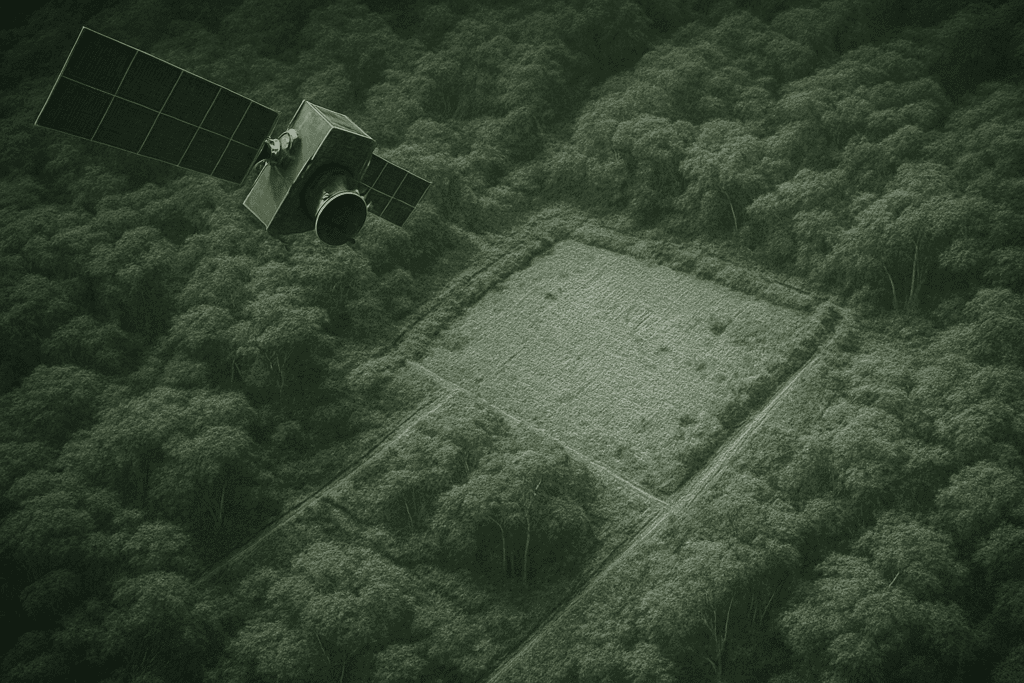
Longer wavelengths like L-band pass through tree cover and reach the ground, which is why they work better for InSAR over forests and farms.
SAR and InSAR Applications
Here is which method fits the most common jobs, and what each one delivers:
Application
Best method
What it delivers
Flood mapping
SAR
Water extent through cloud, often within hours of a pass
Ship detection and identification
SAR, then ISAR
Positions of every vessel, then the identity of one
City and infrastructure subsidence
PS-InSAR
Millimeters per year of sinking at buildings, rail, roads and bridges
Mines, tailings and dams
PS-InSAR and DInSAR
Early warning of slope, wall or dam movement
Pipelines
InSAR time series
Ground shifts and landslides along the route
Earthquakes and volcanoes
DInSAR
Maps of fault slip and swelling magma
Glaciers and ice sheets
InSAR and SAR offset tracking
Ice speed and where ice meets the sea floor
Crops, soil moisture and forests
SAR (S-, L- and P-band)
Crop type and growth, wet soil, tree cover and carbon
Satellite and debris checks
ISAR
Shape and spin of objects in orbit
In many projects the methods work together. For example, SAR maps a flood today, while InSAR shows which levees were already sinking before it arrived.
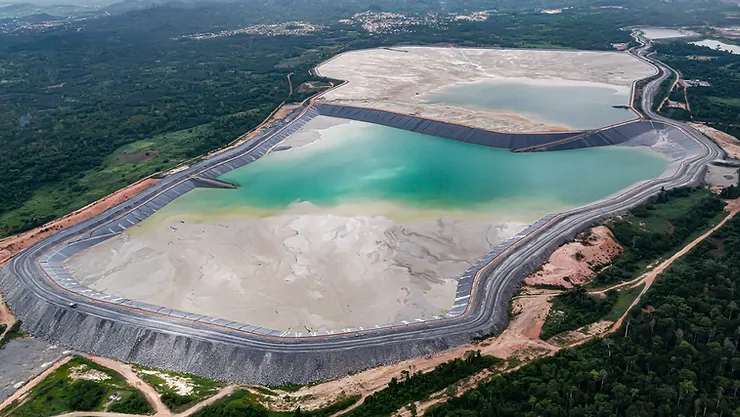
Tailings dams are a classic InSAR target: small movements in the walls can be spotted long before they become visible on site.
Limits to Know Before You Start
- SAR: speckle makes images grainy, tall objects lean toward the sensor and hide what is behind them, and reading the images takes practice.
- InSAR: water, dense forest at short wavelengths and fast-changing surfaces lose coherence. Changes in air moisture between passes can fake a few centimeters of movement, and results show only line-of-sight motion unless two directions are combined.
- ISAR: works only on moving targets, needs the target to turn or rock, and is mostly found in defense systems rather than commercial data.
SAR and InSAR Monitoring From XRTech
- LT-1 (A and B): an L-band SAR constellation designed for surface deformation interferometry, delivering 3 m InSAR data, millimeter-scale movement mapping and DEMs, with a 4-day revisit in formation.
- GF-3: C-band SAR with up to 1 m resolution in spotlight mode, 12 imaging modes and single, dual or full polarization, with revisit under 1 day across the constellation.
- Precision: 1 to 2 mm displacement accuracy for dams, mines, tailings facilities, pipelines, rail, bridges and city districts, including tailings dam monitoring with InSAR.
- Delivery: cloud delivery in GeoTIFF, SHP or DWG, in WGS84, UTM or local projections.
Frequently Asked Questions
Is InSAR the same as SAR interferometry?
Yes. InSAR, interferometric SAR and SAR interferometry all name the same method. DInSAR, PS-InSAR and SBAS are specific ways of applying it.
Can InSAR use any two SAR images?
No. Both images must come from the same satellite system, band and orbit track, with nearly the same viewing angle. They must also be complex images that keep the phase, usually called SLC (single look complex). Ordinary grey amplitude images will not work.
How accurate is InSAR?
With a long stack of images and stable targets, PS-InSAR can measure movement rates to about 1 to 2 mm per year. A single pair of images usually reaches about 1 cm, depending on weather and ground cover.
Is Sentinel-1 radar data free?
Yes. All Sentinel-1 data is free and open under the Copernicus program, which is why it is the most common starting point for InSAR studies.
Can inverse SAR work from a satellite?
Rarely. ISAR has to track a single target for a while, so it mostly runs on ships, aircraft and large ground radars. Earth observation satellites use SAR instead.
Can SAR see underground?
Only a little. Long wavelengths can reach a few meters into very dry sand, revealing buried riverbeds in deserts, and into dry snow and ice. In wet soil, the signal stops near the surface.
Need SAR Imagery or InSAR Monitoring?
Tell us your site and what you need to measure. We will recommend the right band, sensor and InSAR method, and deliver data ready for your GIS.
Open the Satellite Portal