30cm vs 50cm satellite imagery, in short: 30cm imagery has pixels that cover 0.3m of ground, so it shows about 2.8 times more pixels per km² than 50cm imagery (11.1 million vs 4 million). Choose 30cm when you need to recognise small objects such as vehicle types, road markings, rooftop equipment or utility poles, or when you need sharp stereo for 3D. Choose 50cm when you are mapping large areas, building basemaps, or monitoring land, crops and corridors, because it costs less per km² and some 50cm satellites image strips up to 130 km wide. XRTech Group supplies both: native 30cm from $20/km² and native 50cm from $13/km² in the archive, worldwide.
Picking between 30cm and 50cm satellite imagery is one of the most common decisions in a geospatial project, and the wrong choice is costly either way. Order 30cm for a whole province and you may pay a large premium for detail nobody uses. Order 50cm for an asset survey and your team may not be able to tell a pole from its shadow. This guide compares the two resolutions on every parameter that matters (GSD, accuracy, level of detail, swath, price, data volume, processing and value-added products) and ends with a simple rule for choosing. The specifications and prices come from the satellites and products XRTech Group supplies every day.
30cm vs 50cm Satellite Imagery: Quick Comparison Table
Parameter
30cm satellite imagery
50cm satellite imagery
Ground sample distance (GSD)
0.3m per pixel
0.5m per pixel
Pixels per km²
About 11.1 million
About 4 million
Detail compared with 50cm
About 2.8 times more pixels over the same area
Baseline
Smallest objects you can reliably map
Vehicle types, lane markings, rooftop units, utility poles, small trees
Buildings, cars as objects, roads, field boundaries, tree rows
Typical swath per pass
11.5 to 12 km
12 to 23.5 km, and 130 km with SuperView Neo-3
Geolocation accuracy without ground control
3.5m CE90 (SuperView Neo-1), under 10m CE90 (Beijing-3B)
9.5m to 10m CE90 (SuperView-1, SuperView Neo-3, Beijing-3A)
Archive price at XRTech Group
$20/km², minimum 25 km²
$13 to $14/km², minimum 25 km²
New tasking price at XRTech Group
$30/km², minimum 100 km²
$20 to $22/km², minimum 100 km²
Stereo for 3D and DEM
Yes, stereo and tri-stereo
Yes, stereo and tri-stereo
Data volume (4-band, 16-bit, uncompressed)
About 89 MB per km²
About 32 MB per km²
Best scale of work
Sites, cities, corridors, assets
Regions, provinces, countries
Best for
Engineering, urban 3D, asset inventory, AI object detection
Basemaps, land administration, agriculture, environment, wide-area monitoring
The pixel figures follow directly from the GSD: a 1 km² square holds 1,000 ÷ 0.3 ≈ 3,333 pixels per side at 30cm (about 11.1 million pixels) and 2,000 per side at 50cm (4 million pixels). The data volumes assume four bands at 16 bits per pixel with no compression; delivered GeoTIFFs are usually smaller.
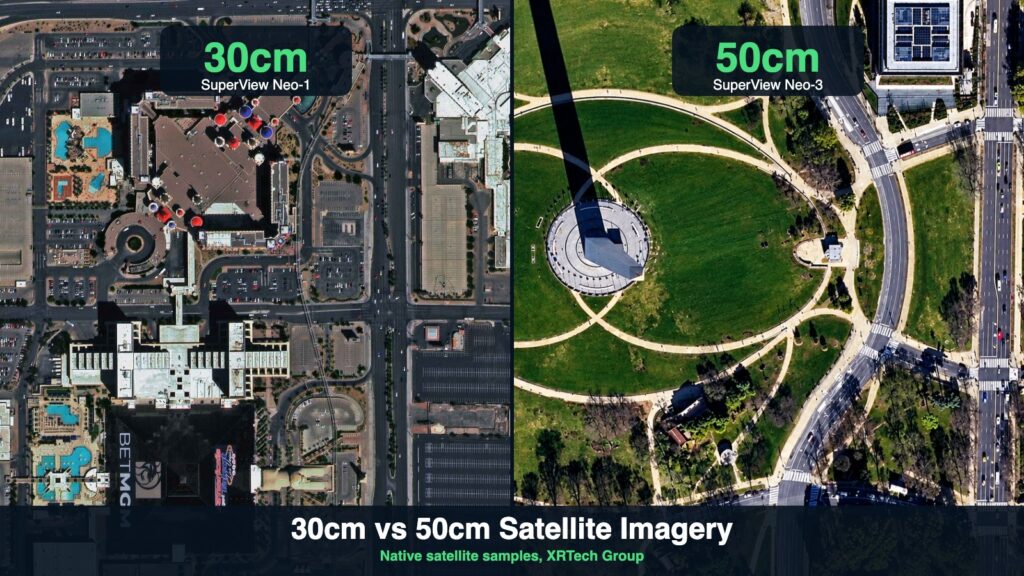
Native 30cm SuperView Neo-1 imagery (left, Las Vegas) next to native 50cm SuperView Neo-3 imagery (right, Washington DC).
What Is the Difference Between 30cm and 50cm Satellite Imagery?
The difference is the size of the ground area each pixel represents, called the ground sample distance (GSD). In 30cm imagery every pixel covers 30 × 30 cm on the ground; in 50cm imagery every pixel covers 50 × 50 cm. Because detail scales with area, not width, a 30cm image carries about 2.8 times more pixels than a 50cm image of the same place. That extra density is what turns a car-shaped blob into a car you can classify as a hatchback, a van or a pickup. Learn more about the measurement itself in our guide to ground sample distance.
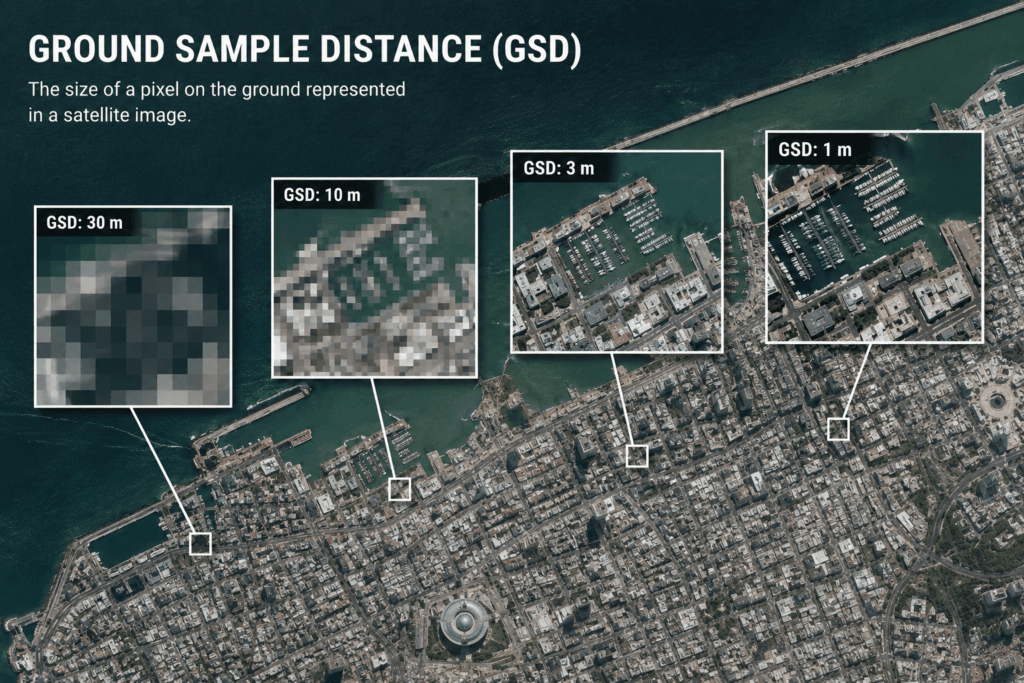
Ground sample distance is the size of the ground area one pixel represents: the smaller the GSD, the more detail each image holds.
Native Resolution vs Resampled Resolution
A resolution figure is only meaningful if it is native, meaning the sensor recorded that GSD on its focal plane. Some imagery sold as 30cm is resampled from 50cm data: it looks crisp on screen, but the extra pixels hold no new ground information, so edges blur, measurements drift and AI models learn from invented detail. Every 30cm and 50cm product XRTech Group supplies is native on the sensor. When you compare offers, ask for the native panchromatic GSD of the satellite, not just the delivered pixel size.
Why Viewing Angle Changes Real Resolution
Satellites rarely look straight down. When a 30cm satellite images at a steep off-nadir angle, the effective GSD on the ground grows, and tall buildings lean more. For measurement work, set a viewing-angle limit on the order. At XRTech Group, a 15° or lower angle is a $3/km² add-on and 10° or lower is $9/km², on both resolutions.
Level of Detail: What You Can See at 30cm vs 50cm
The practical question is not "which is sharper" but "can I see the object I care about". The table below converts real object sizes into pixels at each resolution.
Object (typical size)
Pixels at 30cm
Pixels at 50cm
What it means
Car (4.5 × 1.8 m)
About 15 × 6 (90 pixels)
About 9 × 4 (32 pixels)
Both show cars; 30cm separates car, van and pickup
Bus or truck (12 × 2.5 m)
About 40 × 8
About 24 × 5
Both clear; 30cm shows trailers and loads
Single-family house (12 × 10 m)
About 40 × 33
About 24 × 20
Both map footprints; 30cm shows roof shape and rooftop units
Road lane (3.5 m wide)
About 12 pixels across
About 7 pixels across
Lane counts work at both; 30cm shows dashed markings more clearly
Tree crown (3 m)
About 10 pixels across
About 6 pixels across
Tree counting is far more reliable at 30cm
Utility pole or person (0.3 to 0.5 m)
1 to 2 pixels
About 1 pixel
Shadows help at 30cm; neither identifies people
Neither resolution can identify a person or read a number plate. A person is only one or two pixels across even at 30cm. For finer work, XRTech Group also supplies 25cm satellite imagery, and for wider areas at lower cost there is 80cm imagery.
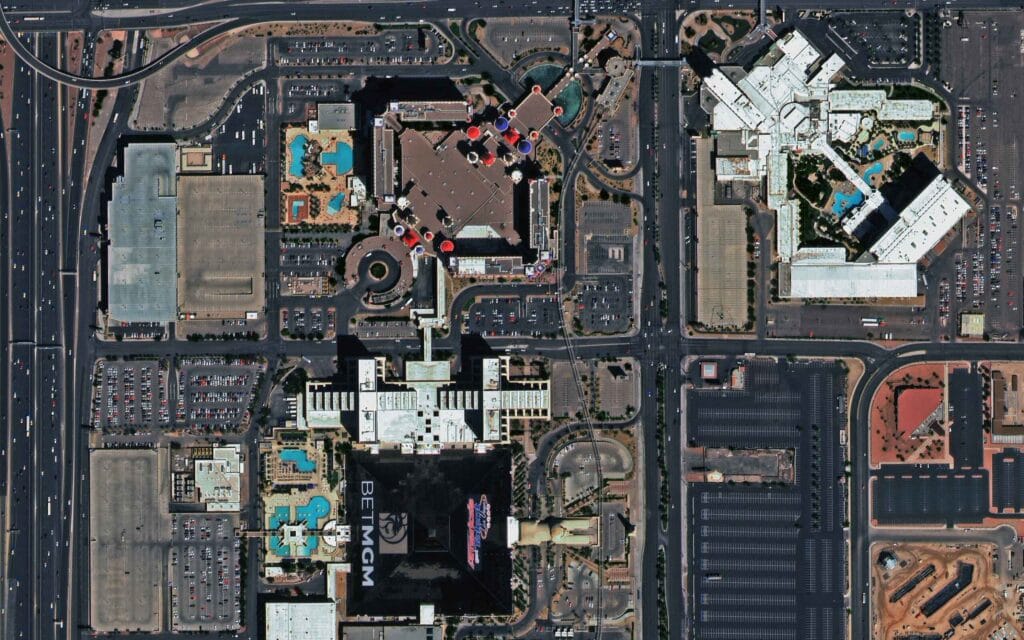
Native 30cm satellite imagery of Las Vegas from SuperView Neo-1: vehicle types, parking bays, pools and rooftop equipment are distinct.
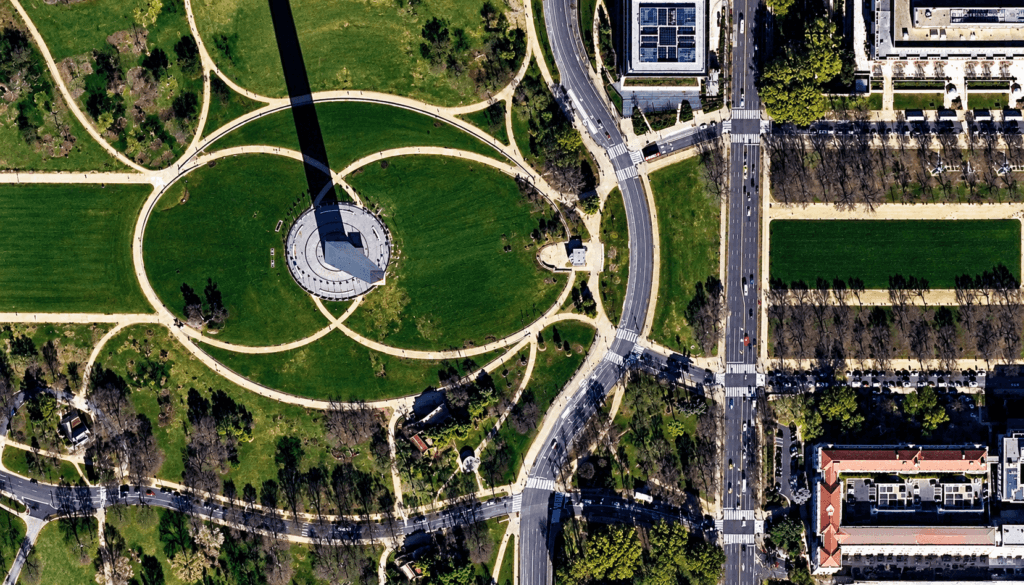
Native 50cm satellite imagery of Washington DC from SuperView Neo-3: buildings, roads, lanes, cars and tree rows are clear across a wide area.
Does Higher Resolution Improve AI Object Detection?
Yes, measurably. In a published CosmiQ Works study on satellite object detection, model accuracy (mAP) was 0.53 at 30cm and fell to 0.11 at 4.8m, and a follow-up analysis reported a 22% to 27% drop in performance between 30cm and 120cm. There is no widely published benchmark that isolates 30cm against 50cm, so test a labelled sample of your own area before committing a large order. As a rule of thumb, small-object models (vehicles, poles, solar panels, small boats) benefit most from 30cm, while building-footprint and land-cover models usually perform well at 50cm.
Accuracy: CE90, Orthorectification and Map Scale
Resolution and positional accuracy are different things. GSD tells you how small a feature you can see; CE90 tells you how close each pixel is to its true position on Earth (90% of points fall within the stated radius). Without ground control, SuperView Neo-1 30cm imagery is rated at 3.5m CE90, while the 50cm satellites XRTech Group supplies are rated at about 9.5m to 10m CE90. Orthorectification with a good elevation model and ground control points improves positional accuracy for both. See our guide to CE90 horizontal accuracy for how to specify it in a tender.
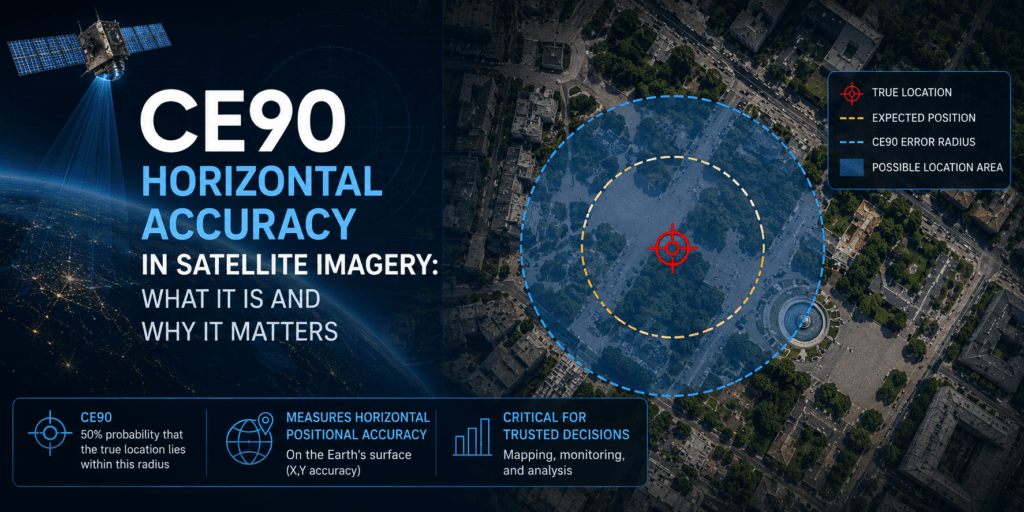
CE90 is the radius within which 90% of image points fall from their true position on Earth.
Requirement
30cm
50cm
Indicative map scale (depends on your national standard)
About 1:2,000 to 1:5,000
About 1:5,000 to 1:10,000
Geolocation accuracy without ground control
3.5m CE90 (SuperView Neo-1)
9.5m to 10m CE90
Stereo elevation
DEM with about ±3m vertical accuracy (RMSE) from 30cm stereo
DEM and DSM for regional terrain and volumes
Engineering-grade measurement
Recommended
Planning-grade use
Map scale guidance varies by country. An ISPRS rule of thumb ties map accuracy to about 0.25 mm at map scale, which puts 0.5m GSD in the range needed for 1:10,000 mapping, while some national standards ask for finer GSD at each scale. Check the specification your project follows before ordering.
Coverage, Swath and Revisit
Coverage is where 50cm pulls ahead. Most 30cm satellites image a strip about 12 km wide, so a large province needs many passes and weather windows. 50cm satellites range from 12 km to 23.5 km per pass, and SuperView Neo-3 images a 130 km strip at 50cm, more than ten times the width of a typical 30cm satellite. For large areas that means fewer collection windows, fewer cloud gaps and a more uniform mosaic.
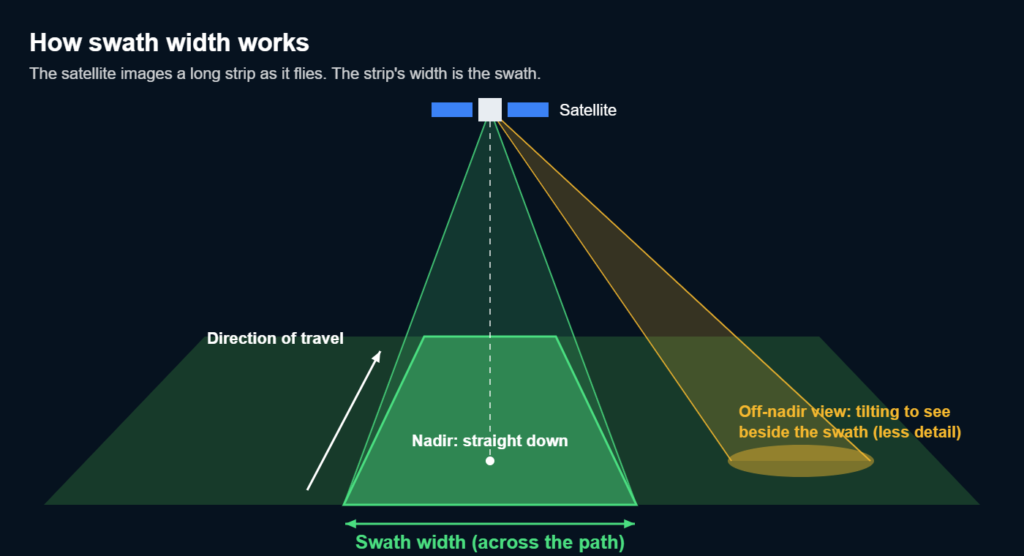
Swath width is the strip a satellite images as it flies; wider swaths cover large areas in fewer passes.
Satellite
Resolution
Swath
Accuracy (CE90, no ground control)
SuperView Neo-1 (01/02)
30cm native, 4 bands
12 km
3.5m
Beijing-3B (BJ3N)
30cm native, 4 bands
11.5 km
Under 10m
SuperView-1 (4 satellites)
50cm native, 4 bands
12 km
9.5m
SuperView Neo-3
50cm native, 8 bands
130 km
10m
Beijing-3A and 3C
50cm native, 4 bands
23.5 km
Under 10m
Revisit also differs. SuperView-1 can revisit daily at under 45° off-nadir, SuperView Neo-3 every one to three days, and the 30cm SuperView Neo-1 offers daily-capable revisit. Other 30cm-class systems on the market include WorldView-3, WorldView Legion and Pléiades Neo.
30cm vs 50cm Satellite Imagery Price
XRTech Group publishes fixed prices per km² for both resolutions, for any location worldwide. Here they are side by side:
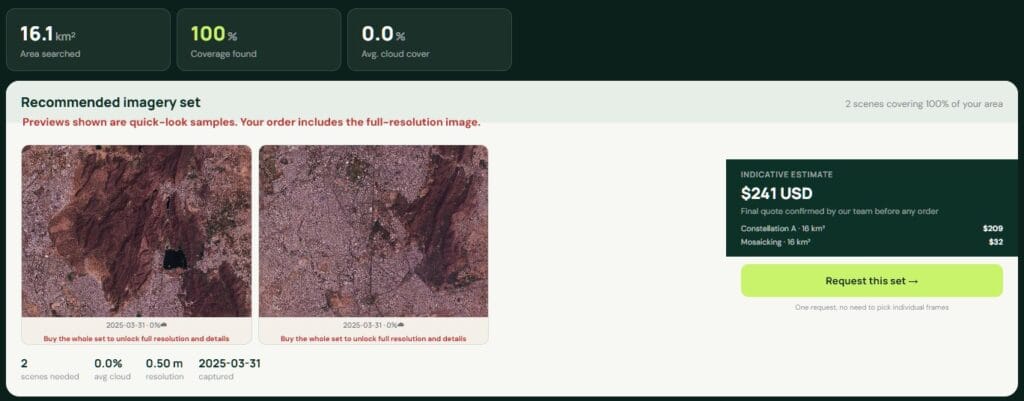
XRTech Group portal archive search: preview scenes over your area with capture date, cloud cover and an instant price before ordering.
Order type
30cm price
50cm price
Archive (minimum 25 km²)
$20/km²
$13 to $14/km²
New tasking (minimum 100 km²)
$30/km²
$20 to $22/km²
Priority tasking
$45/km²
$37/km²
Emergency tasking
$80/km²
$66/km²
Stereo pair
2 × mono ($60/km² for 30cm tasking)
2 × mono
Cloud cover limit add-on
10% or less +$8/km², 5% or less +$15/km²
10% or less +$8/km², 5% or less +$15/km²
Volume pricing
From 250 km²
From 250 km²
Worked example for 1,000 km²: archive coverage costs about $20,000 at 30cm list price and about $13,000 to $14,000 at 50cm, before volume pricing. New tasking costs about $30,000 at 30cm and about $20,000 to $22,000 at 50cm. In other words, 50cm saves roughly a third of the budget, which is why many programmes mix the two. See the full satellite imagery pricing page for every tier.
Data Volume, Processing and Storage
Higher resolution means more data to move, store and process. Using four bands at 16 bits and no compression, 30cm imagery is about 89 MB per km² and 50cm about 32 MB per km². For a 10,000 km² basemap that is roughly 890 GB against 320 GB before compression. Model inference, tiling and mosaicking time scale in a similar way. If your team works on standard laptops or a modest cloud budget, 50cm keeps national-scale projects manageable, while 30cm is easy to handle for cities and project sites.
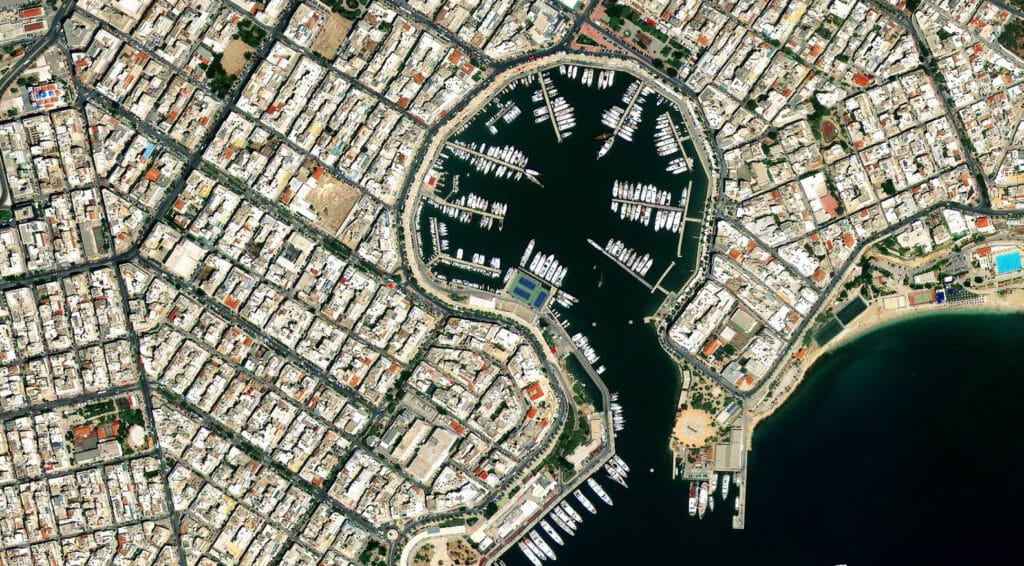
Native 50cm Beijing-3A imagery of a Greek port, delivered as orthorectified GeoTIFF ready for GIS.
Both resolutions are delivered by XRTech Group as GeoTIFF in WGS84 or UTM, as Level 1B for your own processing or orthorectified Level 2A, ready for QGIS, ArcGIS and CAD. 30cm and 50cm are both pan-sharpened from a native panchromatic band; SuperView Neo-3 50cm adds eight multispectral bands (including red-edge and coastal blue) for vegetation and water analysis.
Basemaps: When to Use 30cm, 50cm or Both
For a city basemap, 30cm is the standard: street furniture, parking, building outlines and construction stages all read clearly. For a national or provincial basemap, 50cm is usually the better value because the wide swath gives a more uniform, cloud-free mosaic in fewer passes. Many of the best basemaps combine both: 30cm over urban cores, ports, industrial zones and corridors, and 50cm everywhere else. XRTech Group plans mixed-resolution programmes in one order, colour-balances the two and delivers one seamless mosaic.
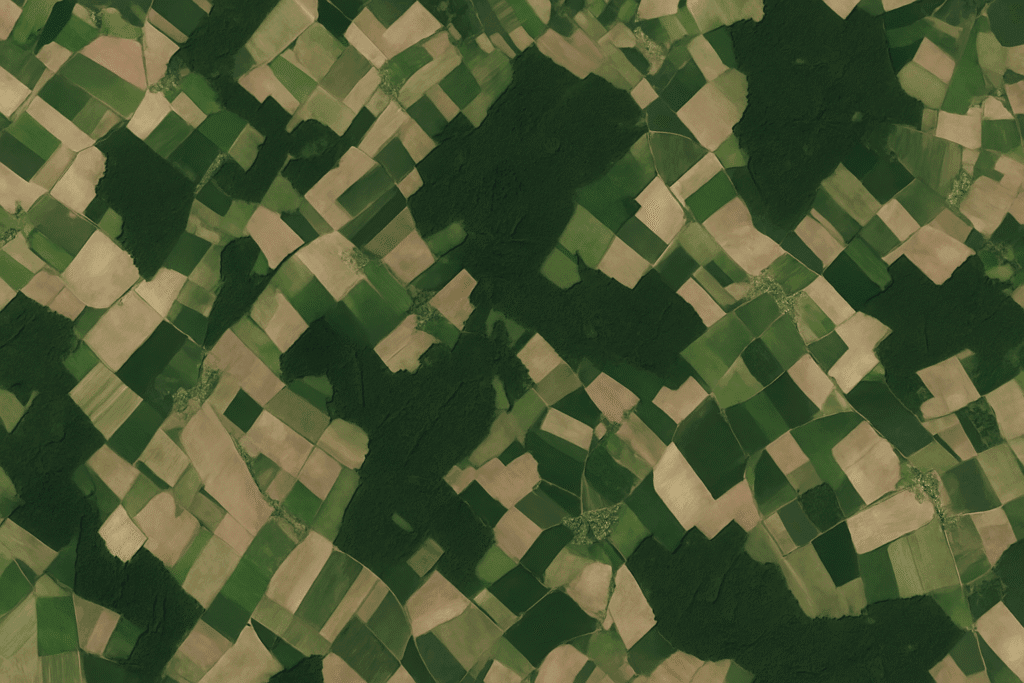
A seamless, colour-balanced mosaic of orthorectified scenes over farmland: the kind of wide-area basemap where 50cm usually gives the best value.
Value-Added Products From 30cm and 50cm Imagery
Product
From 30cm
From 50cm
Orthorectified imagery and mosaics
City-scale engineering basemaps
Regional and national basemaps
DEM, DSM and DTM from stereo
Detailed urban terrain, stockpile volumes
Regional terrain, watershed and road design
3D city models and digital twins
Building heights and roof shapes
Block-level 3D for planning
Change detection
New structures, vehicles, construction stages
Land use change, deforestation, urban growth
AI feature extraction
Vehicles, poles, solar panels, trees
Building footprints, roads, field boundaries
Vegetation and water indices
4-band NDVI at fine scale
8-band indices with red-edge (SuperView Neo-3)
Read more about stereo satellite imagery and our DEM services.
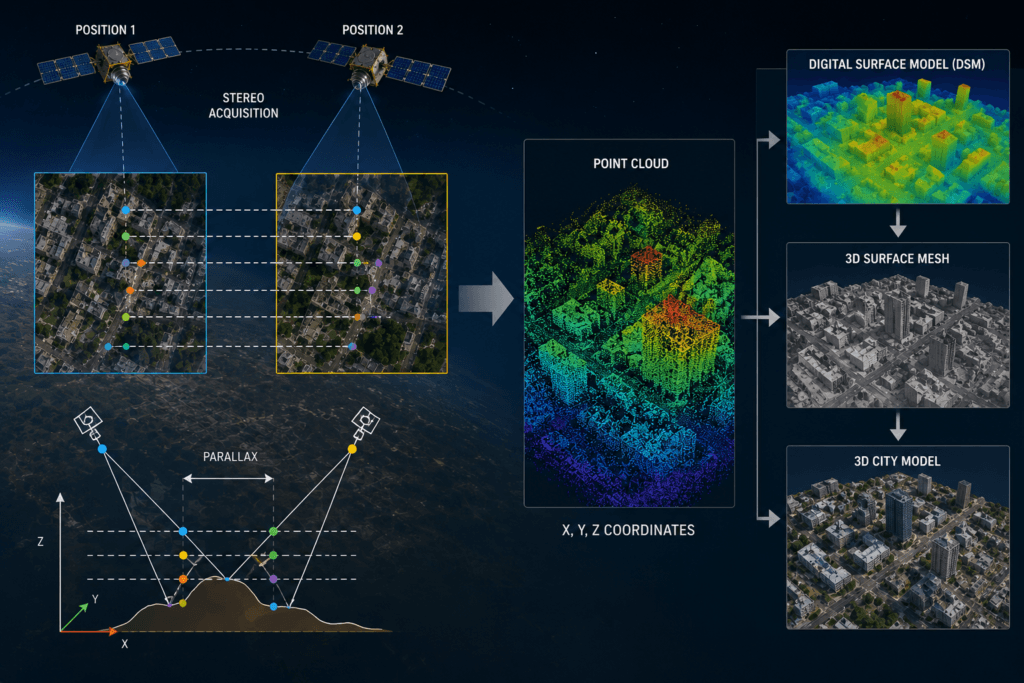
Stereo acquisition: two views of the same area produce a point cloud, a digital surface model and a 3D city model.
30cm vs 50cm Use Cases by Industry
Use case
Better choice
Why
Urban planning and 3D city models
30cm
Roof shapes, building heights from stereo, street detail
Construction progress monitoring
30cm
Shows equipment, materials and stage-by-stage change
Asset and utility inventory (poles, towers, substations)
30cm
Small objects need more pixels
Mining pits, haul roads and stockpiles
30cm for sites, 50cm for concessions
Volumes need sharp stereo; exploration areas are wide
Insurance and property risk
30cm
Roof condition, pools, outbuildings
National and provincial basemaps
50cm
Wide swath, uniform mosaic, lower cost
Land administration and cadastre support
50cm (30cm in dense urban areas)
Parcels and buildings are clear at 50cm
Agriculture and plantations
50cm
Field boundaries and crop health over large areas; 30cm for tree counting
Pipeline, road and border corridors
50cm
Long strips are collected in fewer passes
Environment, forestry and coastlines
50cm
Land cover change over wide areas
Disaster damage assessment
30cm for damage, 50cm for extent
Building-level damage needs detail; flood extent needs coverage
See how each sector uses imagery on our pages for construction, real estate, agriculture and oil and gas.
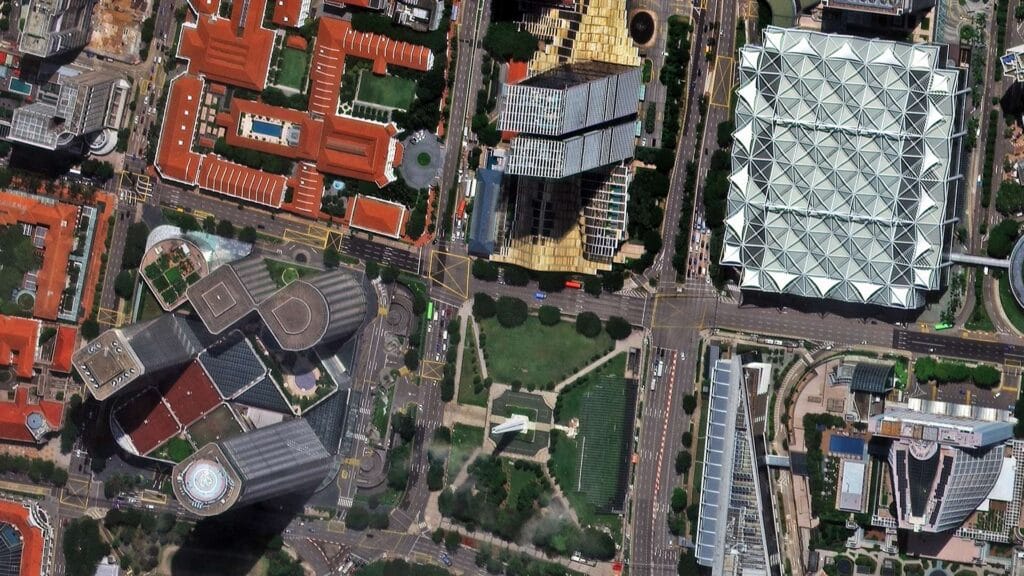
Native 30cm satellite imagery of Raffles City, Singapore: dense urban detail where 30cm is the better choice.
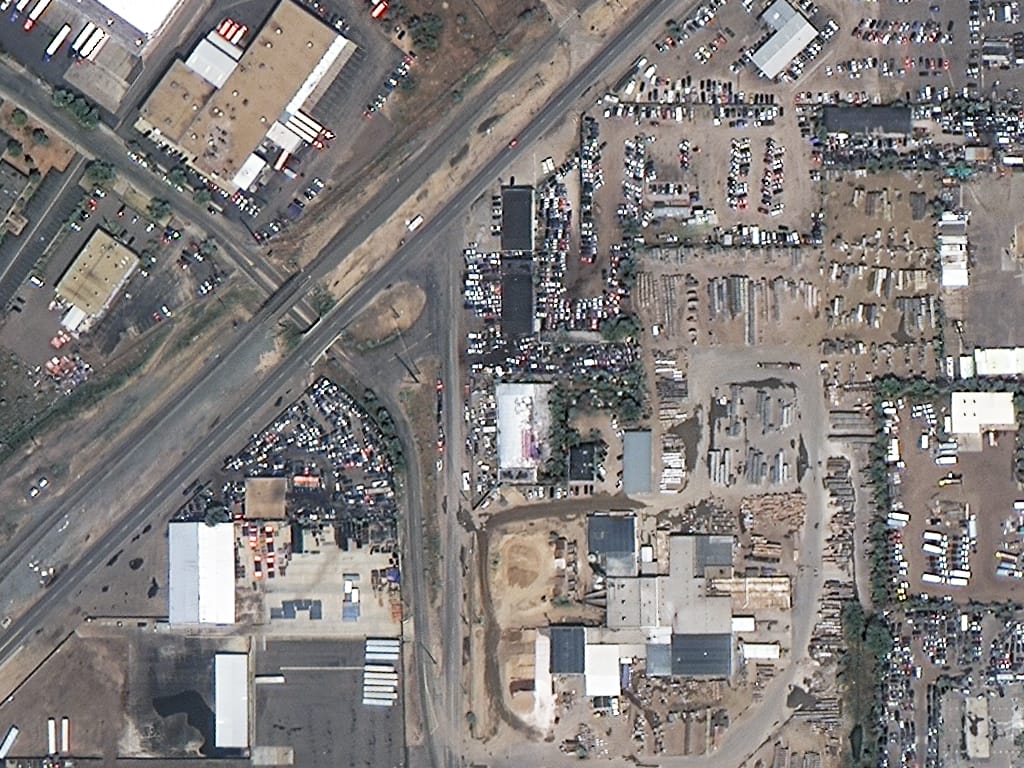
Native 50cm SuperView-1 imagery of an industrial district in Denver: buildings, yards and parked vehicles are clear at 50cm.
Characteristics of 30cm Satellite Imagery
- Native 0.3m panchromatic GSD with 1.2m four-band multispectral, pan-sharpened to 0.3m
- About 11.1 million pixels per km²
- Swath of about 12 km per pass
- Best positional accuracy of the two (3.5m CE90 without ground control on SuperView Neo-1)
- Stereo and tri-stereo for detailed DEMs and 3D city models
- Higher price and data volume per km²
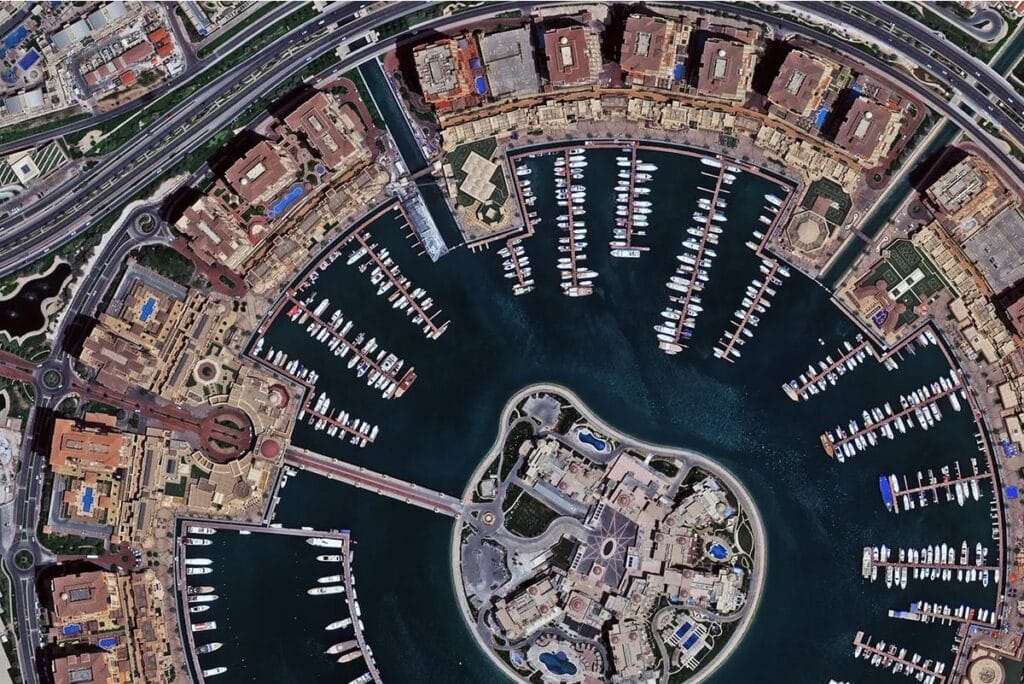
Native 30cm SuperView Neo-1 imagery of The Pearl, Doha: individual boats, rooftops and road markings are distinct.
Explore 30cm satellite imagery from XRTech Group.
Characteristics of 50cm Satellite Imagery
- Native 0.5m panchromatic GSD with 2m multispectral (four or eight bands), pan-sharpened to 0.5m
- About 4 million pixels per km²
- Swaths from 12 km to 130 km per pass
- Deep archives from SuperView-1, SuperView Neo-3 and Beijing-3A
- Stereo and tri-stereo available
- About a third less per km² than 30cm, with smaller files
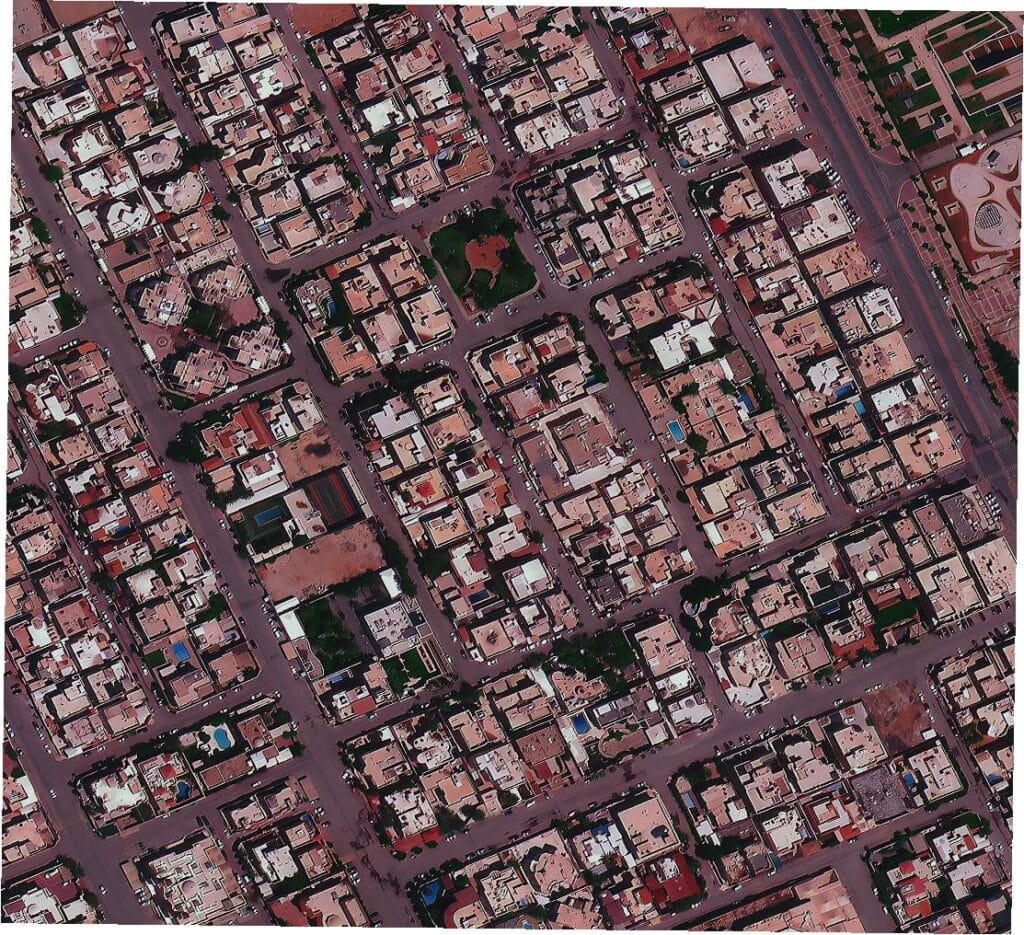
Native 50cm satellite imagery of a residential district in Riyadh: every building, street and courtyard is mapped clearly.
Explore 50cm satellite imagery from XRTech Group.
Which Should You Choose: 30cm or 50cm?
Use this simple rule: choose the coarsest resolution that still shows your smallest important object with at least a few pixels across it. Then check three more things:
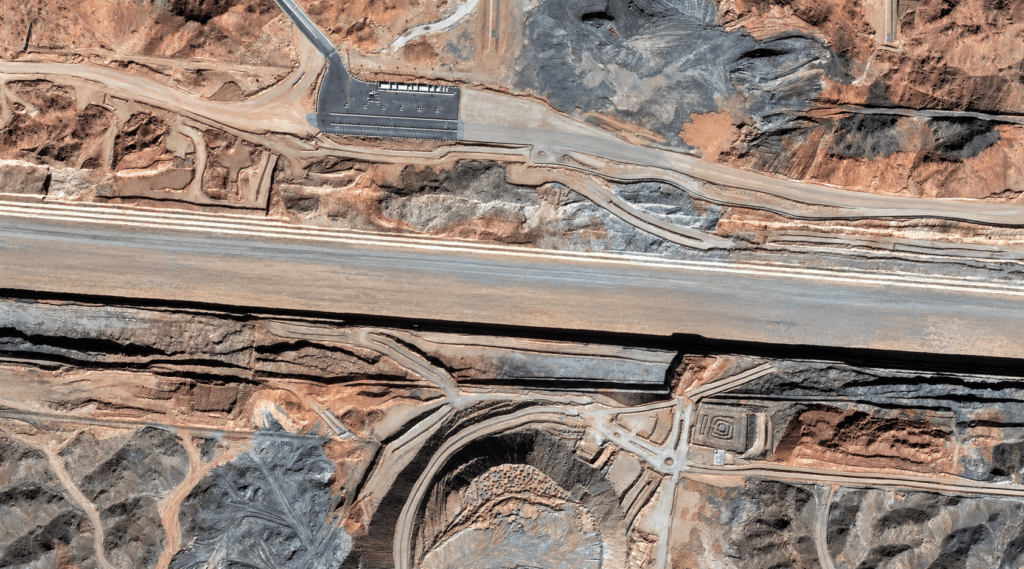
Native 30cm satellite imagery of a road and mining corridor in Saudi Arabia: site detail where engineers need to measure.
- Area size: under a few hundred km² of urban or industrial area, 30cm is usually worth it. Over a few thousand km², start from 50cm and add 30cm only where the detail pays off.
- Measurement needs: if engineers will measure from the image or build 3D models, choose 30cm with a viewing-angle limit and stereo.
- Budget and timeline: 50cm costs about a third less and wide-swath collection fills large areas faster.
If you are still unsure, XRTech Group sends a free sample tile of your own area at each resolution with a formal quote, so your team can judge before it buys. You can also compare other tiers in our guide to what counts as high resolution.
How to Order 30cm or 50cm Imagery From XRTech Group
- Search your location in our self-service portal, with no account needed, to see archive scenes, capture dates, cloud cover and an instant price, or send us your area as KML, KMZ or SHP.
- Choose archive or new tasking, the resolution (30cm, 50cm or both) and any add-ons such as cloud limits, viewing angle or stereo.
- Receive a written quote within 24 hours, then GIS-ready GeoTIFF delivery. Archive scenes arrive within 48 hours of approval; tasked areas follow as they are collected.
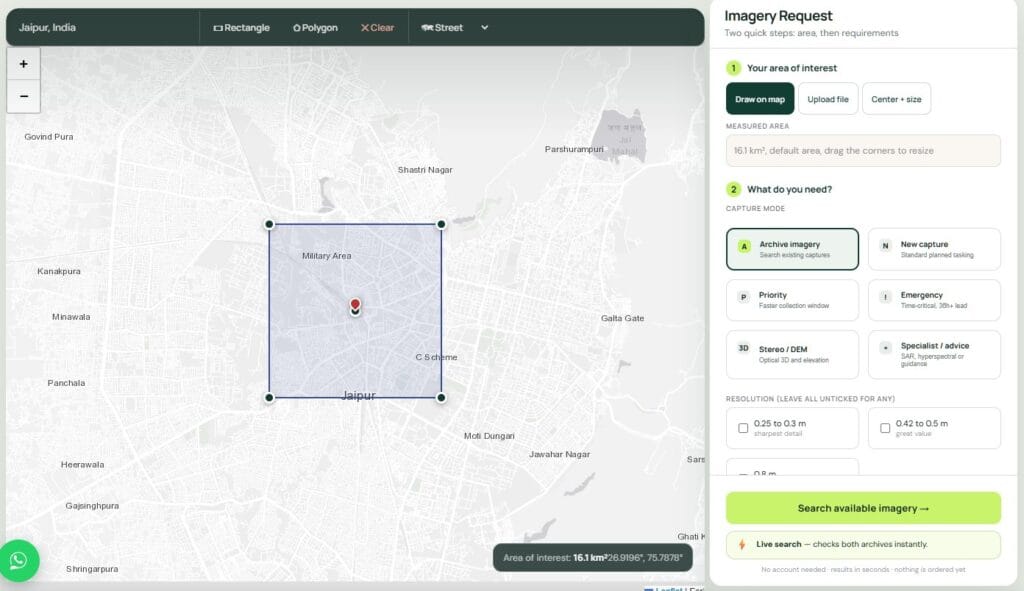
The XRTech Group portal: draw an area of interest, then compare archive scenes and prices before ordering.
Get 30cm or 50cm Satellite Imagery for Your Area
Draw your area to see archive scenes and an instant price at both resolutions, or send us a KML, KMZ or SHP for a written quote within 24 hours with a free sample tile. Compare every tier on our high-resolution satellite imagery page.
30cm vs 50cm Satellite Imagery FAQs
What is the difference between 30cm and 50cm satellite imagery?
The difference is pixel size. In 30cm imagery each pixel covers 0.3m on the ground, and in 50cm imagery each pixel covers 0.5m. That gives 30cm about 2.8 times more pixels over the same area (11.1 million vs 4 million per km²), so smaller objects such as vehicle types, road markings and rooftop equipment are easier to recognise.
Is 30cm better than 50cm satellite imagery?
30cm is sharper, but not always better for the project. It is the right choice for small-object detection, engineering measurement and detailed 3D. 50cm is often better for large areas because it costs about a third less per km², produces smaller files and some 50cm satellites image strips up to 130 km wide.
How much does 30cm vs 50cm satellite imagery cost?
At XRTech Group, 30cm archive imagery costs $20/km² (minimum 25 km²) and new 30cm tasking costs $30/km² (minimum 100 km²). 50cm archive imagery costs $13 to $14/km² and new 50cm tasking costs $20 to $22/km². Volume pricing applies from 250 km² for both.
Can you see cars in 50cm satellite imagery?
Yes. A typical car is about 9 × 4 pixels at 50cm, so cars are clearly visible and countable. At 30cm the same car is about 15 × 6 pixels, which makes it easier to separate cars, vans and pickups.
Can you see people in 30cm satellite imagery?
No. A person is only one or two pixels across at 30cm, so people cannot be identified, and number plates cannot be read at either resolution.
What is GSD in satellite imagery?
Ground sample distance (GSD) is the ground distance covered by one pixel. A 30cm GSD means each pixel represents 30 × 30 cm on the ground. Lower GSD means finer detail.
Which resolution is best for a national basemap?
50cm is usually best for national and provincial basemaps because wide-swath satellites such as SuperView Neo-3 collect 130 km strips, which gives a more uniform, cloud-free mosaic at a lower price. Many programmes add 30cm over cities and industrial zones.
Is 30cm imagery more accurate than 50cm?
Usually. Without ground control, SuperView Neo-1 30cm imagery is rated at 3.5m CE90, while the 50cm satellites XRTech Group supplies are rated at about 9.5m to 10m CE90. Orthorectification with ground control points improves both.
What map scale can 30cm and 50cm imagery support?
As a guide, 30cm supports mapping around 1:2,000 to 1:5,000 and 50cm around 1:5,000 to 1:10,000. The exact scale depends on your national mapping standard and on orthorectification quality.
Does XRTech Group supply both 30cm and 50cm imagery?
Yes. XRTech Group supplies native 30cm imagery from SuperView Neo-1 and Beijing-3B, native 50cm imagery from SuperView-1, SuperView Neo-3 and Beijing-3A, and 25cm imagery for projects that need more detail. Both resolutions are available as archive or new tasking for any location worldwide, delivered as GIS-ready GeoTIFF.
Can I mix 30cm and 50cm in one project?
Yes. XRTech Group plans mixed-resolution orders, for example 30cm over cities and corridors and 50cm over the rest of a region, then colour-balances them into one seamless mosaic.
Is 30cm imagery ever resampled from 50cm?
Some imagery sold as 30cm is resampled from coarser data. It looks sharp but holds no extra ground information. Always ask for the native panchromatic GSD of the satellite. All 30cm and 50cm imagery from XRTech Group is native.
How We Checked These Facts
XRTech Group compared 30cm and 50cm imagery using the published specifications of the satellites we supply (SuperView Neo-1, Beijing-3B, SuperView-1, SuperView Neo-3, Beijing-3A and 3C) and our own list prices in US dollars per km². Pixel counts and data volumes are calculated from GSD. Object detection figures come from published CosmiQ Works research, and map scale guidance from ISPRS and FIG papers. Prices are list prices before volume pricing; your written quote confirms the final rate.
Sources
- XRTech Group: 30cm and 50cm satellite imagery specifications and price lists
- CosmiQ Works (arXiv 1812.04098): The Effects of Super-Resolution on Object Detection Performance in Satellite Imagery
- CosmiQ Works, The DownlinQ: Super-Resolution and Object Detection, a Love Story (epilogue)
- ISPRS Archives: Information contents of high resolution satellite images (Topan and others)
- FIG Working Week proceedings: relationship between GSD, map scale and accuracy
- China Great Wall Industry Corporation: SuperView Neo-3 02 launch
- eoPortal: Beijing-3 mission

Mustafa Jawaad
General Manager, XRTech Group
Mustafa helps governments and critical industries get satellite and UAV data in days rather than weeks, from archive search and new satellite tasking to processed maps, so teams can plan infrastructure faster and with less risk. Connect on LinkedIn.