Satellite Imagery vs Satellite Maps: What Is the Difference?

Quick Answer:

Satellite imagery is a raw snapshot of the Earth’s surface captured by a sensor at a specific point in time. A satellite map is a processed, stitched, and annotated product built from multiple images, corrected for terrain distortion, colour-balanced for visual consistency, and designed to serve as a navigation or planning layer. Imagery is used for analysis and detection. Maps are used for context and reference. Both start from the same sensor data but serve completely different purposes.


Intro

Satellite imagery and satellite maps both come from satellites. That is where the similarity ends. The way they are processed, what they show, and what they are used for are fundamentally different. Choosing the wrong one for your project means either getting data that cannot answer your question or paying for analytical depth you do not need.


What Is Satellite Imagery?

Las Vegas Airport USA 30cm high resolution satellite imagery — optical earth observation data showing urban infrastructure and the Las Vegas Strip — buy satellite images globally from XRTech Group
High resolution satellite imagery sample of Las Vegas, USA — 30cm optical data

Satellite imagery refers to individual scenes or frames captured by a satellite sensor at a specific point in time. Each scene covers a defined footprint on the ground and records the reflected or emitted energy at that exact moment.

Raw imagery is a snapshot. It shows ground conditions as they were when the satellite passed overhead. That means it may contain cloud cover, shadows, seasonal vegetation, flood water, or construction progress at that date. This is not a flaw. It is the entire point.

Imagery is used when the moment of capture matters. Before and after a flood, fire, or earthquake. Weekly progress on a construction site. A specific crop growth stage. An active oil spill. In every case, the temporal precision of the image is what makes it analytically valuable.


What Satellite Imagery Includes

  1. Mono imagery (2D): A single scene captured at nadir or off-nadir. The standard starting point for most visual analysis, land use mapping, and change detection workflows.
  2. Multispectral imagery: Captures 4 to 8 bands beyond visible light including near-infrared, red edge, and shortwave infrared. Used for vegetation health indices (NDVI), crop stress monitoring, water body mapping, and burn severity assessment.
  3. Hyperspectral imagery: Captures hundreds of narrow bands for chemical fingerprinting of minerals, pollutants, and soil composition. Used in geology, precision agriculture, and environmental monitoring.
  4. SAR imagery: Uses radar to capture data through cloud, smoke, and darkness. Used for flood mapping, ice monitoring, maritime surveillance, and InSAR deformation detection.
  5. High bit depth data: Imagery is delivered at 11-bit or 16-bit depth for scientific modelling and Top of Atmosphere (TOA) corrections where precise radiometric values matter.


Key Characteristics of Satellite Imagery

FeatureDetail
FormIndividual scenes or frames
TimingSpecific date and time of capture
Processing levelRaw (L1A), georeferenced (L2A), or orthorectified (L3)
Spectral optionsPanchromatic, multispectral, hyperspectral, SAR
Bit depth8-bit, 11-bit, or 16-bit
TaskableYes, you can direct a satellite to capture a specific location
Cloud coverMay be present in optical imagery
Primary useAnalysis, detection, and change tracking


What Is a Satellite Map?

image of a property satellite imagery online free with area marked. How to Get Free Satellite Imagery of Your Property

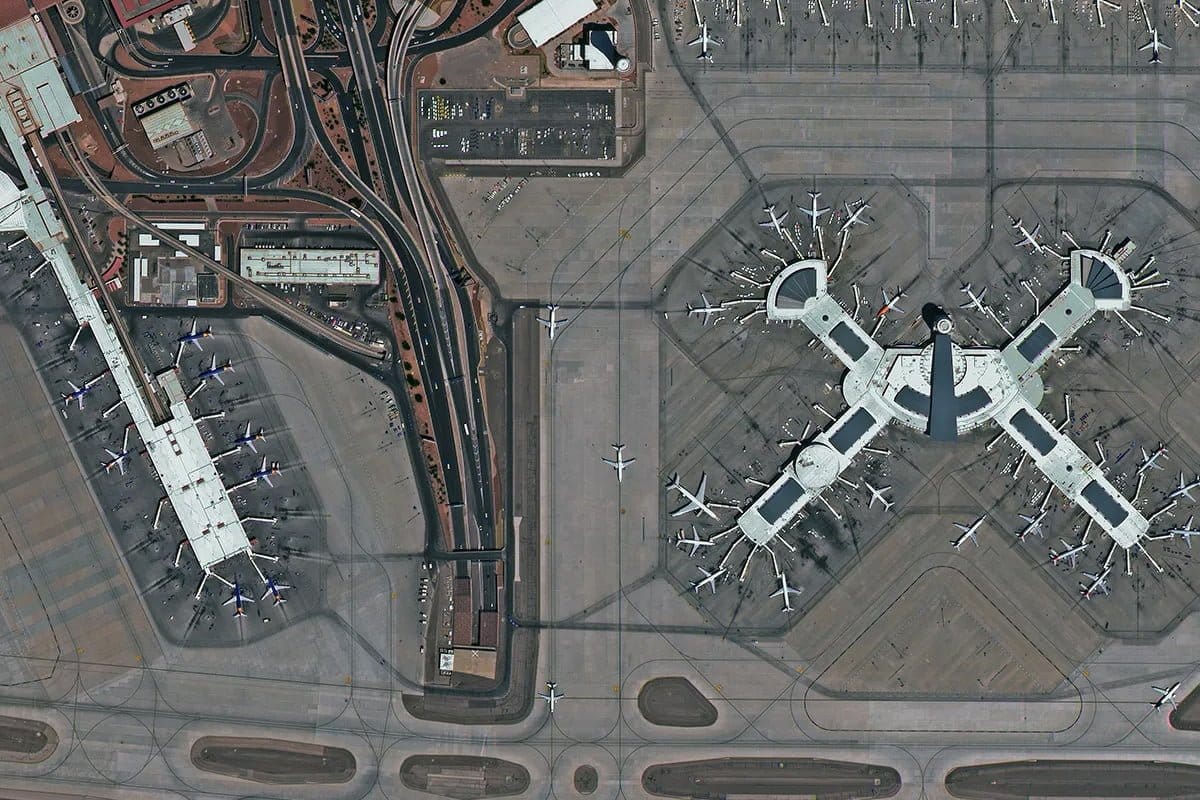
A satellite map, also called a basemap, mosaic, or Digital Orthophoto Map (DOM), is a product built from multiple satellite images stitched together into a single seamless layer. It is not a snapshot of one moment. It is a composite of the best available imagery across a region, assembled to give a visually consistent, geometrically accurate view of the Earth’s surface.

The key word is processed. Satellite maps go through orthorectification to remove terrain and angle distortions, colour balancing to make adjacent scenes visually consistent, cloud and shadow removal to eliminate obstructions, and mosaicking to stitch scenes into a continuous layer with no visible seams.

The result is a product that looks uniform, is tied precisely to geographic coordinates, and loads cleanly into GIS platforms, mobile mapping apps, and urban planning tools. It does not tell you what happened at a specific moment. It tells you what the area looks like as a reliable spatial reference.


What Satellite Maps Include

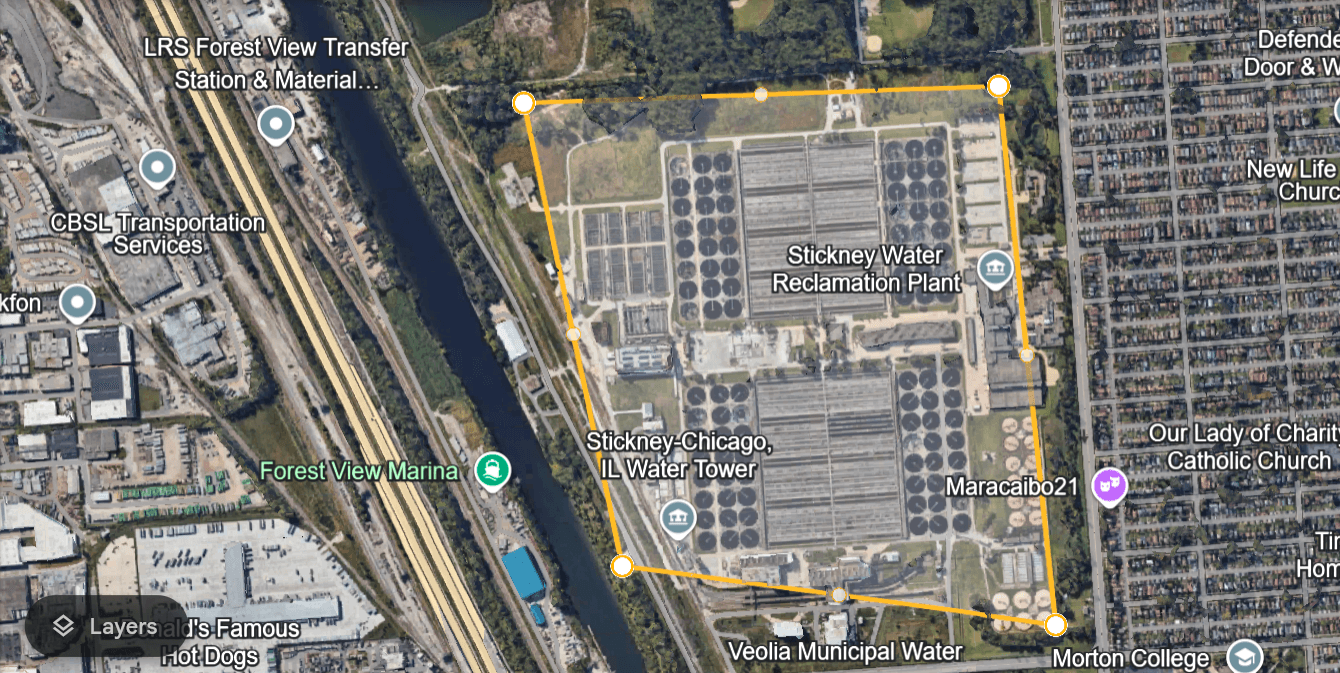
  1. Digital Orthophoto Maps (DOM): Orthorectified, georeferenced image mosaics delivered at 8m CE90 horizontal accuracy. Used as base layers in GIS, CAD, and planning tools.
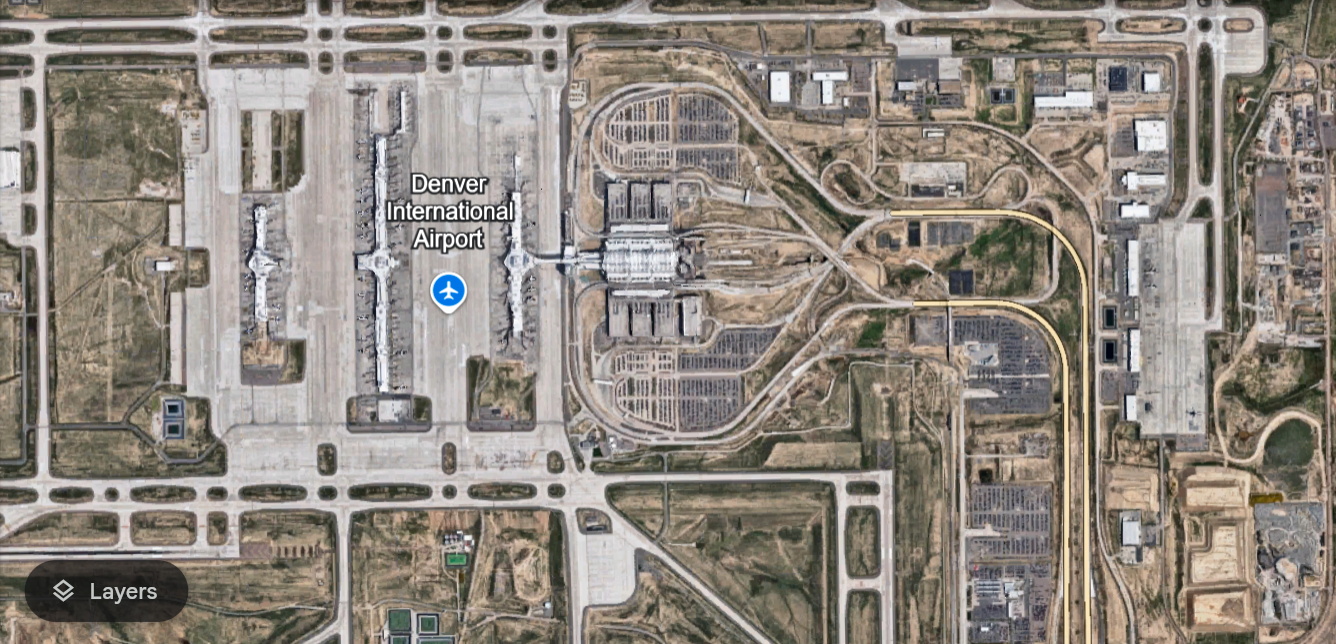
  2. Vivid imagery series: Processed and colour-balanced regional mosaics that present a visually seamless view across large areas. Cloud cover, seasonal colour variation, and scene seams are removed.
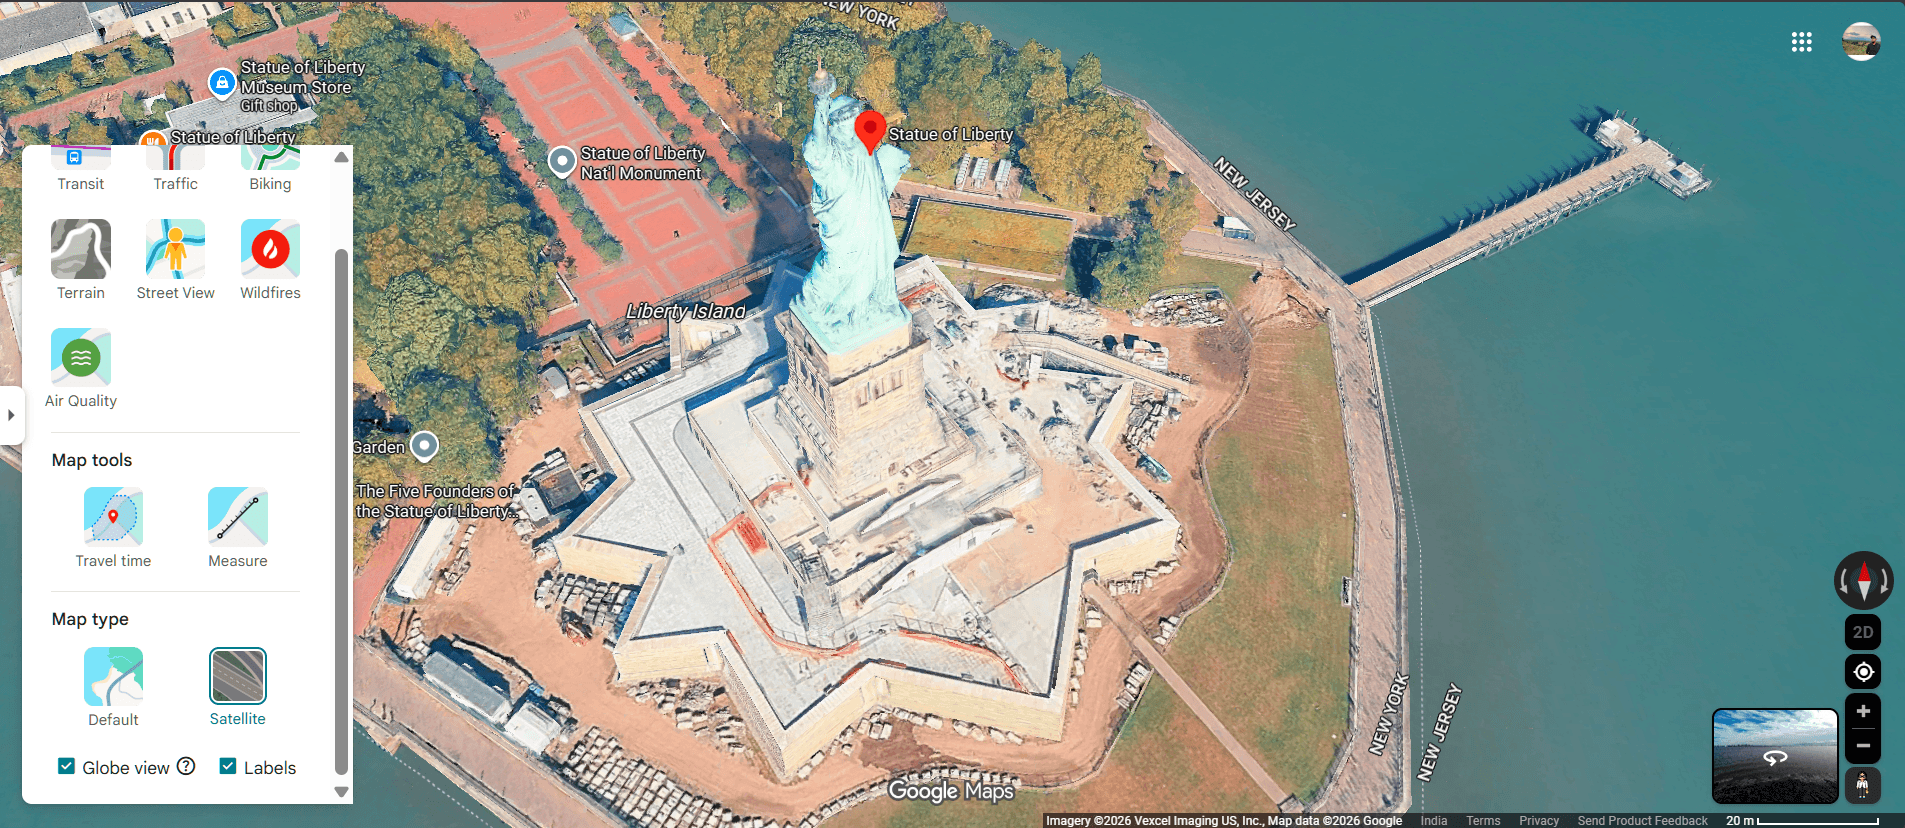
  3. Annotated consumer maps: Products like Google Maps and Apple Maps that combine processed satellite imagery with vector overlays: road names, business locations, transit lines, and place labels. These are satellite maps designed for navigation, not analysis.


Key Characteristics of Satellite Maps

FeatureDetail
FormStitched mosaic of multiple scenes
TimingComposite of best available images over time
Processing levelFully processed, orthorectified, colour-balanced
Spectral optionsTypically RGB (visual) only
Bit depth8-bit for display
TaskableNo, updated on a refresh cycle
Cloud coverRemoved in processing
Primary useNavigation, GIS base layer, urban planning context


Satellite Imagery vs Satellite Maps: Full Comparison

FeatureSatellite ImagerySatellite Maps (DOM / Basemaps)
FormIndividual scenesStitched, seamless mosaics
TimingSpecific date and timeComposite of best available images
ProcessingRaw to semi-processedFully processed and colour-balanced
Spectral depthMultispectral, hyperspectral, SARRGB visual optimised
Bit depth8-bit to 16-bit8-bit
TaskableYesNo
Cloud coverMay be presentRemoved
GIS alignmentVaries by processing levelPixel-perfect, orthorectified
XRTech accuracyVaries by satellite and level8m CE90 standard for DOM
Primary useDetection, analysis, change trackingNavigation, planning, GIS base layer
ExampleFlood extent mapping after a stormUrban planning base layer for a zoning report


Are Google Maps and Google Earth Satellite Maps or Imagery?

An image of Aerial View of Denver International Airport in google earth

Google Maps and Google Earth both use satellite maps, not raw satellite imagery.

What you see in Google Maps is a processed, stitched mosaic. Clouds are removed. Colour is balanced. Scenes from different capture dates are combined to show the best available view of each area. Road names, business locations, and boundaries are overlaid as vector layers on top of the imagery.

This makes it excellent for navigation and general reference. It is not suitable for change detection, scientific analysis, or any workflow that requires knowing when and under what conditions a specific area was captured.

Google Earth adds a historical imagery feature that lets you browse older captures of the same area. This is closer to raw imagery in concept, though the data is still processed for visual display rather than scientific analysis.

For scientific analysis, infrastructure inspection, or monitoring specific events, you need actual satellite imagery from a provider like XRTech, not a consumer mapping platform.


The Map Is Not the Territory

This is an old idea in cartography that applies directly here. A satellite map represents the Earth as a useful, readable layer. To do that, it removes information. Cloud cover, seasonal colour variation, scene boundaries, and temporal specificity are all filtered out to make the map visually consistent.

That process is valuable when you need a clean base layer. It is a problem when you need to know what was on the ground at a specific moment. Removing cloud cover means removing the record of what conditions were like when that cloud was there. Colour balancing means the spectral precision needed for NDVI calculation or mineral identification is lost.

Raw imagery preserves everything the sensor recorded at the moment of capture. That completeness is what makes it analytically powerful and why it is the data source for remote sensing, scientific research, and real-time monitoring.


Which One Do You Need?

Choose Satellite Imagery When:

  • You need to detect a specific event: flood extent, oil spill, fire perimeter, construction progress
  • Your project requires spectral data beyond RGB: vegetation health, mineral mapping, soil moisture
  • You need data from a specific date or within a defined time window
  • You are doing scientific analysis that requires 16-bit radiometric data and TOA correction
  • You need SAR data to capture through cloud cover or at night
  • You are comparing before and after conditions to measure change

Choose a Satellite Map When:

  • You need a clean, seamless background layer for a GIS project, urban planning report, or site selection display
  • Your project requires pixel-perfect alignment with existing vector data and GIS layers
  • You are building a digital twin or realistic base reference for a region
  • Navigation, zoning context, or spatial reference is the goal rather than temporal analysis
  • Visual consistency across a large area matters more than spectral depth or temporal precision


XRTech Products by Type

ProductTypeUse CaseAccuracy
SuperView Neo-1 0.3m monoSatellite imageryInfrastructure inspection, vehicle detection2m to 4m CE90
SuperView-2 8-bandSatellite imageryPrecision agriculture, vegetation stress10m CE90
GF-3 SARSatellite imageryFlood mapping, all-weather monitoring5m to 10m CE90
Wyvern hyperspectralSatellite imageryMineral mapping, pollution detectionScientific grade
Digital Orthophoto Map (DOM)Satellite mapGIS base layer, urban planning, infrastructure mapping8m CE90
3D City ModelDerived from imageryDigital twin, smart city zoningSub-metre building height accuracy


Order Satellite Imagery or Satellite Maps From XRTech

XRTech provides both raw and processed satellite products. Archive imagery starts at $1/km2. DOM basemap products are delivered at 8m CE90 for any location on Earth. New tasking starts at $8/km2 for fresh capture on a specific date. Buy satellite imagery at best price!

Contact XRTech with your AOI and project requirement and we will confirm whether imagery or a processed map product is the right choice for your workflow, and deliver a free sample tile within 24 hours.


FAQs

What is the difference between satellite imagery and satellite maps?

Satellite imagery is a raw or semi-processed snapshot of the Earth captured at a specific date and time. A satellite map is a stitched, colour-balanced, orthorectified composite of multiple images designed as a seamless reference layer. Imagery is used for analysis and detection. Maps are used for navigation and GIS context.

Is Google Maps satellite imagery or a satellite map?

Google Maps is a satellite map. It shows a processed, stitched mosaic with clouds removed, colour balanced across scenes, and vector overlays including roads, labels, and business locations added on top. It is not raw imagery and is not suitable for scientific analysis or precise change detection.

Can satellite imagery be used as a map?

Yes, after orthorectification and georeferencing, satellite imagery can serve as a map base layer. XRTech DOM products are processed from imagery to produce map-ready layers at 8m CE90. The difference is that the processing removes temporal specificity and spectral depth in favour of visual consistency and positional accuracy.

What is a Digital Orthophoto Map (DOM)?

A DOM is an orthorectified, georeferenced satellite image mosaic. It is produced by correcting raw imagery for terrain distortion and camera angle using a Digital Elevation Model, then mosaicking multiple scenes into a seamless layer. XRTech DOMs are delivered at 8m CE90 and are map-ready for GIS and CAD integration.

Why does satellite imagery sometimes have clouds but satellite maps do not?

Satellite imagery records the ground as it was at the moment of capture. If clouds were present, they appear in the image. Satellite maps are processed composites built from multiple captures. Cloud-contaminated pixels are replaced with clear data from different dates, creating a cloud-free visual layer. This process removes the temporal specificity that makes raw imagery useful for event detection.

Can I task a satellite to capture fresh imagery for my project?

Yes. XRTech new tasking directs a satellite to capture your specific AOI on a future date with your specified parameters including cloud cover limits and off-nadir angle. New tasking starts at $8/km2. Satellite maps cannot be tasked as they are updated on a standard refresh cycle.

What spectral data is available in satellite imagery vs satellite maps?

Satellite imagery can include panchromatic, multispectral, hyperspectral, and SAR data across 4 to 330 spectral bands depending on the sensor. Satellite maps are typically optimized for RGB visual display and do not preserve spectral depth. If you need NDVI, mineral mapping, or SAR analysis, you need raw or semi-processed imagery, not a map product.

What bit depth does satellite imagery support?

Raw and semi-processed satellite imagery is available at 8-bit (256 levels), 11-bit (2,048 levels), and 16-bit (65,536 levels). Satellite maps are typically delivered in 8-bit for visual display. For scientific modelling, Top of Atmosphere correction, or precise radiometric analysis, 16-bit imagery is required.

Which is more accurate: satellite imagery or satellite maps?

For positional accuracy, satellite maps (DOMs) are more reliable because they are fully orthorectified and georeferenced. XRTech DOMs deliver 8m CE90. Raw imagery accuracy varies by processing level, from 20m to 50m CE90 for Level 2A to 5m to 8m CE90 for orthorectified Level 3 products. For spectral and temporal accuracy, raw imagery is superior because the map processing removes that information.

When should I choose satellite imagery over a satellite map?

Choose imagery when the moment of capture matters: flood monitoring, construction progress, oil spill detection, crop health assessment, before and after event comparison, or any scientific analysis requiring spectral depth or precise radiometric values. Choose a satellite map when you need a clean, consistent visual reference layer for planning, navigation, or GIS base mapping.


Blog Summary

  1. Satellite imagery is a raw or semi-processed scene captured at a specific date and time, used for detection, analysis, and change tracking
  2. Satellite maps (basemaps, mosaics, DOMs) are stitched composites of multiple images, corrected and colour-balanced for visual consistency
  3. Imagery can be tasked for a specific date, angle, and cloud cover requirement; maps are updated on a regular refresh cycle
  4. Imagery supports multispectral, hyperspectral, and SAR data for scientific analysis; maps are typically optimised for RGB visual clarity
  5. Satellite maps are orthorectified and georeferenced to align pixel-perfectly with GIS coordinates; raw imagery may still have terrain and angle distortions
  6. XRTech Digital Orthophoto Maps (DOM) deliver a consistent 8m CE90 horizontal accuracy across the full mosaic
  7. Imagery bit depth runs to 11-bit or 16-bit for scientific modelling; maps are usually delivered in 8-bit for visual display
  8. Google Maps and Apple Maps are satellite maps: they show processed, annotated composites, not raw imagery
  9. For detecting an oil spill, tracking flood extent, or monitoring construction, you need imagery, not a map
  10. For a GIS base layer, urban zoning report, or digital twin, you need a satellite map, not raw imagery

Related Posts

Request Product Details

Satellite Imagery Advisor

Brief questions. Practical guidance. Get an indicative estimate instantly, and we only proceed to a formal quote once the basics are clear.

Advisor mode: this form will recommend the lowest resolution and type that fits your objective so you do not overpay.
Step 1 — Area & Location
1 / 4
Start simple: Upload a KML/KMZ/ZIP if you have it. If not, a bounding box or center plus dimensions works fine. We will calculate area for you where possible.
Upload AOI file (KML / KMZ / ZIP) — recommended
Preferred: a single polygon AOI. We compute the area automatically.
Enter corner coordinates (bounding box)
Use min/max latitude and longitude.
Enter center coordinate + width & height
Good for quick feasibility when exact boundaries are not available.
Describe location (city / region / site name)
We will follow up to confirm an AOI boundary if needed.
Advisor note: If speed is the priority, we usually check archive first. If you need a specific date window or fresh capture, choose new tasking.
Archive imagery
Previously captured imagery, typically faster delivery.
New capture (tasking)
Satellite is tasked for your AOI; weather and availability can affect capture date.
Not sure, advise me
We will recommend the most feasible option based on area, timing, and objective.
Minimum order guidance
Archive imagery: typically 15 to 25 km²
New capture: typically 50 to 100 km²
Feasibility depends on satellite, location, and timing.
Pick a date window. We will advise what is realistic for your area and cloud conditions.
Resolution guidance: Higher resolution increases detail and cost. We will recommend the lowest resolution that meets your objective.
I know what I need
Select 30cm, 50cm, 75cm, or 1m.
Advise me based on my objective
Answer a quick question about what you need to see.
Almost done. You will see an indicative estimate. If you agree, we will run feasibility and send a formal quote.
I understand this is an indicative estimate and request feasibility and a formal quote.
We handle requests confidentially. No data is shared with third parties.
Protected by spam filter and bot detection. Genuine enquiries only.
Live Summary
Updates as you answer
Area (km²)
AOI method
Coordinates / Location
Imagery type
Date range
Resolution

Indicative Estimate

Based on XRTech published pricing. Final price confirmed after feasibility check.
Complete Steps 1 to 3 to see an estimate.
Once you submit, XRTech will:
  • Archive: run a coverage check in your date range
  • Tasking: confirm window and issue order form or invoice

Quote Request Sent

Your satellite imagery request has been sent to admin@xrtechgroup.com. XRTech will review feasibility and send a formal quote within 24 hours. A free sample tile for your AOI is included in the quote response.