
See Beyond Visible Light with Multispectral Satellite Imagery
Multispectral Satellite Imagery
XRTech Group delivers multispectral imaging data across up to 8 spectral bands at resolutions as fine as 1.2 m. From crop stress detection to mineral exploration, our constellation of 130+ satellites captures what the human eye cannot.
True Color and Beyond
Capture accurate spectral information to see the world in more than meets the eye.
1.2-50 m MS
Spatial resolution
4 to 8 Bands
Blue, Green, Red, Yellow
Up to 830 km
Swath Width
12-bit
Radiometric Depth
Global Tasking
Fast Revisit Option
What Multispectral Imagery Reveals That Standard Imaging Cannot
Standard satellite imagery captures what the eye sees. Multispectral imaging captures what the eye misses biological, chemical, and physical properties of the land surface encoded in invisible wavelengths.
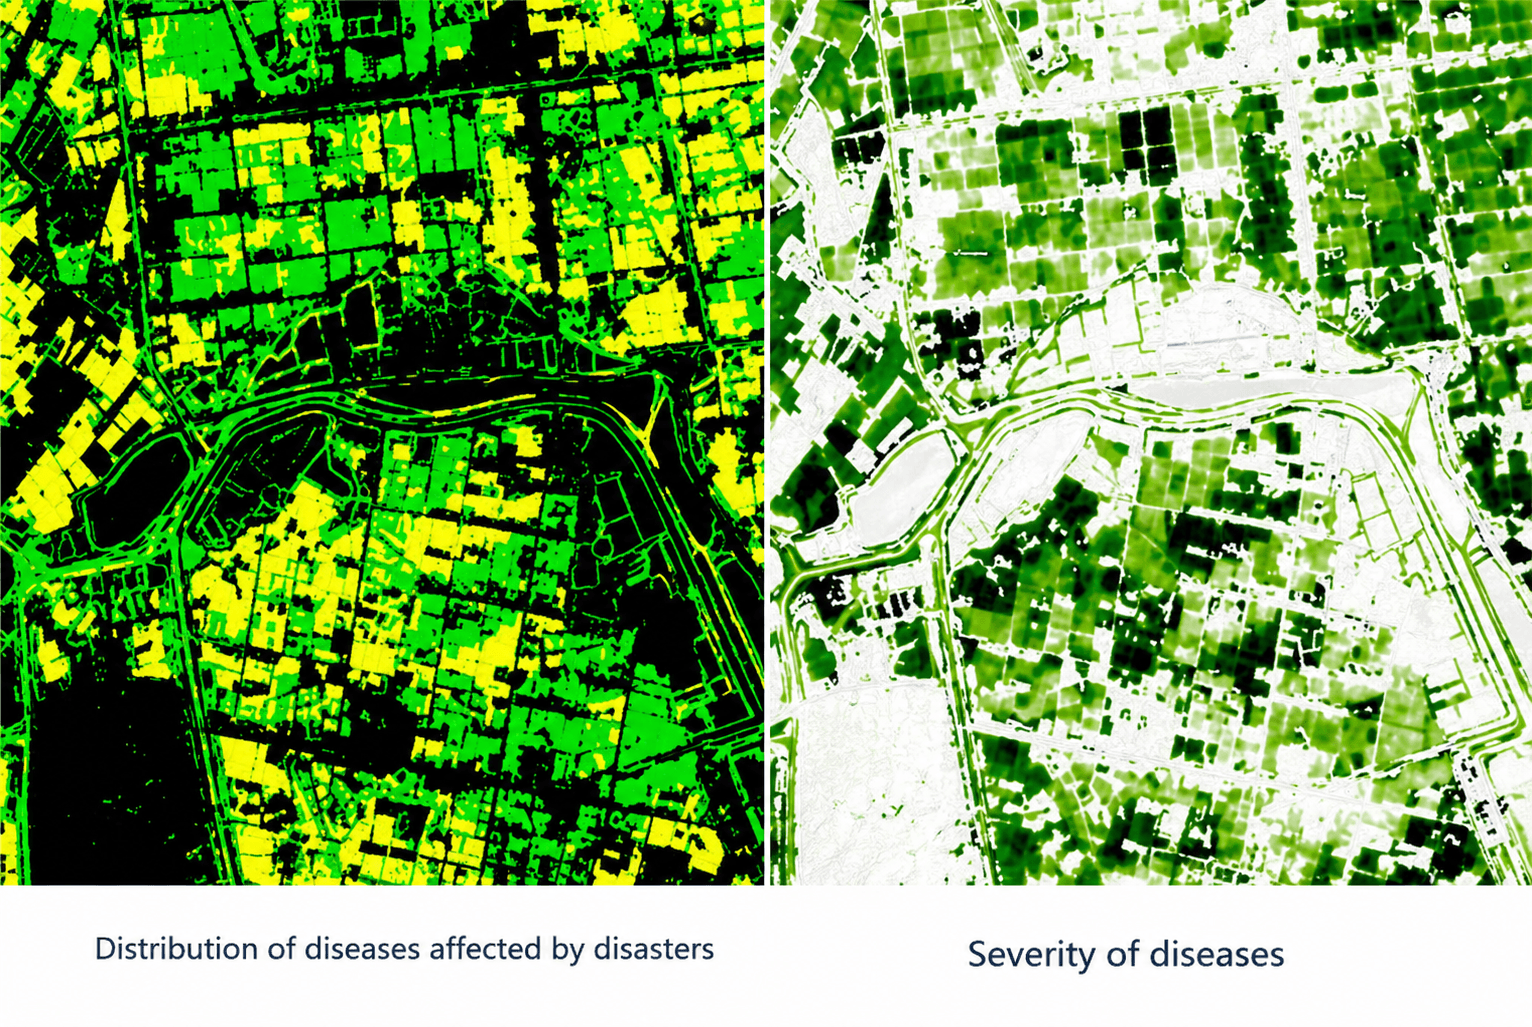
Vegetation Health Before Visible Stress
NIR and Red Edge bands detect chlorophyll changes and leaf structure deterioration 7 to 10 days before symptoms appear on the surface. Drought stress, disease & nutrient deficiency are all readable from space.
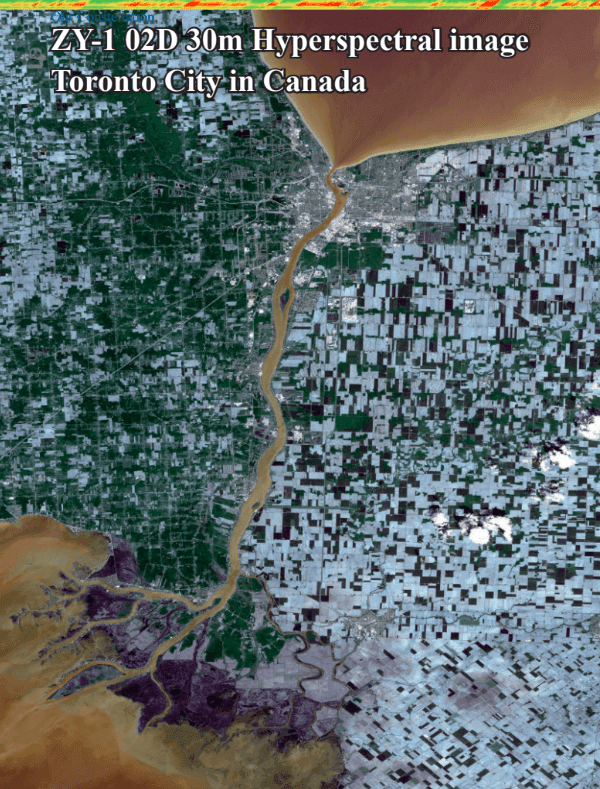
Mineral and Material Identification
SWIR and extended spectral bands identify the chemical fingerprints of soil types and mineral deposits including gold, copper, and lithium without a single ground survey crew.
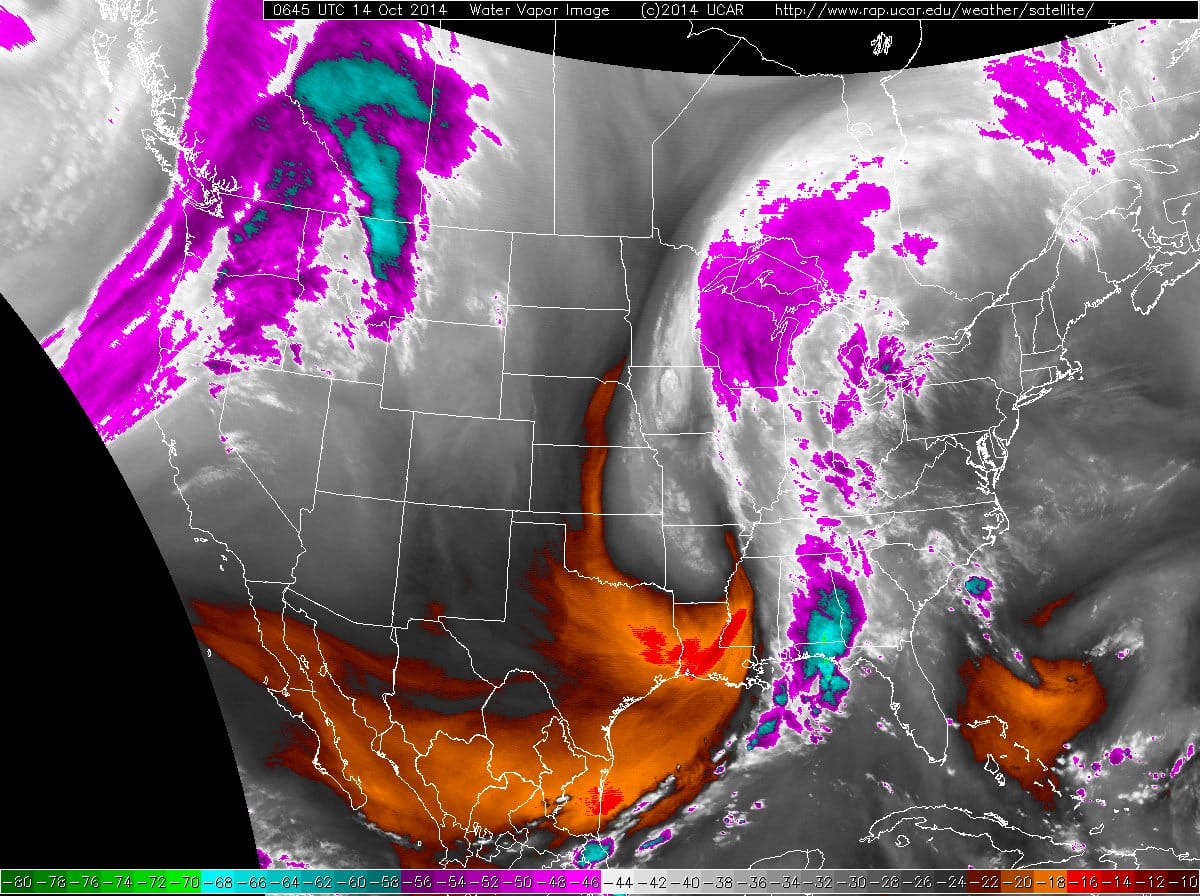
Water Quality and Moisture Mapping
Green and NIR bands track chlorophyll concentration, suspended solids, turbidity, and pollution sources in rivers, reservoirs, and coastal water bodies across vast areas.
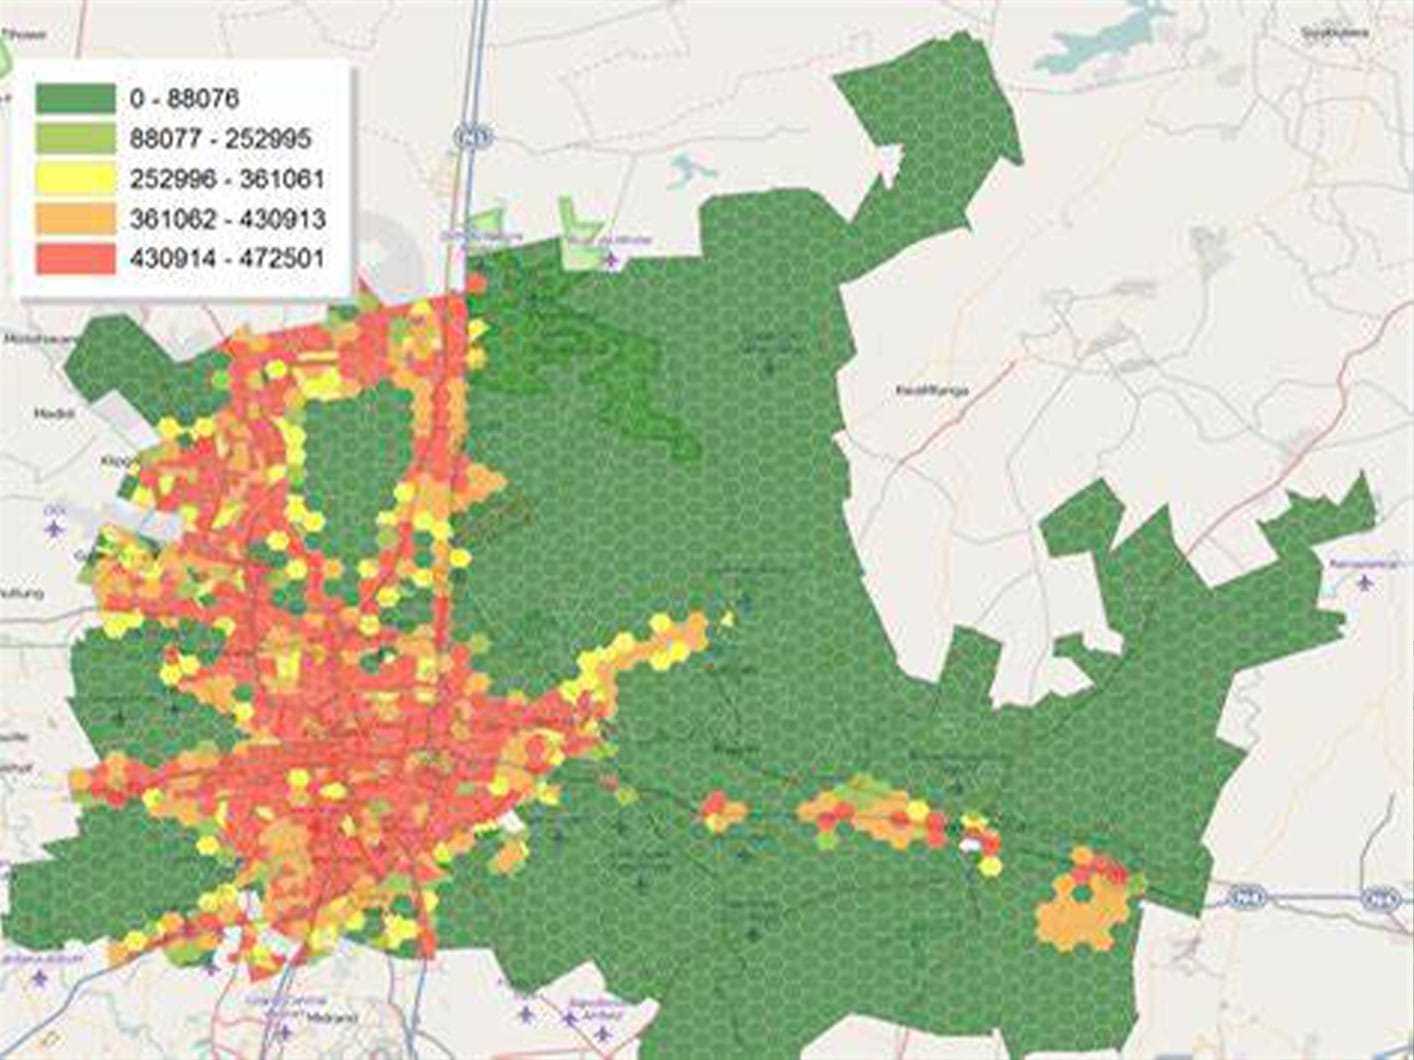
Land Use & Change Detection
Multispectral data distinguishes between soil types, vegetation classes, impervious surfaces, and built structures enabling automated change detection for illegal construction, deforestation & urban growth.
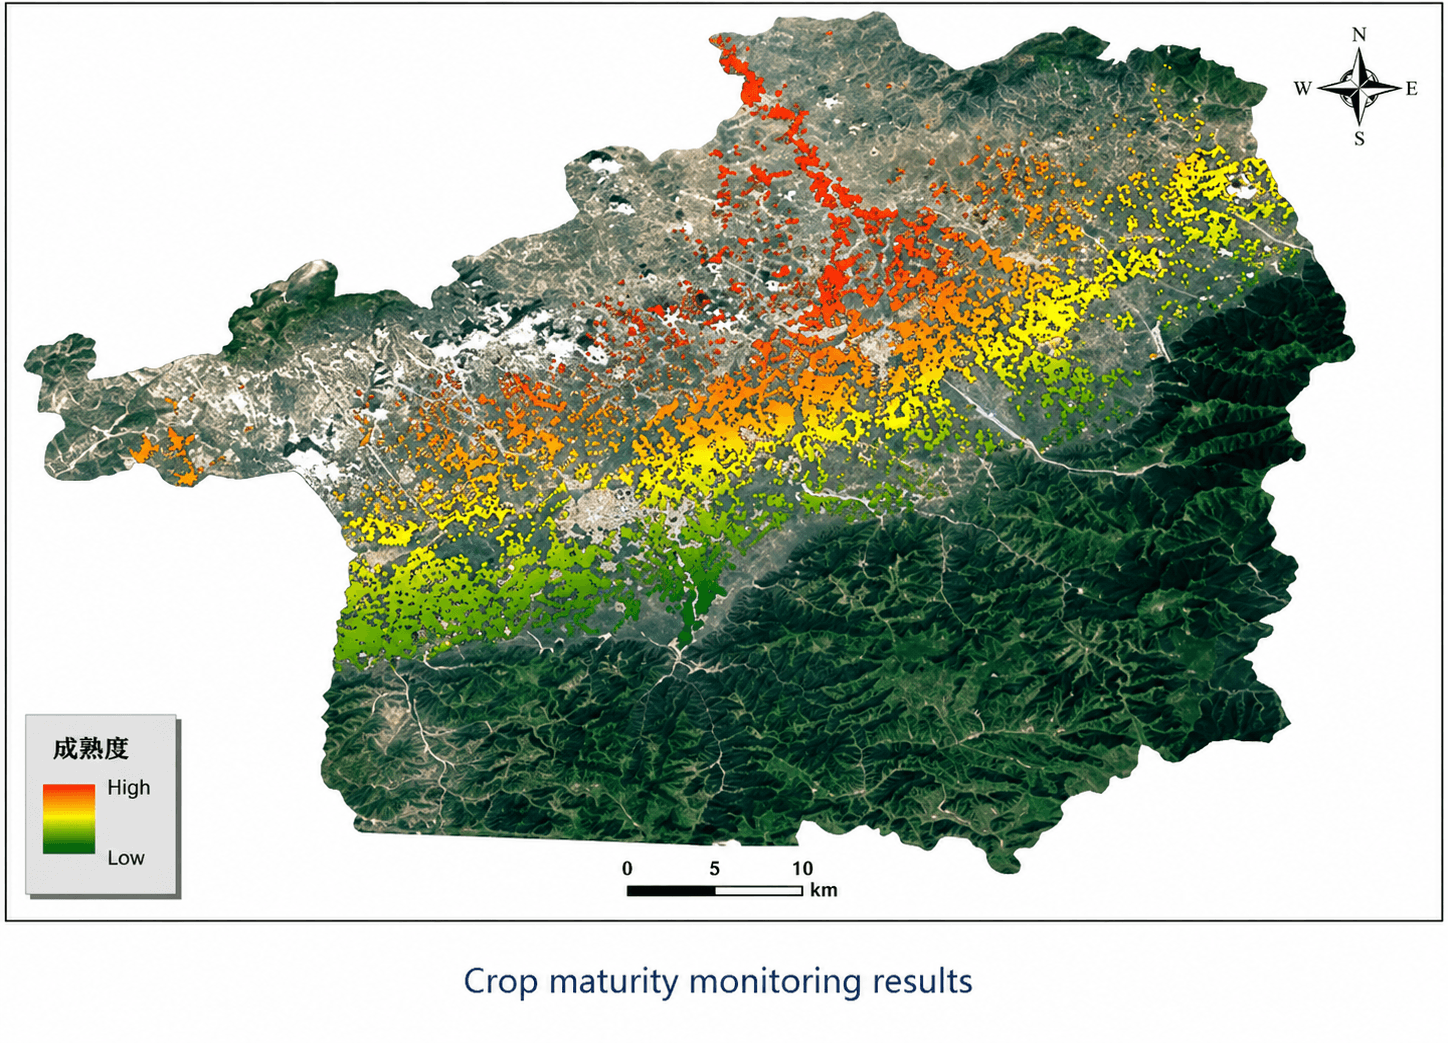
Quantitative Index Analysis
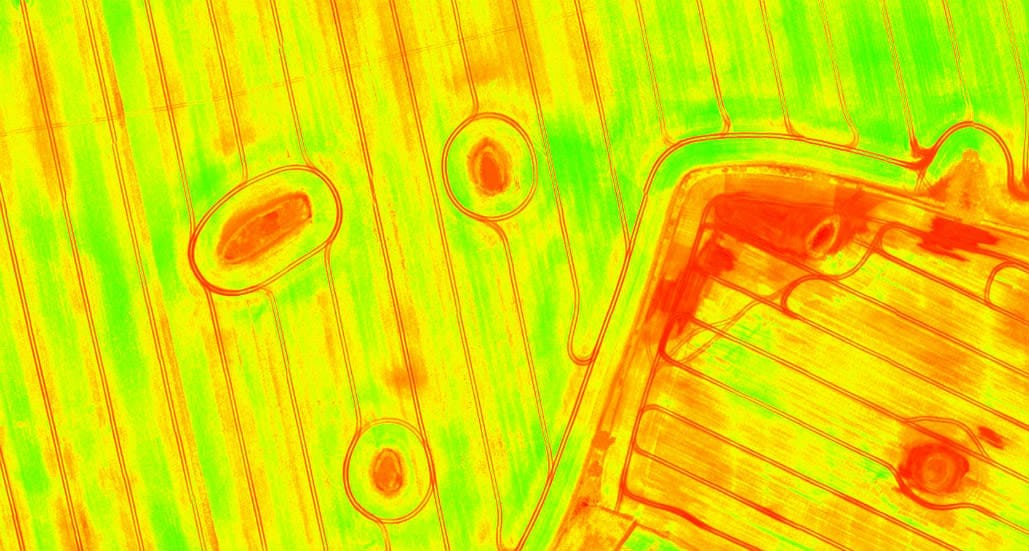
Spectral bands feed mathematical vegetation indices including NDVI, EVI, NDRE, SAVI, GNDVI, and LAI each providing a precise, repeatable metric for crop health, biomass, and canopy density.
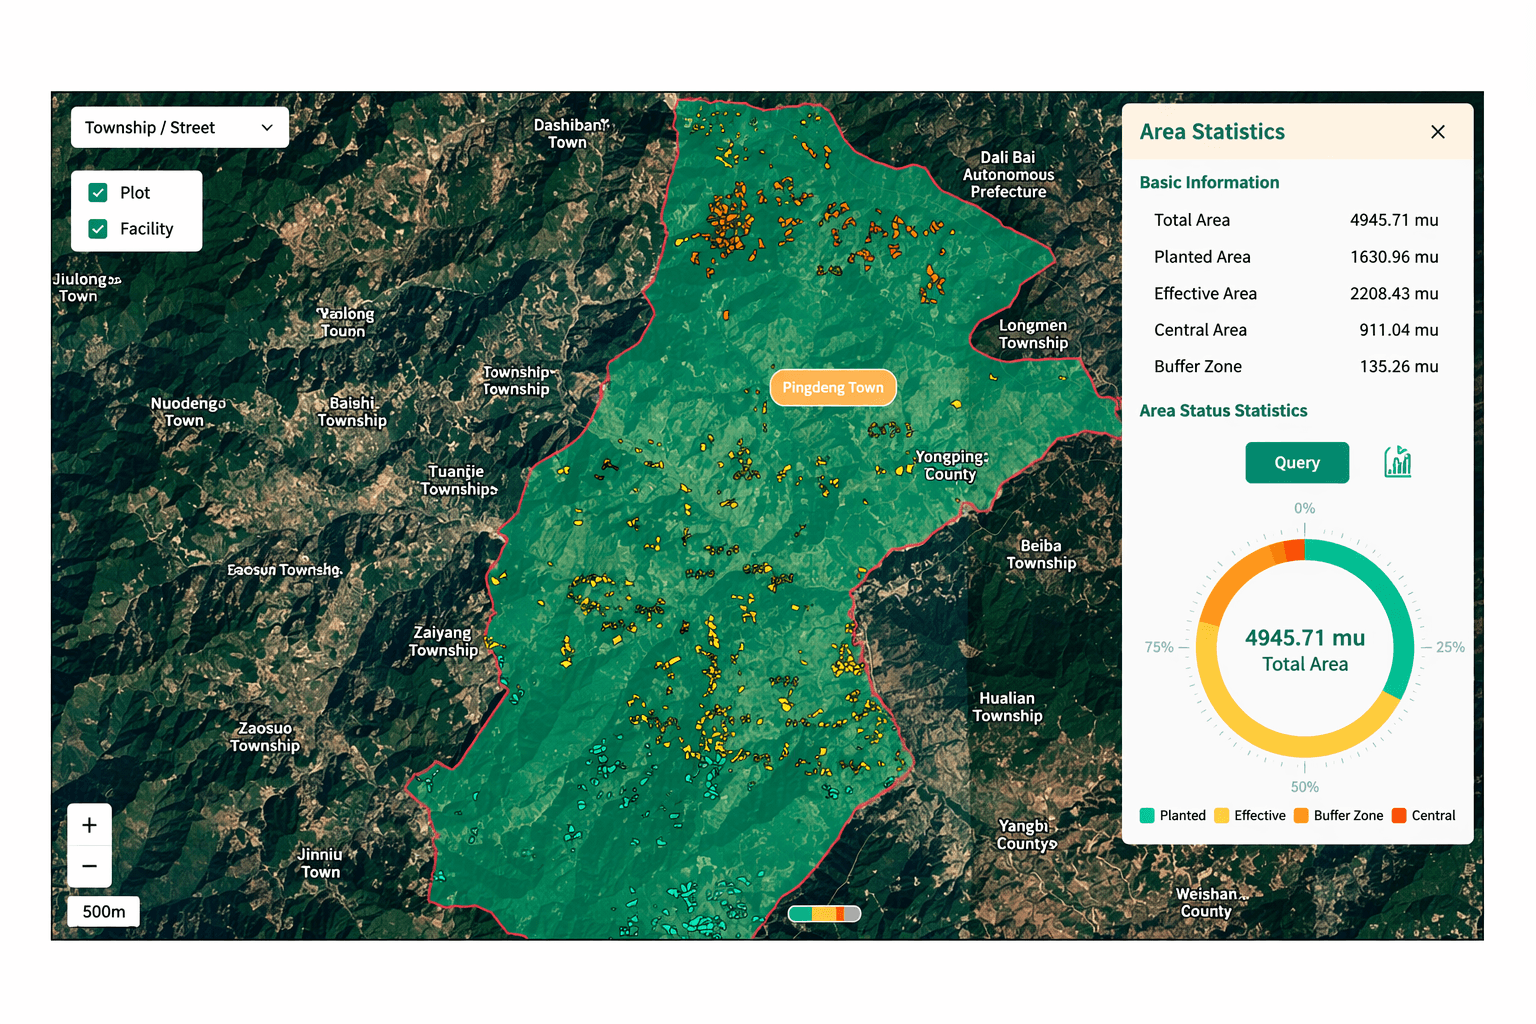
Regulatory Compliance
Multi-temporal multispectral archives dating back to 1999 provide verifiable, court-admissible evidence for environmental audits, land restoration tracking, and illegal activity documentation.
Transparent Pricing
Multispectral Imagery Pricing
Volume-based pricing with no hidden costs. All orders include radiometrically corrected, ortho-ready data in GeoTIFF, IMG, SHP, and DWG formats.
Archive — High Res
(51–80 cm)
$5
- Imagery older than 90 days
- Min. order: 25 km²
- Delivery via secure cloud link
- GeoTIFF, IMG, SHP, DWG
Archive — Very High
Res (31–50 cm)
$13
- Archive imagery at VHR
- Min. order: 25 km²
- Cloud link or HDD delivery
- Ortho-ready formats
Archive — Super High
Res (30 cm)
$20
- 0.3 m archive imagery
- Min. order: 25 km²
- 1.5-hour response for urgent requests
New Tasking — Standard
(30 cm)
$30
- New satellite collection
- Min. order: 100 km²
- Standard delivery timeline
- Cloud command upload in 3 hours
Priority / Emergency Tasking
–
$37–80
- Fastest available turnaround
- 1-hour urgent data delivery
- 50 TB daily processing capacity
- Crisis response priority queue
Multispectral Imaging Satellites Sensors and Technical Specifications
XRTech Group’s 130+ satellite constellation provides tiered resolution options from ultra-high detail to wide-area regional coverage, all with daily revisit capability.
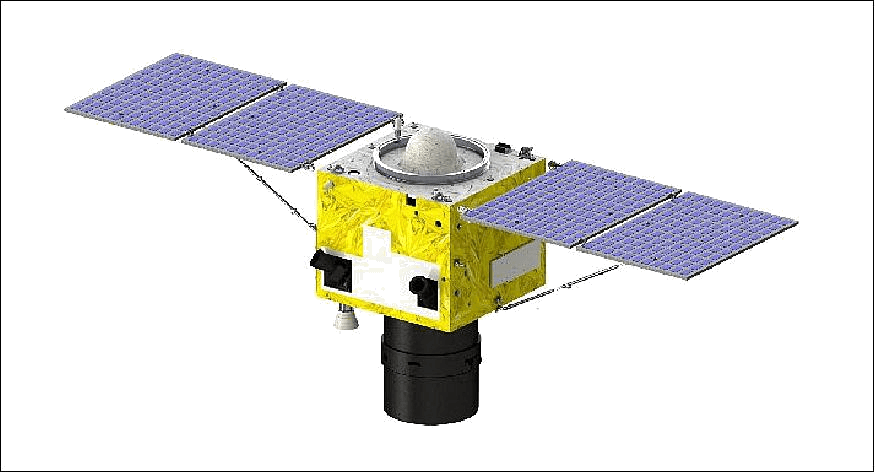
SuperView Neo-1
MS Resolution
1.2 m
Revisit
Daily global
Spectral Bands
PAN + Blue, Green, Red, NIR
Swath Width
12 km
Geolocation
5 m CE90
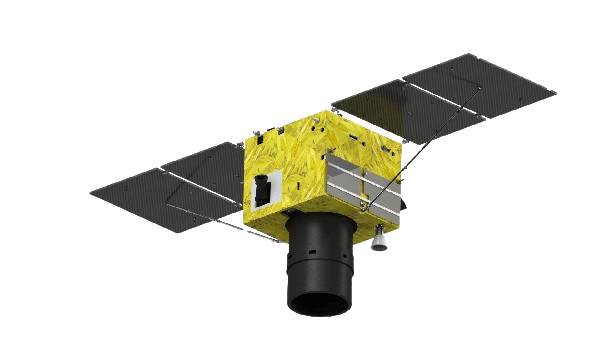
SuperView-2
MS Resolution
1.68 m
Revisit
Daily global
Spectral Bands
PAN + Purple, Blue, Green, Yellow, Red, Red Edge, NIR1, NIR2
Swath Width
15.1 km
Geolocation
10 m CE90
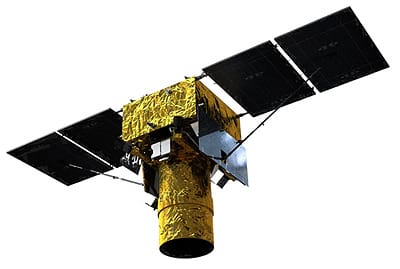
SuperView-1
MS Resolution
2 m
Revisit
Daily global
Spectral Bands
PAN + Blue, Green, Red, NIR
Swath Width
12 km
Geolocation
5–8 m CE90
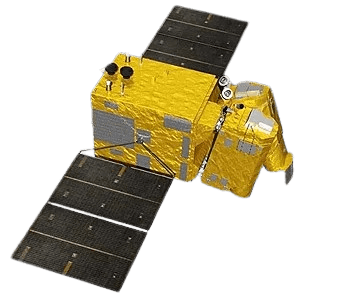
GF-7
MS Resolution
2.6 m
Revisit
1–2 days
Spectral Bands
PAN + Blue, Green, Red, NIR
Swath Width
20 km
Geolocation
8 m CE90

GF-2
MS Resolution
3.24 m
Revisit
4–5 days
Spectral Bands
PAN + Blue, Green, Red, NIR
Swath Width
20 km
Geolocation
8 m CE90
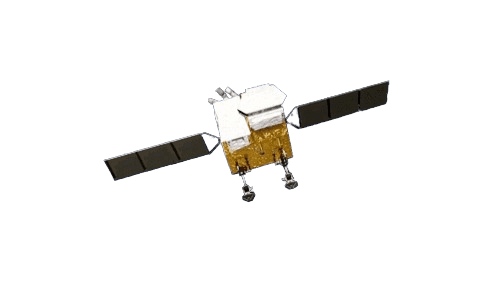
GF-6
MS Resolution
8 m
Revisit
4–5 days
Spectral Bands
PAN + Blue, Green, Red, NIR + Red Edge (690–770 nm)
Swath Width
90 km
Geolocation
8 m CE90
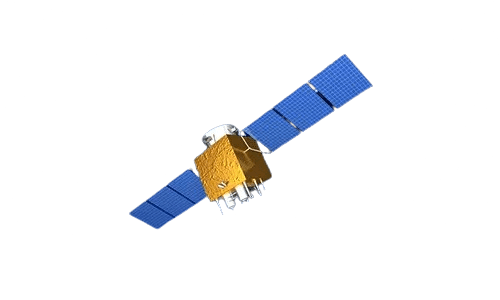
GF-1 (WFI)
MS Resolution
8 m
Revisit
Daily
Spectral Bands
PAN + Blue, Green, Red, NIR
Swath Width
830 km
Geolocation
-
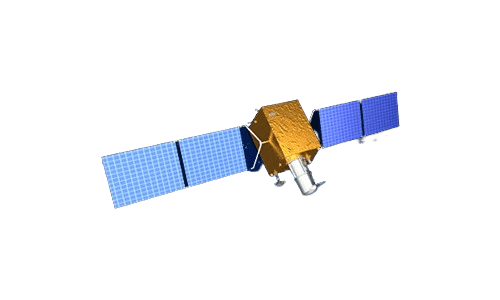
GF-4
MS Resolution
50 m VNIR
Revisit
20-second (GEO)
Spectral Bands
VNIR multispectral
Swath Width
400 km
Geolocation
-
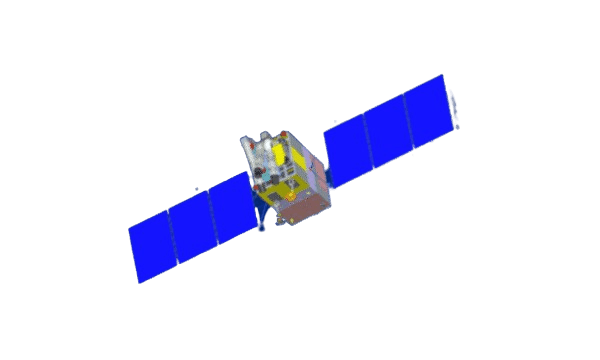
ZY-3
MS Resolution
5.8 m
Revisit
5 days
Spectral Bands
PAN + Blue, Green, Red, NIR
Swath Width
51 km
Geolocation
8 m CE90
Transparent Pricing
Processing Levels and Deliverables
Every multispectral image from us is delivered in a processing level that matches your workflow, from raw geometric data to fully corrected, analysis-ready imagery.
LI Basic
Mono imagery with radiometric and basic geometric correction. Delivered in GeoTIFF with TOA 16-bit depth and ISO metadata. Starting point for custom processing pipelines.
- Geocorrected
- TOA 16-bit and Visual 8-bit outputs
- WGS84 / UTM / custom projection
- ISO and STAC metadata included
- GeoTIFF, IMG, SHP, DWG formats
LI Ortho Ready
Atmospherically corrected, ortho-ready imagery with RPC files included for further geometric processing. Delivered with cloud, haze, and shadow masking applied.
- Atmospheric correction applied
- Cloud and shadow masking
- RPC files for geometric refinement
- Terrain illumination normalized
- Ready for GIS and analysis platforms
LI Ortho (DOM)
Digital Orthophoto Maps fully orthorectified for terrain distortion and camera angles. Pixel-perfect horizontal positioning with 8 m CE90 geolocation accuracy. The standard for engineering and urban applications.
- 8 m CE90 geolocation precision
- Orthorectified for terrain distortion
- Pan-sharpened color available
- Block adjustment and color correction
- Delivered via secure cloud or HDD
Multispectral Image Analysis Across Industries
Every sector has a different question. Multispectral remote sensing has the spectral range to answer all of them.
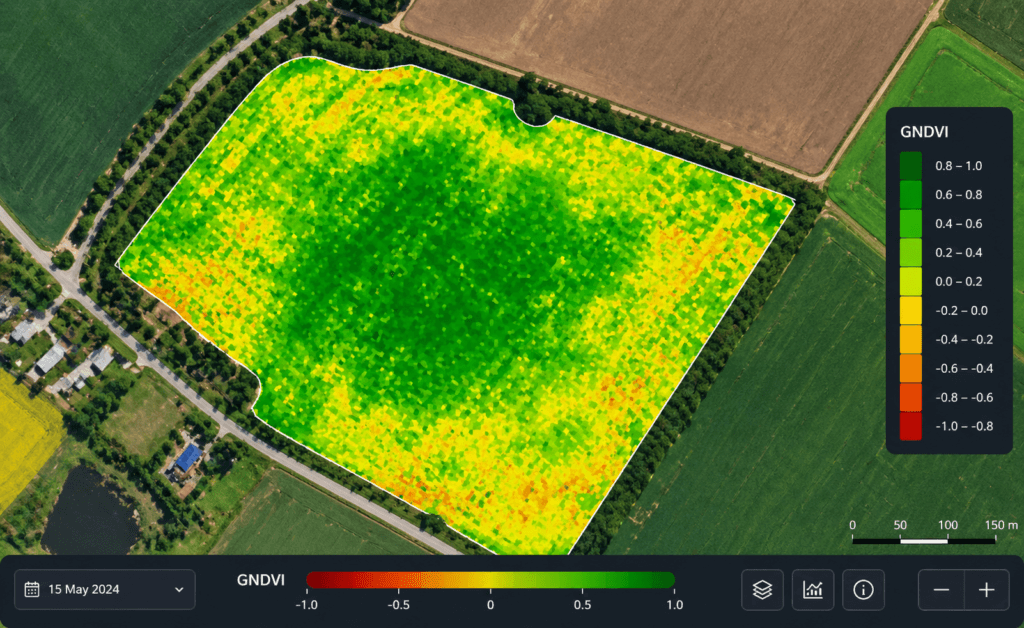
Precision Agriculture
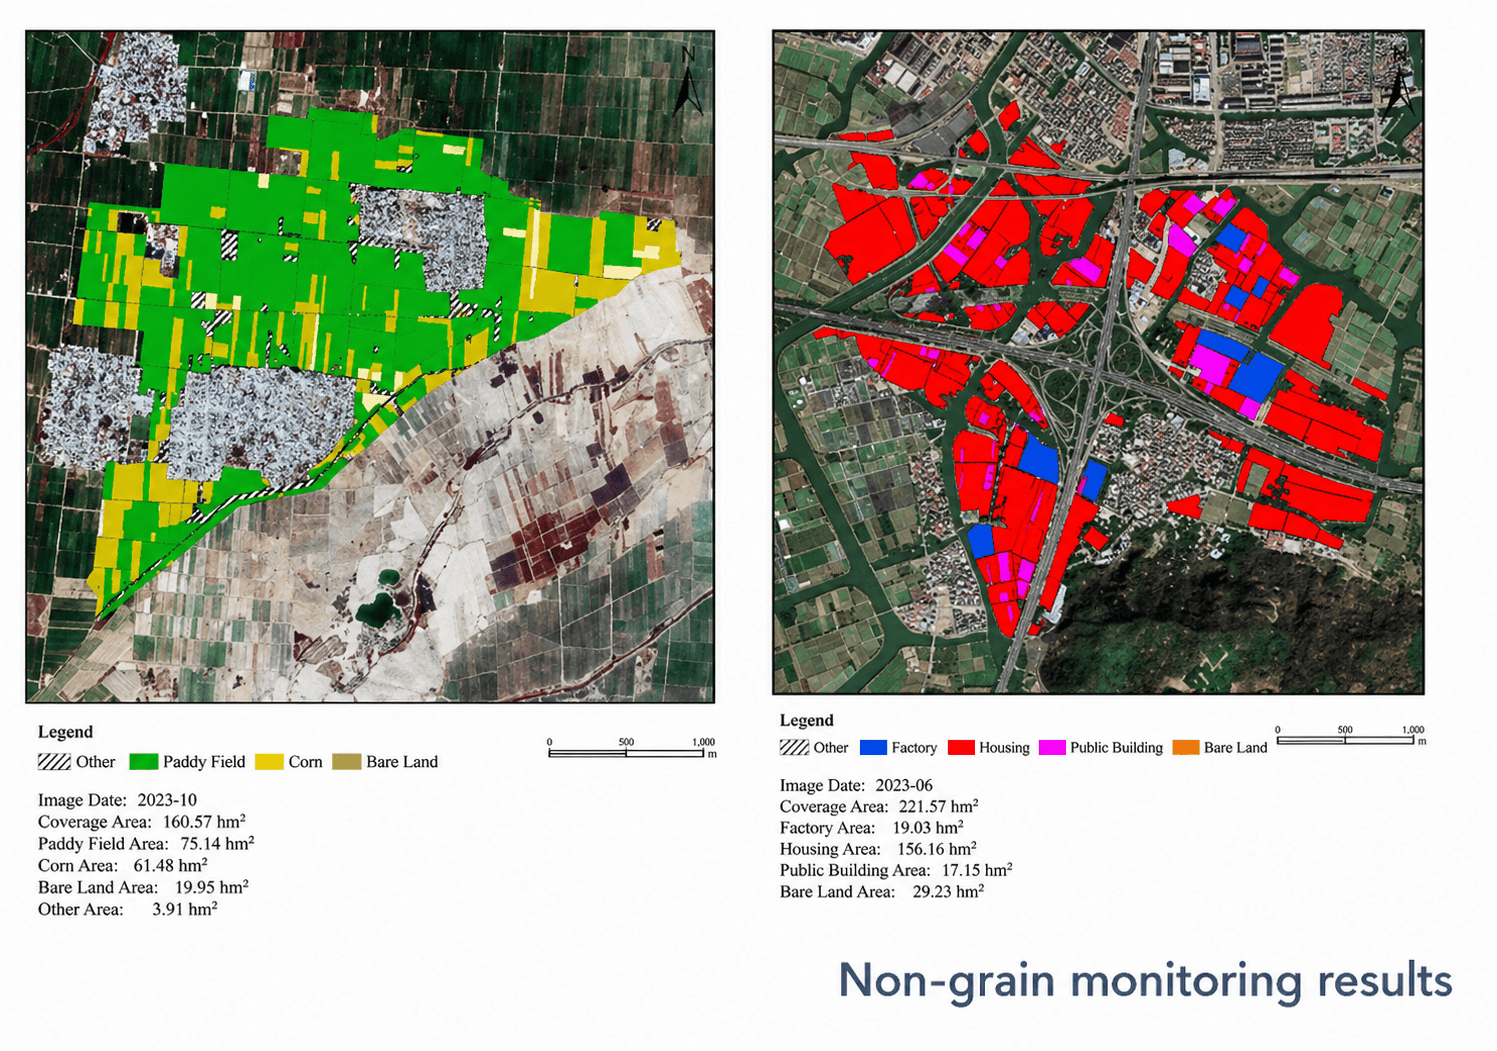
Multi-temporal multispectral imaging tracks every stage of crop development, from soil preparation to harvest. AI-integrated index analysis turns spectral data into actionable farm intelligence.
- Crop yield prediction up to 85% accuracy at county level
- Variable rate seeding and prescription fertilizer maps
- Pest and disease detection with over 90% AI accuracy
- Irrigation alerts from CWSI and NIR moisture analysis
- NDVI, EVI, NDRE, GNDVI, LAI indices from a single pass
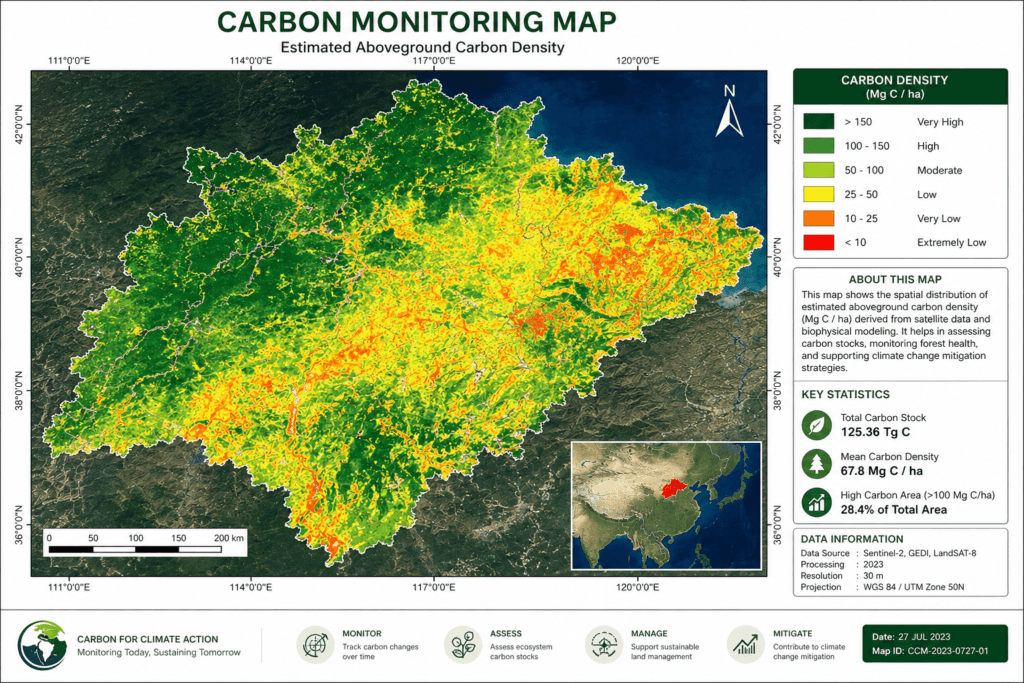
Environmental Monitoring
Real-time multispectral sensing tracks land cover change, water quality, and ecosystem health across areas too large or remote for ground survey teams.
- Deforestation and illegal logging detection near-instantly
- Water quality: chlorophyll, turbidity, pollution in rivers and reservoirs
- Carbon sequestration monitoring from biomass index data
- Wetland and soil moisture mapping across national scales
- Historical archive from 1999 for decades of change detection
Mining and Exploration
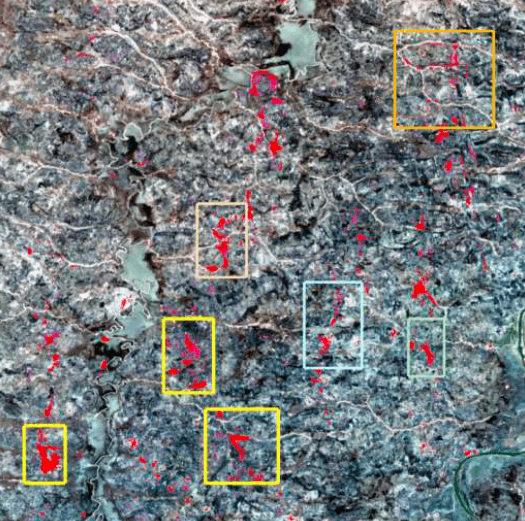
Spectral data from SWIR and extended MS bands identifies mineral chemical signatures and monitors site integrity, replacing expensive ground survey phases with targeted remote analysis.
- Mineral targeting: gold, copper, lithium from spectral fingerprints
- Clay mineral alteration mapping with SWIR bands
- Tailings dam vegetation health as structural stability proxy
- Land reclamation compliance verified against baseline imagery
- Deep learning models flag top exploration priority zones

Urban Planning and Smart Cities
Multispectral imaging distinguishes building materials, vegetation types, impervious surfaces, and land use classes with the accuracy needed for city-scale planning and enforcement.
- Unauthorized construction detection from building footprint analysis
- Urban green cover tracking for sustainability reporting
- Land use classification and zoning compliance monitoring
- Heat island mapping from surface temperature indices
- Digital twin data inputs with ±3 m vertical accuracy
Disaster Response
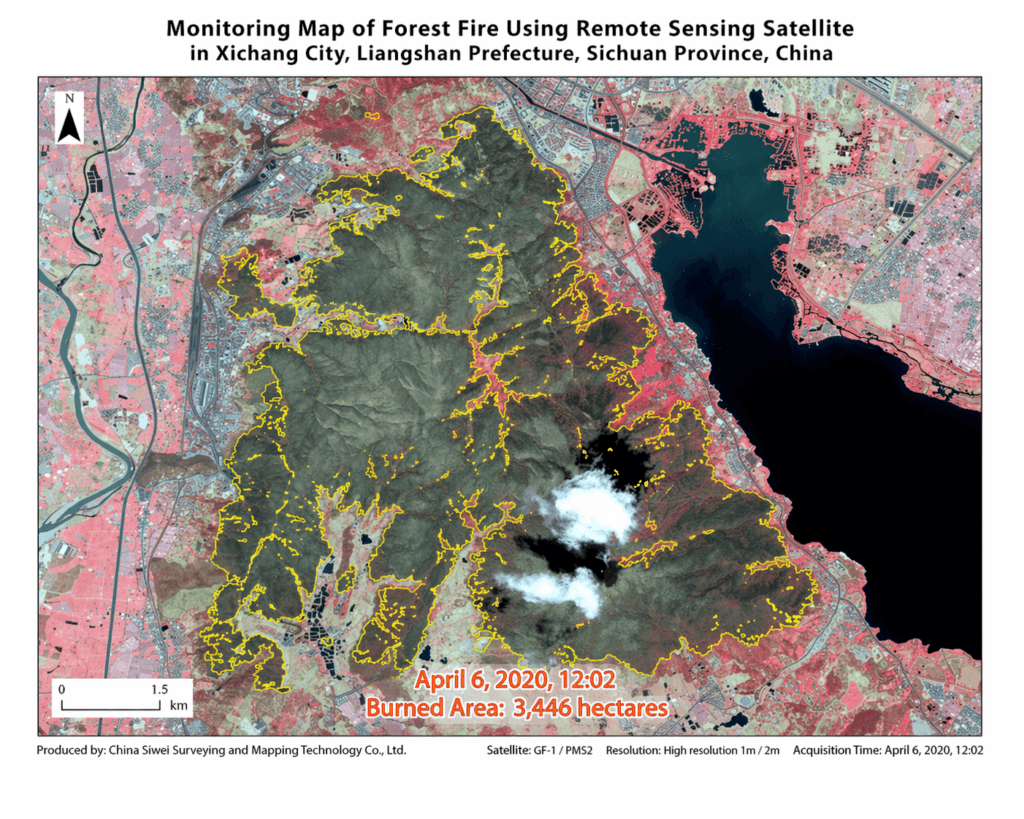
Fast-delivery multispectral imagery supports crisis response from the moment an event occurs. Spectral analysis maps damage extent, waterlines, and recovery progress at scale.
- Flood waterline and inundation mapping within 24 hours
- Fire damage and burn severity classification via NBR index
- Evacuation route accessibility from infrastructure imagery
- Post-disaster vegetation recovery monitoring over months
- 1.5-hour response time for urgent tasking requests
Advanced Multispectral Technology.
Reliable Result.
Our multispectral satellites deliver consistent. high-quality data you can trust.
- High Radiometric & Geometric Accuracy
- Atmospherically Corrected Surface Reflectance
- Cloud Detection & Quality Assurance
- Flexible Tasking & Rapid Delivery
- Ortho-Ready Data in GeoTIFF, IMG, SHP, and DWG formats.
How to Order Multispectral Imagery
From tasking to insights in just a few steps.
Define Your Area
Choose your area of interest.
Task Satellite
We capture Multispectral Imagery on your schedule.
Process & Deliver
Your data is processed and delivered fast.
Analyze & Act
Turn imagery into actionable insights and results.
Mining Exploration — Africa
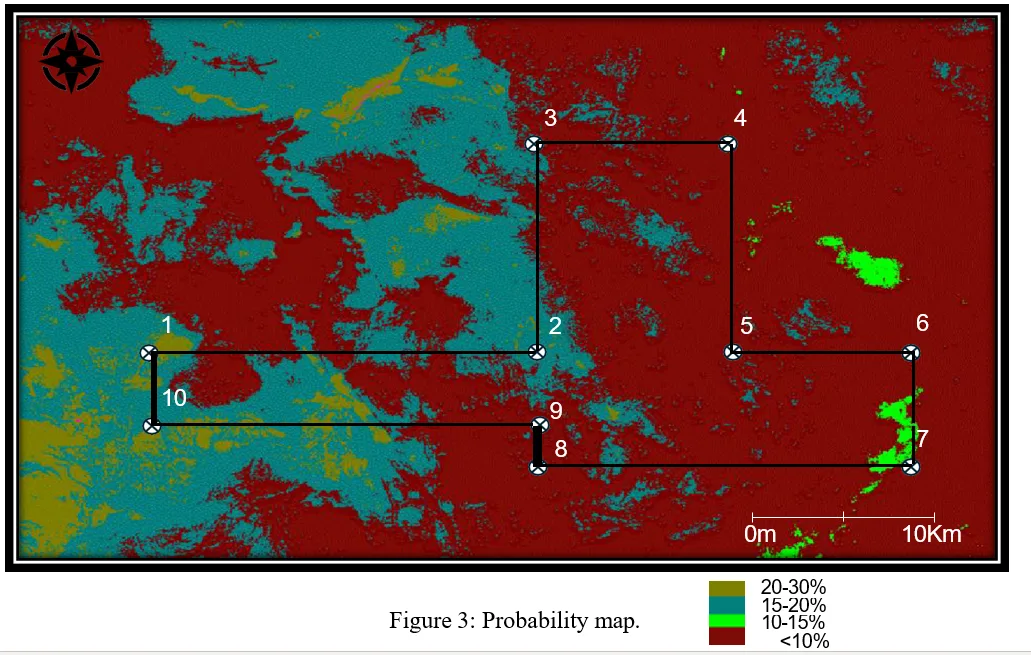
AI-Assisted Gold Probability Mapping
An exploration company used multispectral data fusion across hundreds of square kilometers to map geological indicators of mineralization. XRTech’s deep learning models analyzed SWIR and extended MS bands to identify priority investigation zones.
Most satellite imagery shows you what the eye can already see. Multispectral imaging shows you what it cannot.
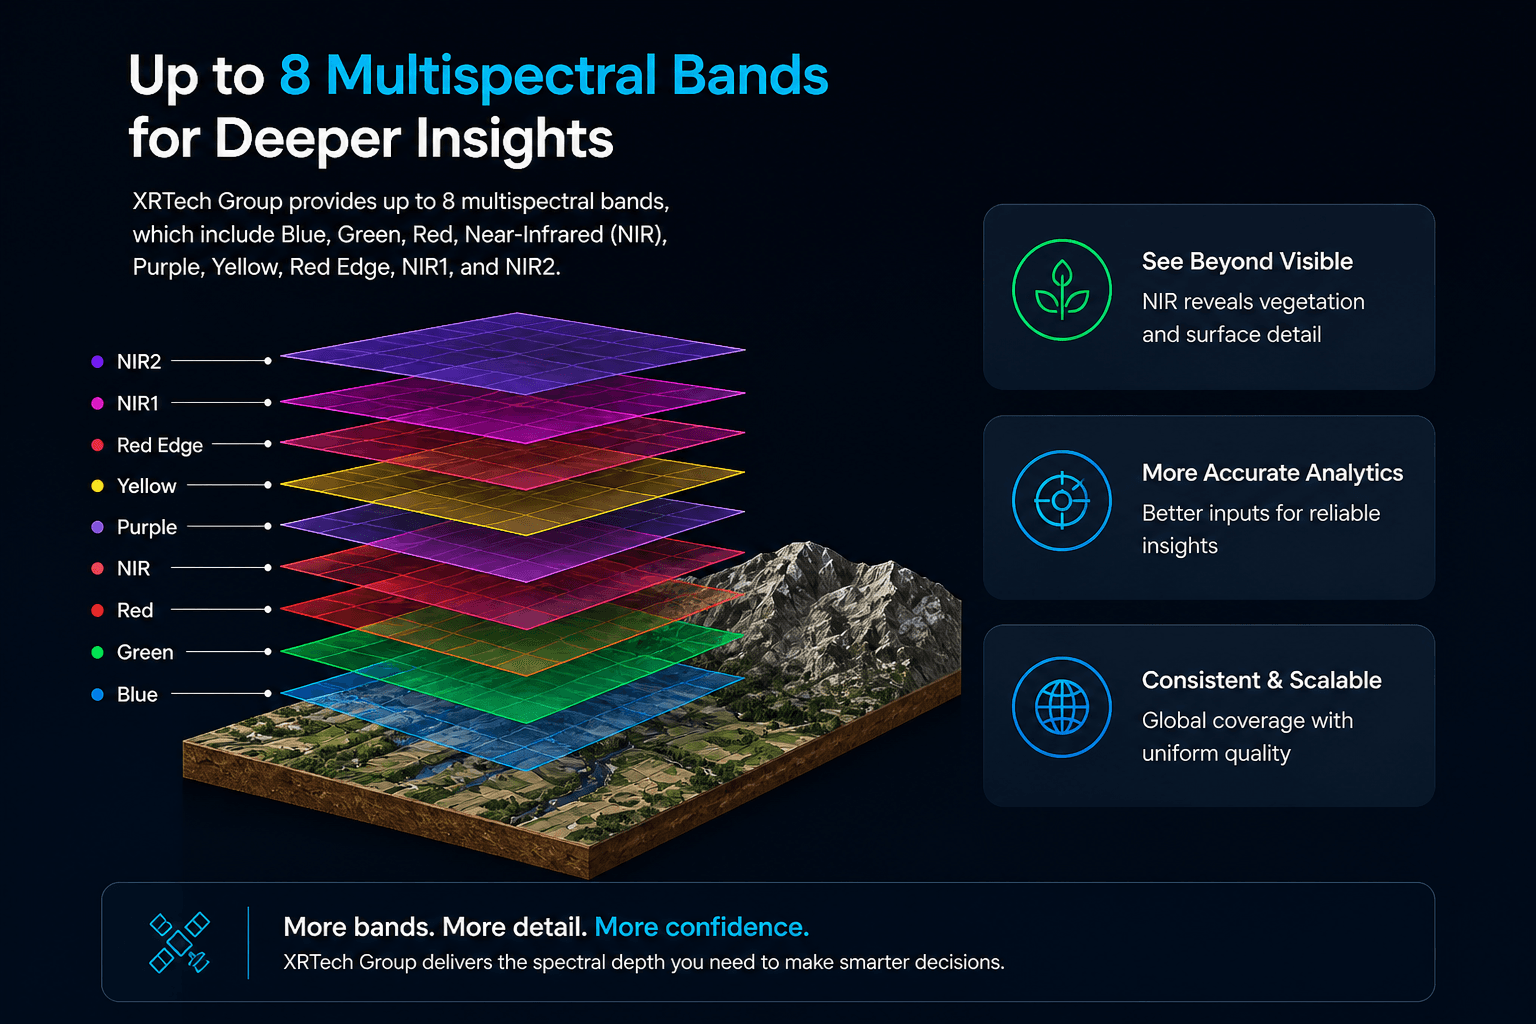
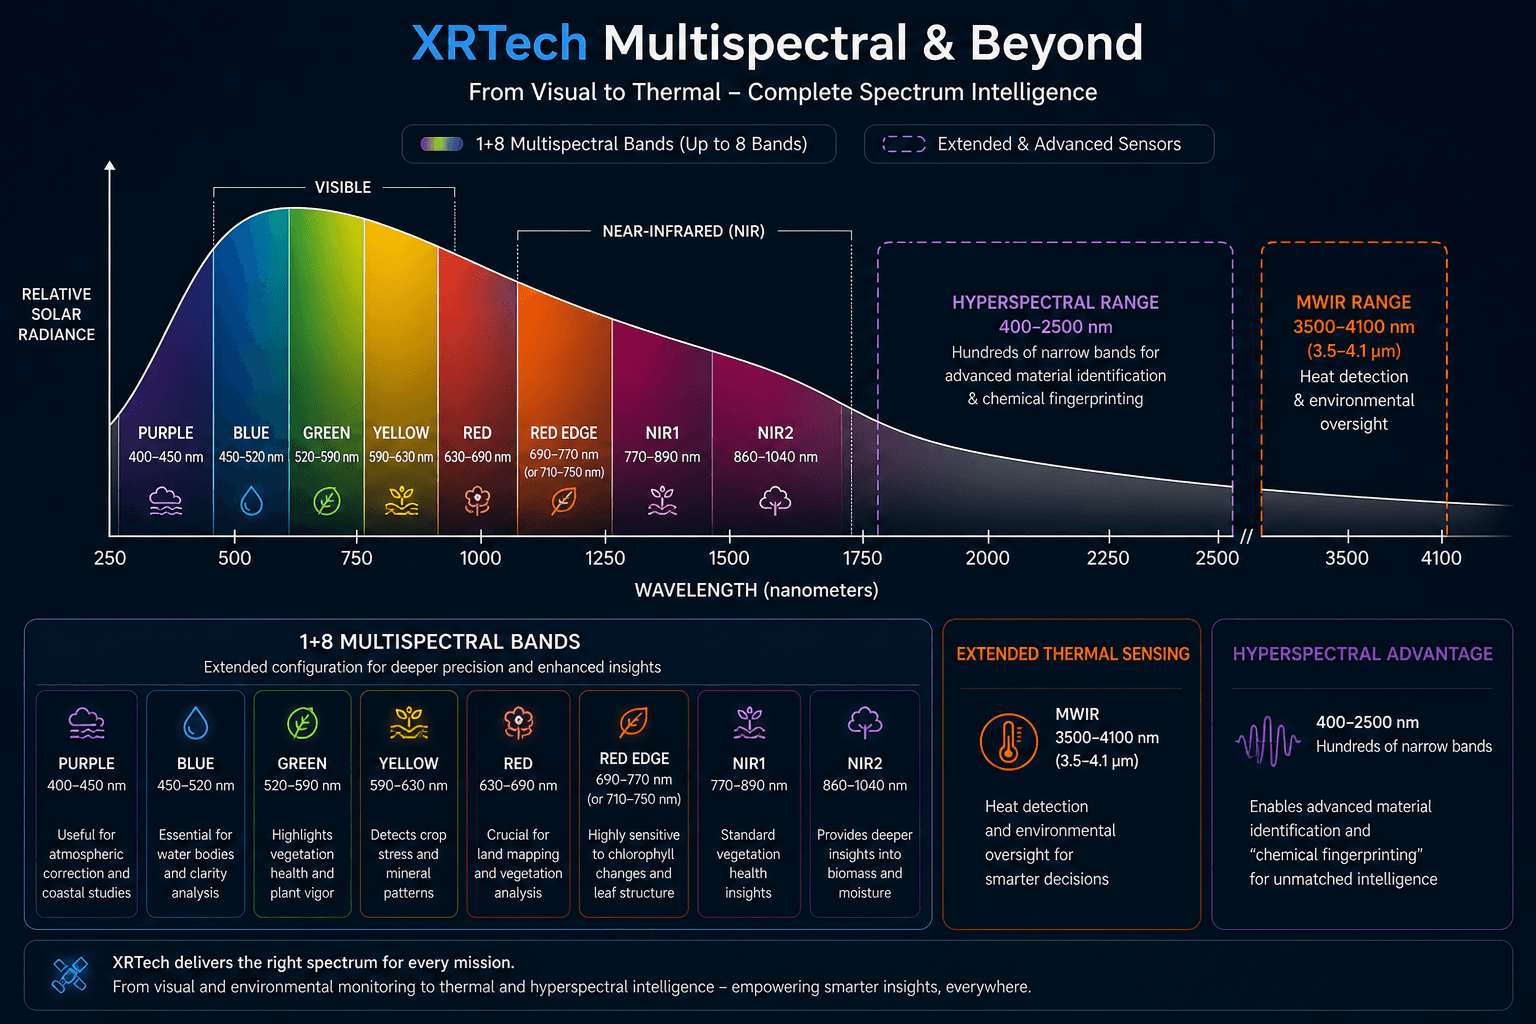
Capturing data across up to 8 spectral bands, extending beyond visible light into near-infrared, red edge, and extended NIR wavelengths, means you are not looking at a photograph. You are reading a material and biological fingerprint of the Earth’s surface.
With 8-band multispectral and 330-band hyperspectral data, you can analyze:
- Is there excavated material indicating subsurface construction activity?
- Will crop health in this region support food security through the coming season?
- Are canopy stress patterns consistent with disease, drought, or nutrient deficiency?
- Has vegetation cover on a tailings dam changed in ways that suggest structural movement?
- What alteration zones indicate potential mineralisation in an exploration target?
- Is the surface material steel, polymer, paint, or concrete, and has it changed since the last observation?
- Are spectral anomalies in this agricultural zone consistent with undeclared crop types?
- Is water quality deteriorating, and what does the spectral signature suggest about the source?
Different materials absorb and reflect light at specific wavelengths in consistent, repeatable patterns. Standard RGB imagery collapses all of that into three visible channels. Multispectral and hyperspectral data keeps it.
8-Band Multispectral Sensing
XRTech’s satellites offers the broadest commercial spectral range available. Each band is calibrated to reveal a specific physical or biological property of the Earth’s surface.
Purple (Coastal) | 400 – 450 nm
Useful for atmospheric correction and deep-water coastal studies. Helps filter aerosol scattering before index calculations are applied.
- Atmospheric correction
- Coastal studies
- Water penetration
Blue | 450 – 520 nm
Readily absorbed by chlorophyll. Provides strong water penetration and is used to calculate EVI’s atmospheric correction. Less affected by atmospheric scattering than coastal bands.
- EVI formula (C2 correction)
- Water body imaging
- Reef cover mapping
- Forest type discrimination
Green | 520 – 590 nm
Captures peak reflectance of healthy vegetation. Ideal for calculating plant vigor, distinguishing plant material types, and monitoring sea grass and underwater features.
- Plant vigor (GNDVI)
- Crop type classification
- Bathymetry
- Sea grass mapping
Yellow | 590 – 630 nm
Detects the “yellowness” of vegetation, both on land and in water. Useful for identifying crop stress, specific mineral patterns, algal blooms, and iron formations.
- Leaf colouration
- Plant stress detection
- Algal bloom monitoring
- Material identification
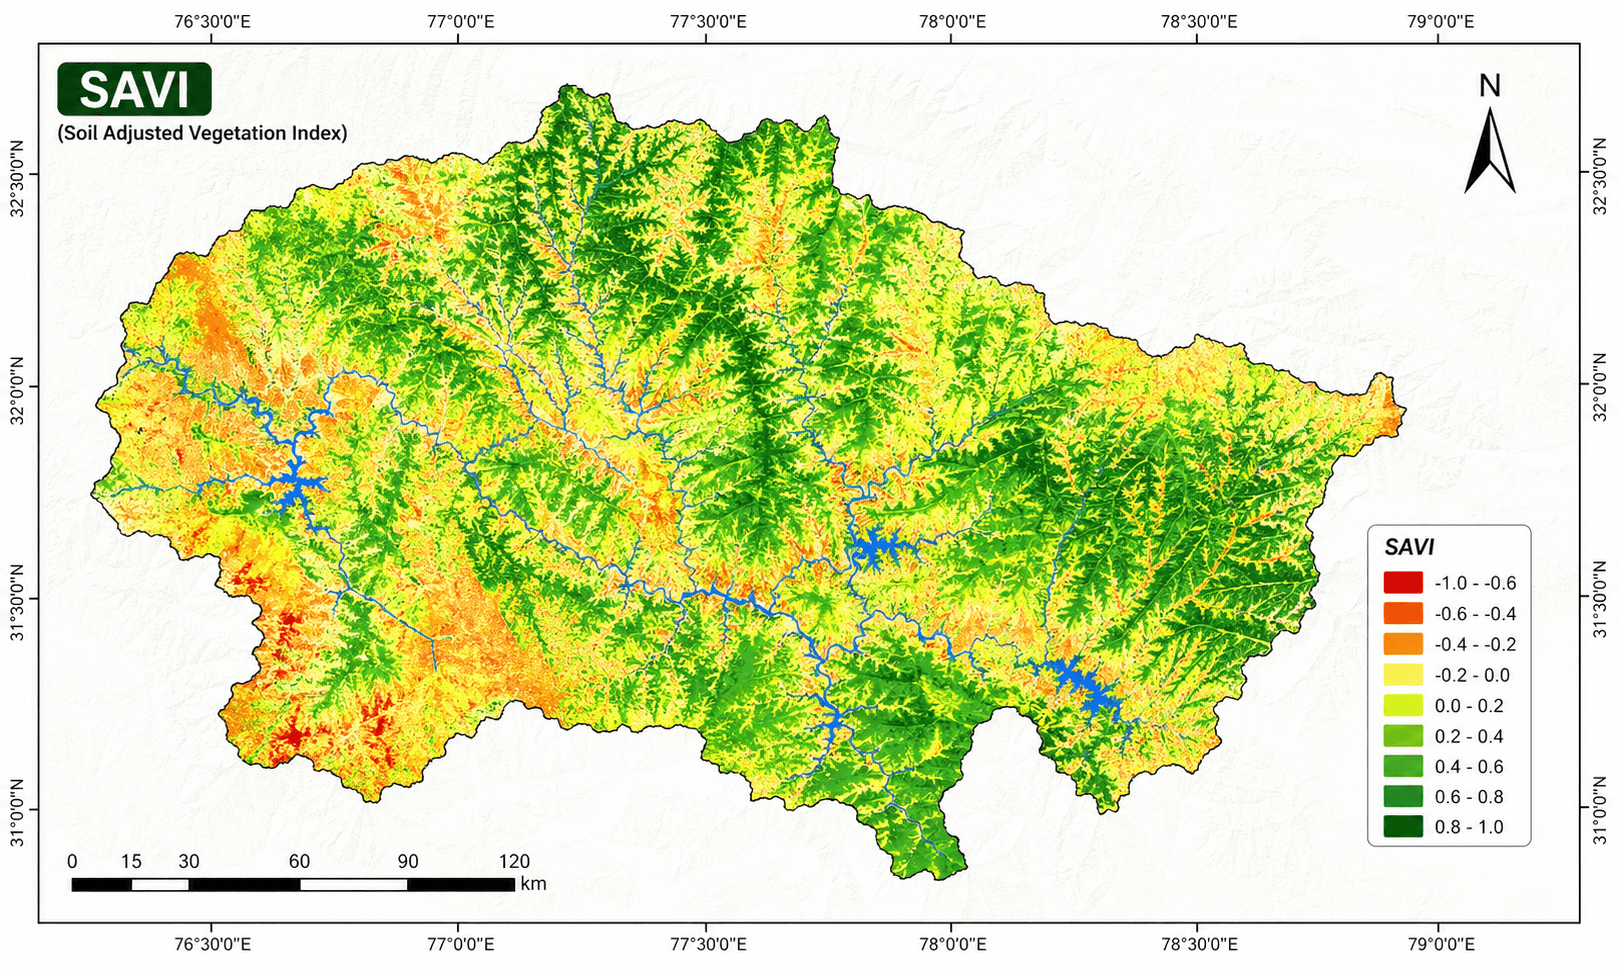
Red | 630 – 690 nm
The most important band for vegetation discrimination. Chlorophyll in healthy plants absorbs red light strongly. Also classifies bare soils, roads, and geological features.
- NDVI calculation
- Chlorophyll absorption
- Vegetation classification
- Soil and road mapping
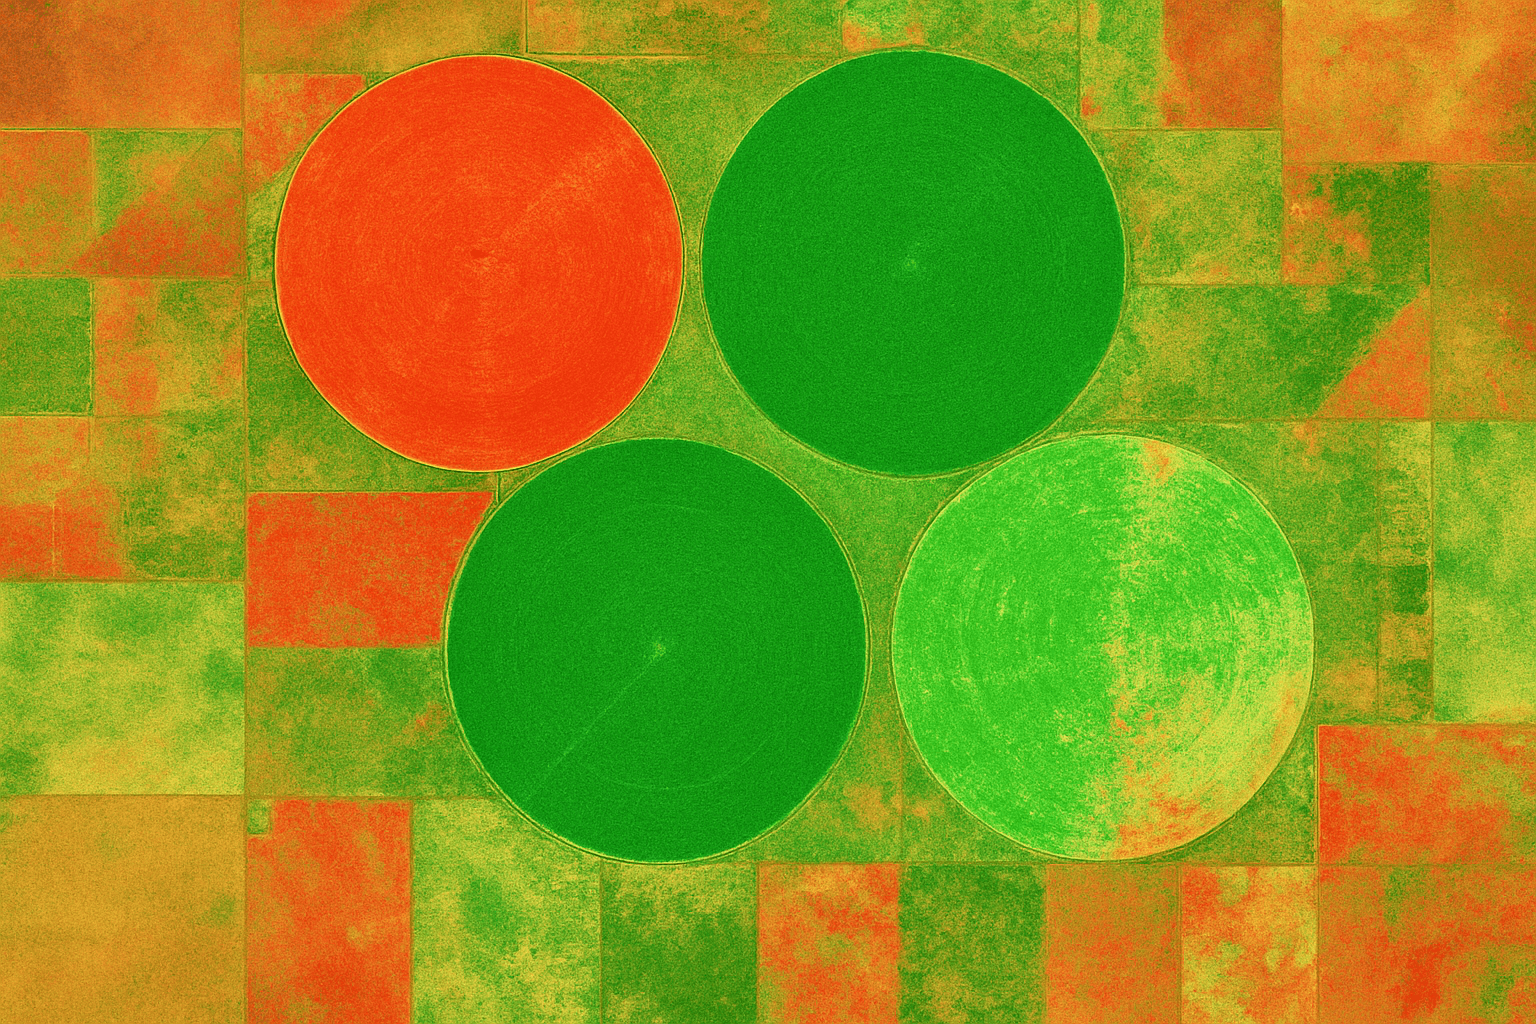
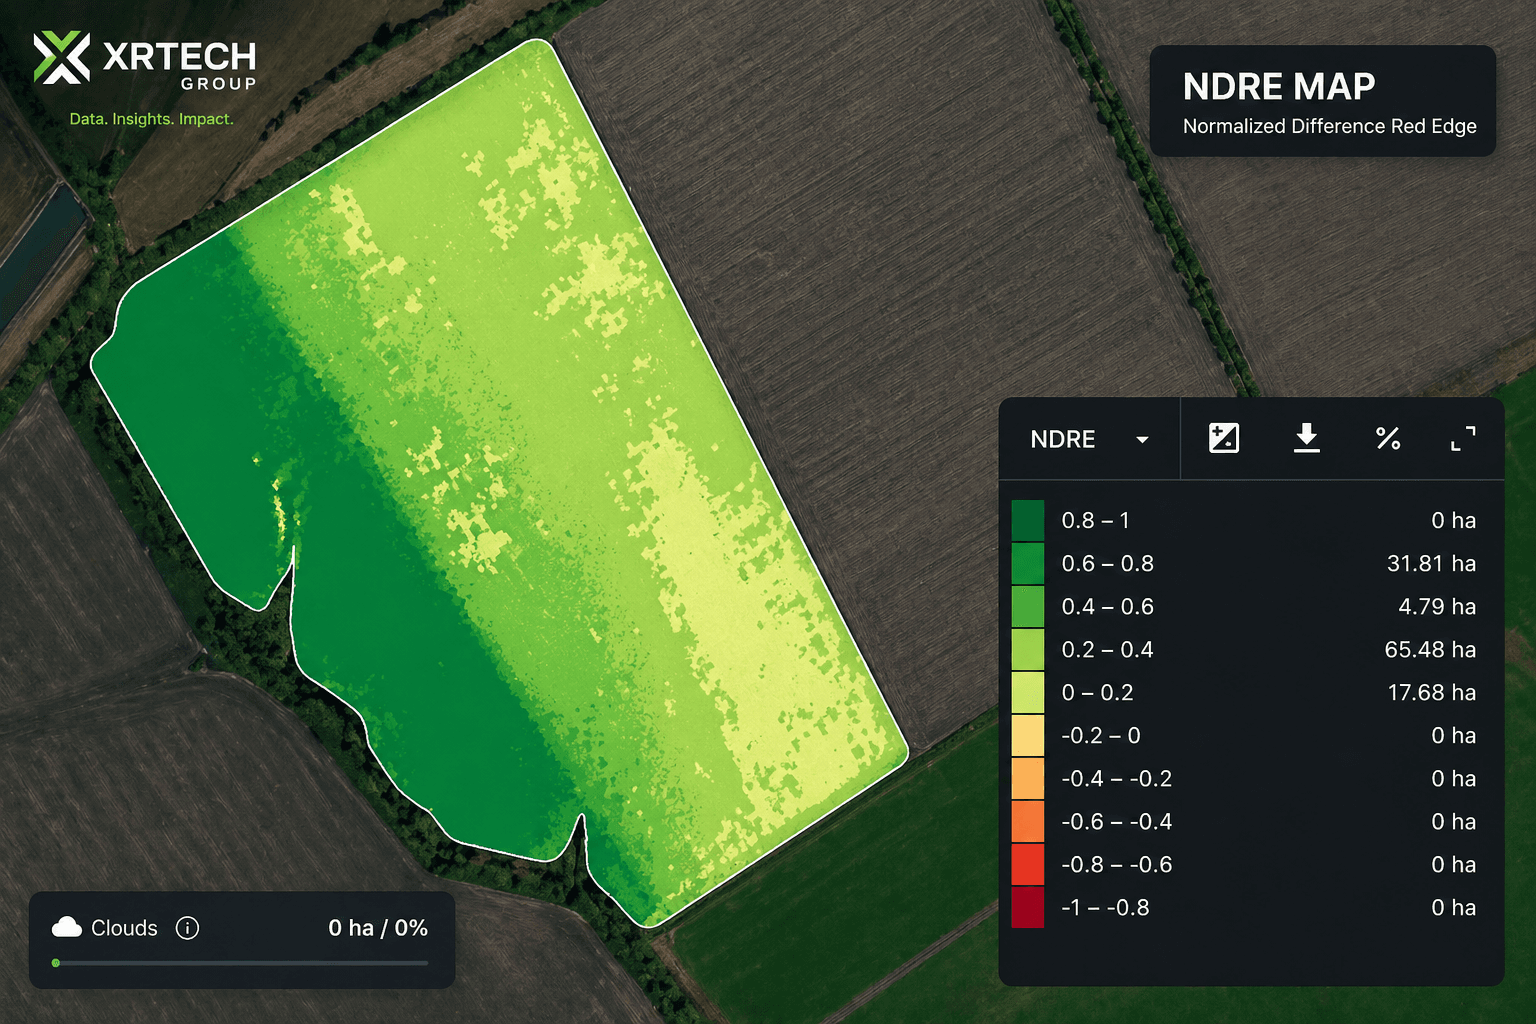
Red Edge | 710 – 750 nm
Centered at the onset of high vegetation reflectivity. This is the most sensitive spectral zone for monitoring chlorophyll content, plant health status, and vegetation stress including camouflage detection.
- NDRE and REIP indices
- Vegetation stress
- Camouflage detection
- Turbidity mapping
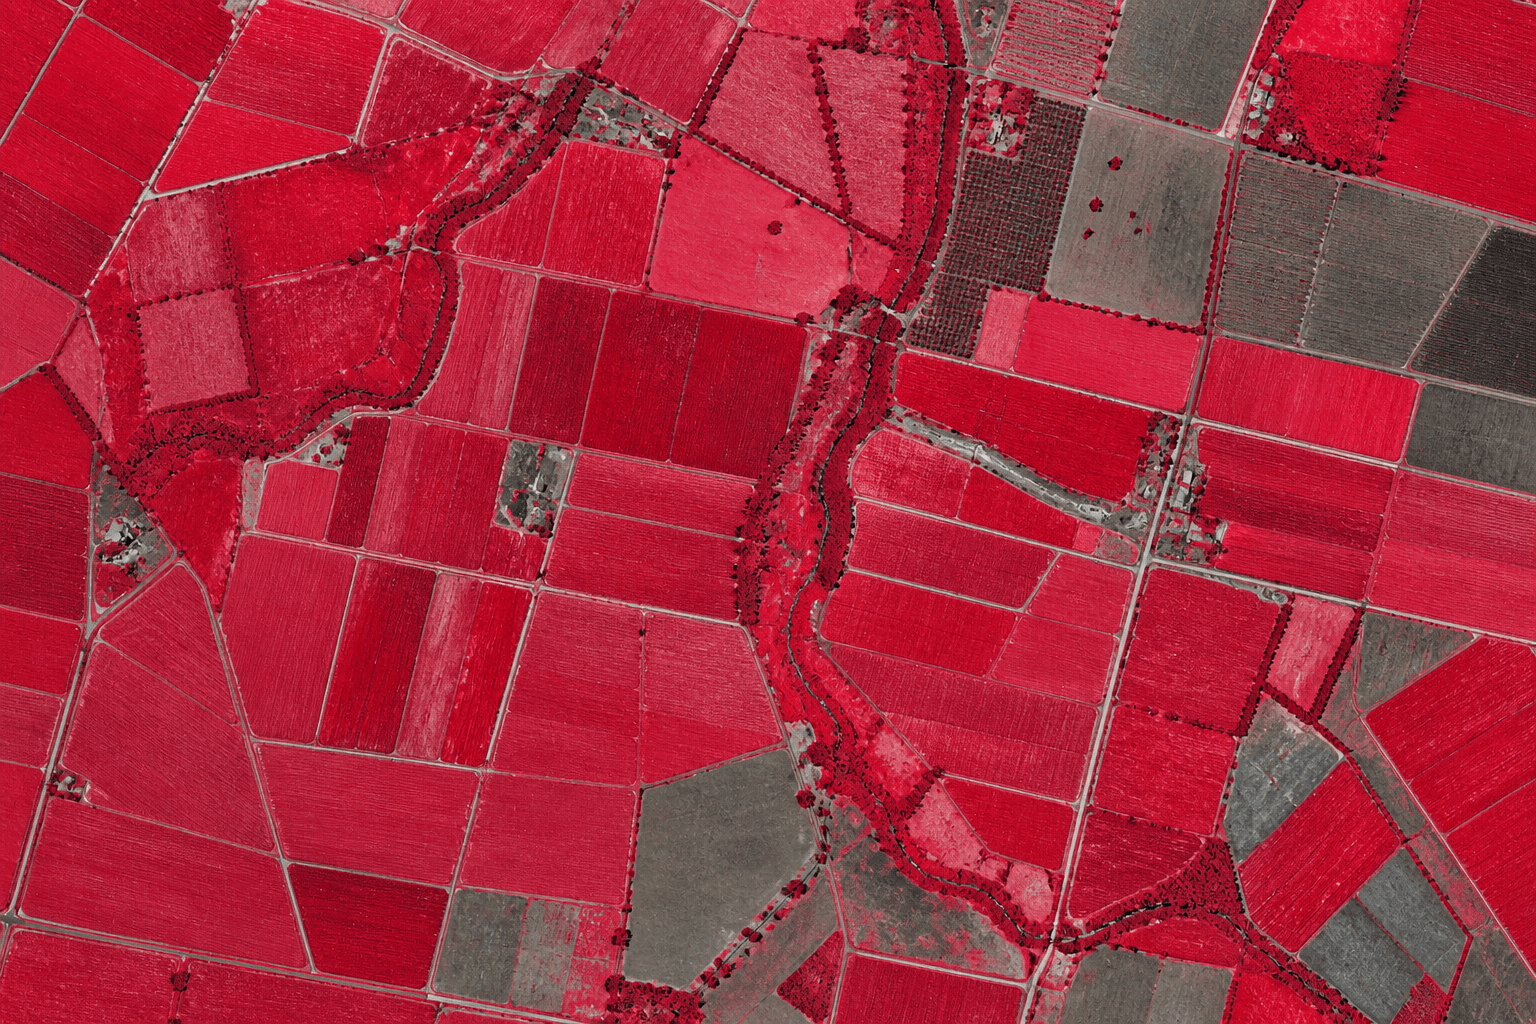
Near-Infrared 1 (NIR1) | 770 – 890 nm
The foundation of all vegetation indices. Healthy plant cells reflect NIR1 strongly through their leaf structure. Separates water bodies from vegetation and discriminates soil types and biomass levels.
- NDVI and EVI
- Biomass surveys
- Water body delineation
- Soil moisture mapping
Near-Infrared 2 (NIR2) 860 – 1040 nm
Overlaps NIR1 but is less affected by atmospheric influence. Enables broader vegetation analysis, deeper moisture content estimation, and more reliable crop species differentiation.
- Moisture content estimation
- Crop species differentiation
- Biomass studies
- Material identification
SWIR (Short-Wave Infrared)
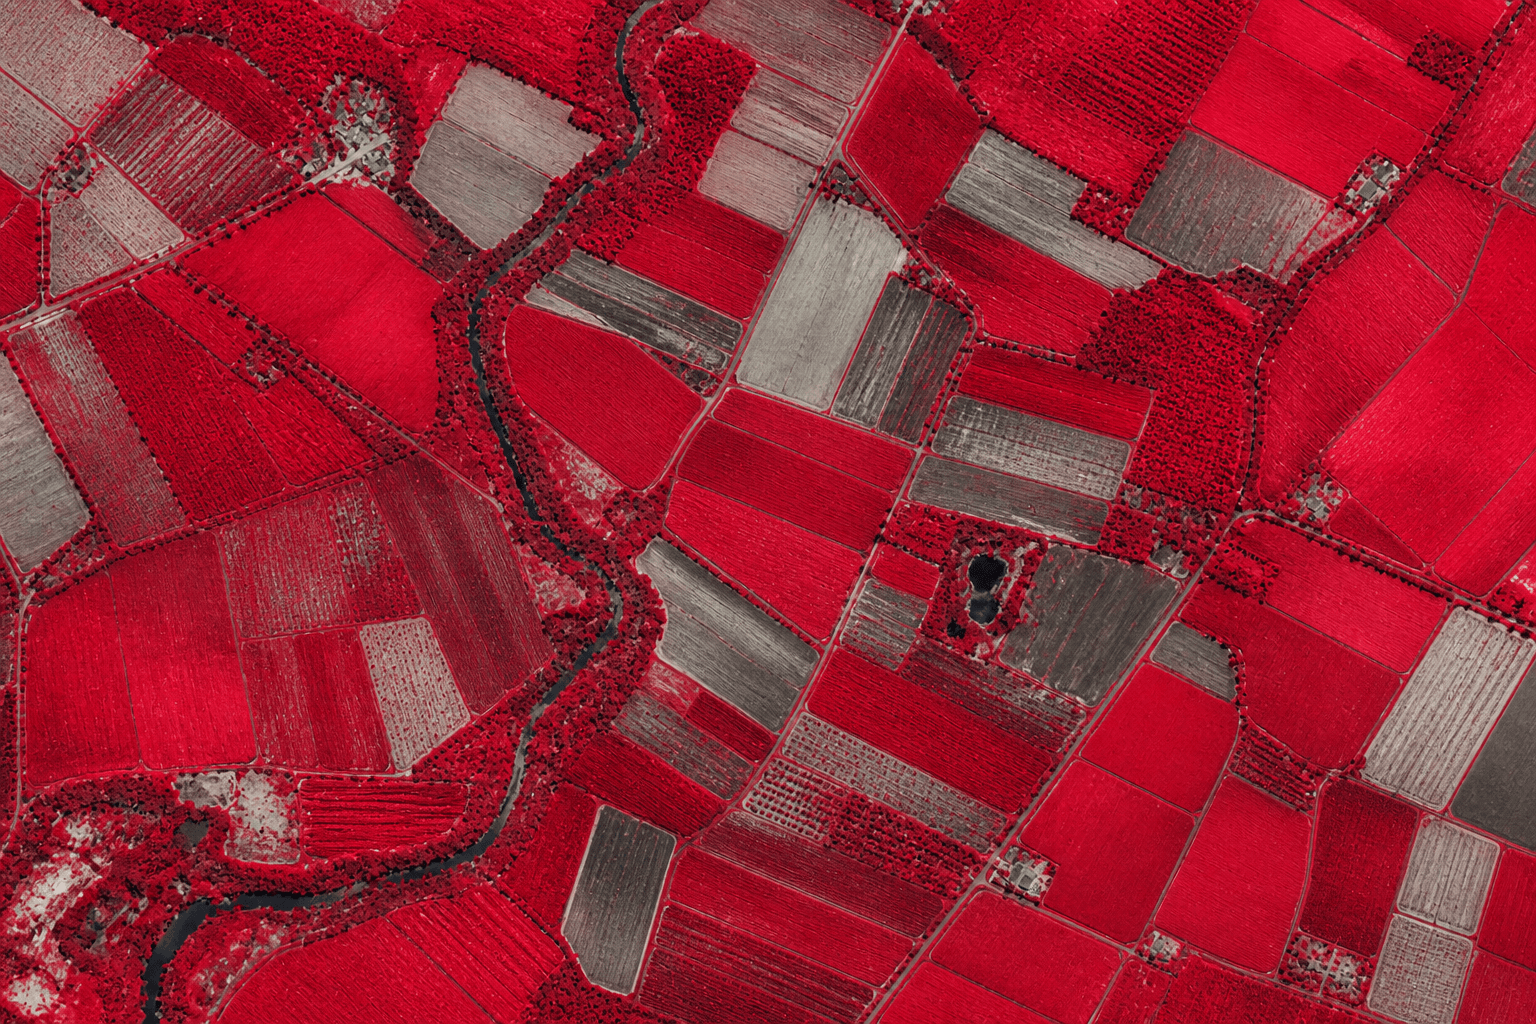
Short-Wave Infrared (SWIR) captures wavelengths beyond the visible and near-infrared range, giving analysts data that standard multispectral sensors cannot produce. While most multispectral imagery covers the VNIR range, specialized sensors used by XRTech Group extend into discrete SWIR bands at 1550 to 1750 nm (1.55 to 1.75 μm), enabling material identification and environmental monitoring at a level of precision that visible-light imagery simply cannot reach.
- Mining and Mineral Exploration
- Environmental Monitoring
- Water and Agriculture
- Disaster Management
Multispectral Imagery vs Hyperspectral Imagery
Both multispectral and hyperspectral imaging types capture data beyond the visible spectrum, but they serve different analytical purposes. The table below shows where each performs best.
Multispectral Imagery
Appearance
Full color with infrared layers, similar to human vision but spectrally extended
Spatial Resolution
Sub-metre to 2m (0.3m to 0.5m at highest resolution)
Spectral Bands
4 to 8 discrete broad bands such as RGB, NIR, Red Edge, and NIR2
Bit Depth
8-bit, 11-bit, and 16-bit depending on sensor and product level
Best For
Land use classification, crop health monitoring, NDVI, and urban planning
Hyperspectral Imagery
Appearance
Color-coded thematic maps showing mineral zones, anomalies, and material classes
Spatial Resolution
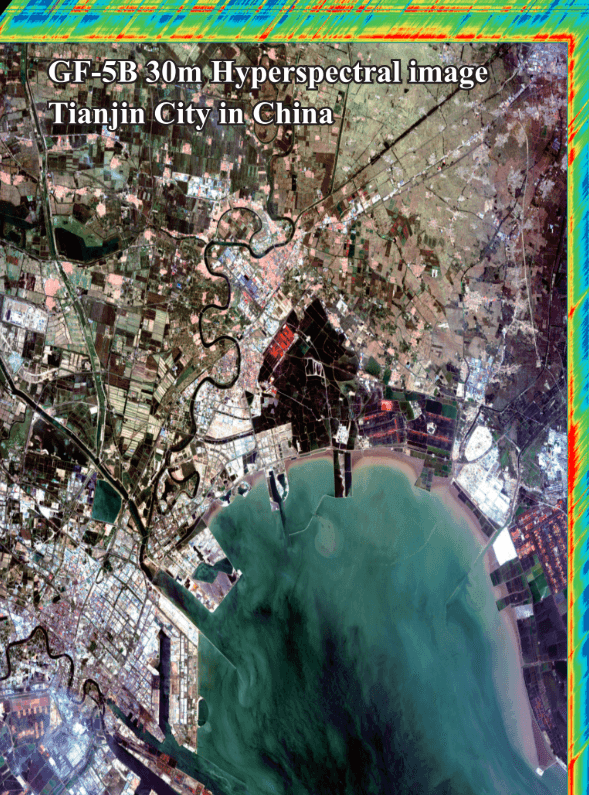
Typically 30m, with industry-leading sensors reaching 5.3m
Spectral Bands
31 to 330 narrow contiguous bands across the full spectral range
Bit Depth
High bit-depth output supporting detailed spectral analysis workflows
Best For
Chemical fingerprinting, mineral exploration, and precise material identification
Ready to See More with Multispectral?
Access high-quality multispectral imagery and unlock the insights that matter.