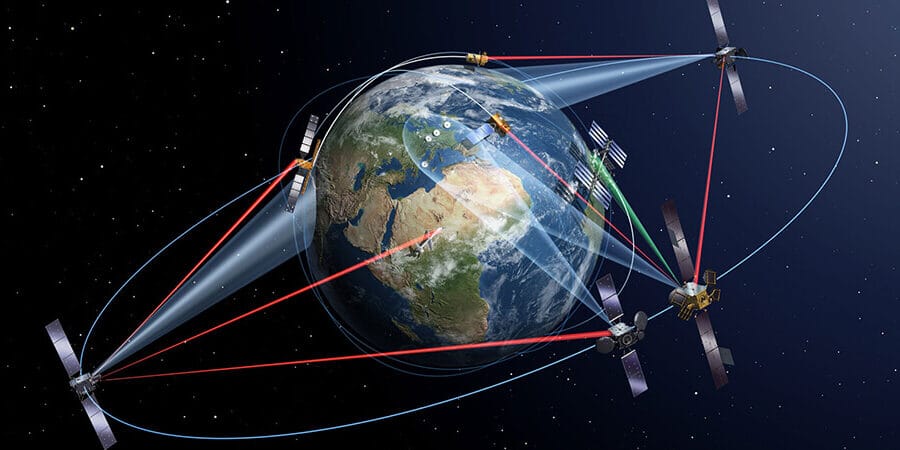
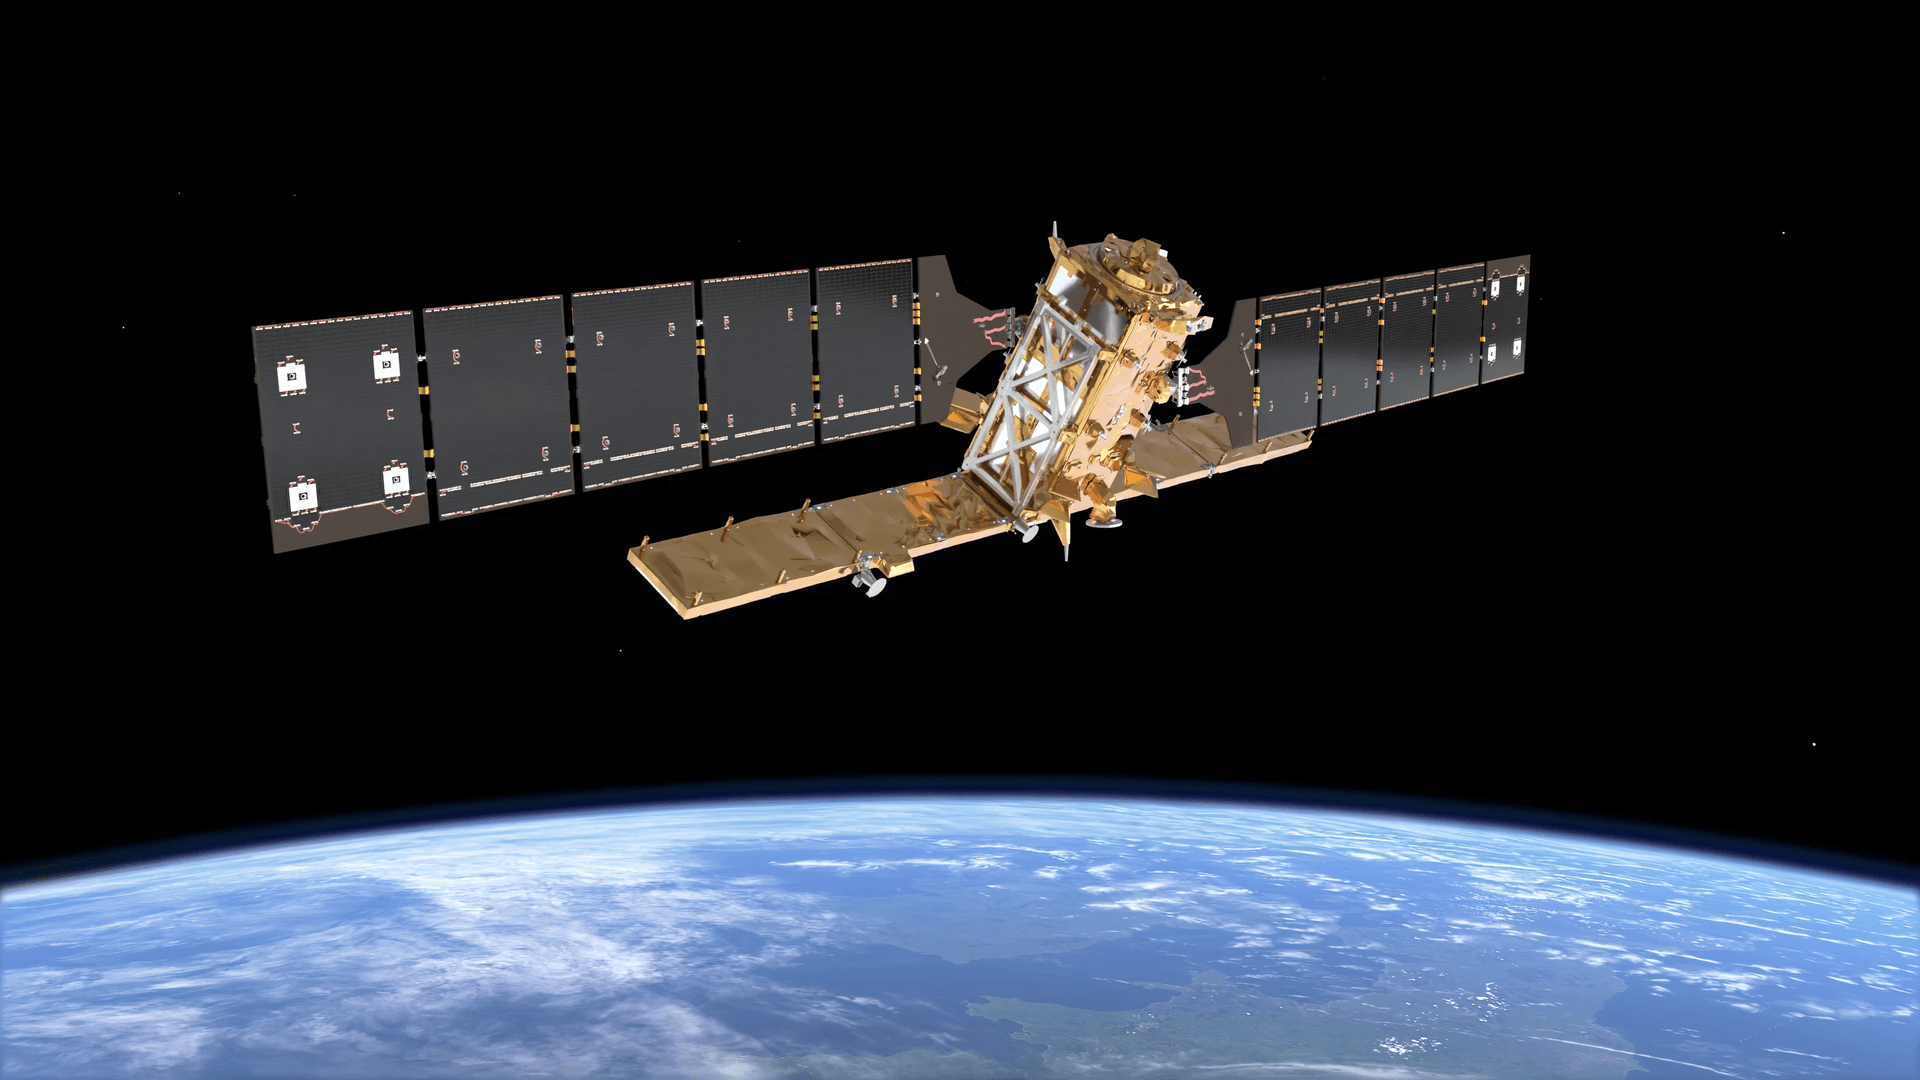
Quick answer: Satellite imagery is transforming agriculture by giving farmers, agronomists, insurers and governments continuous, non-invasive visibility of every field across the whole growing season, without walking it. Multispectral sensors measure how crops reflect visible, red-edge and near-infrared light, and AI models turn those measurements into maps of plant vigour, water stress, nutrient gaps, pests and damage before problems are obvious on the ground. Free satellites such as Sentinel-2 image farmland about every five days at 10 m resolution, and commercial satellites capture farm imagery down to 30 cm. Growers use it to put fertiliser and water where crops need them and forecast yields earlier; insurers and governments use it to verify losses, subsidies and land use.
Agriculture imaging from space is now part of everyday farm management. In the United States, 68% of large crop farms use yield monitors or soil maps and 45% use variable rate technology, according to USDA's Economic Research Service. This guide explains how satellite imagery for agriculture works, the nine main ways farms and the wider sector use it, who relies on it, which resolution you need, how it compares with drones, and where it falls short.
What Is Satellite Imagery for Agriculture?
Satellite imagery for agriculture is image data of farmland collected by Earth observation satellites and analysed to measure crop condition, soil and water. Its value comes from bands the human eye cannot see. Healthy leaves absorb most red light for photosynthesis and strongly reflect near-infrared light, so a stressed or thinning crop shows up as a change in that ratio, often a week or more before leaves visibly yellow.
Farm satellite imagery comes from two kinds of sensor. Optical sensors record reflected sunlight in several spectral bands and need clear skies. Synthetic aperture radar (SAR) sends its own microwave pulses, so it works through cloud and at night. Each band tells you something different about a field:
Band or sensor
What it shows in a field
Typical use
Visible (red, green, blue)
Field boundaries, bare patches, flooding, lodged or flattened crops
Mapping, emergence checks, damage records
Near-infrared (NIR)
Leaf structure and green biomass
NDVI and most crop vigour maps
Red-edge
Chlorophyll and nitrogen status, early stress
Nitrogen management, stress in dense canopies
Shortwave infrared (SWIR)
Water content of leaves and soil, crop residue
Drought stress, tillage and residue mapping
Thermal infrared
Canopy and surface temperature
Evapotranspiration and irrigation scheduling
Radar (SAR)
Crop structure, surface water and soil moisture, through cloud
Rice mapping, monsoon-season monitoring, flood extent
How Is Satellite Imagery Used in Agriculture?
Satellite imagery is used in agriculture for nine main jobs: monitoring crop health, variable rate fertilising, irrigation management, yield forecasting, pest and disease scouting, damage assessment for insurance, subsidy compliance checks, mapping fields and land use, and proving deforestation-free supply chains.
1. Crop Health Monitoring
Multi-temporal satellite imagery tracks crop growth, vigour and maturity from germination to harvest. NDVI compares red and near-infrared reflectance to measure overall plant health and biomass density. NDRE uses red-edge bands, carried by satellites such as SuperView-2 and GF-6, which respond to chlorophyll and nitrogen deeper in the canopy; it stays sensitive in dense, late-season crops where NDVI levels off and picks up nutrient stress before leaves visibly change colour. Comparing each new image with the last shows where growth has slowed, so agronomists scout the weak zones instead of walking whole fields. Our guide to vegetation indices covers which index suits which crop stage.
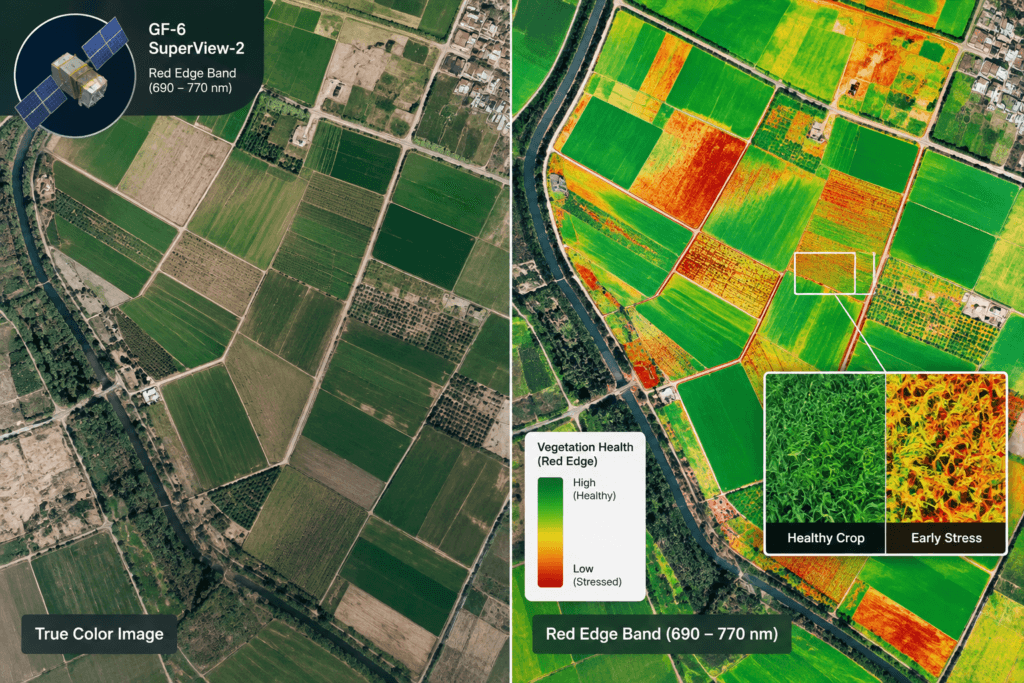
True colour image (left) and a red-edge crop health map (right) of the same fields. Stressed zones stand out in the index map long before they are visible in the photo.
Index
Bands used
What it tells you
NDVI
Red, near-infrared
Overall vigour and green biomass, early to mid-season
NDRE
Red-edge, near-infrared
Chlorophyll and nitrogen status in dense canopies
EVI
Blue, red, near-infrared
Vigour in dense vegetation, less affected by haze and soil
SAVI and MSAVI
Red, near-infrared, with a soil correction
Young or sparse crops where bare soil shows between rows
NDMI
Near-infrared, shortwave infrared
Leaf water content and early drought stress
CWSI
Thermal (canopy temperature)
Crop water stress for irrigation timing
2. Variable Rate Fertiliser and Seeding
Historical satellite archives show how each part of a field performed over several seasons. Field productivity maps separate zones that are consistently high or low yielding, and those zones become variable rate prescription maps that tell a seeder or spreader to apply inputs in proportion to what each zone can use. In an ESA-supported service called FertiSat, Sentinel-2 based nitrogen maps let farmers apply 19.5% less nitrogen, about 35 kg N per hectare. Results vary by field: in many trials the main gain is higher or more even yield rather than lower fertiliser use.
3. Irrigation and Water Management
Thermal, infrared and multispectral bands measure surface soil moisture and crop water stress at field scale, often expressed as the Crop Water Stress Index (CWSI), and models combine them to estimate evapotranspiration, the water a crop actually uses. In Henan Province, China, XRTech Group used satellite soil moisture monitoring to guide field-scale irrigation, improving water-use efficiency and crop yields. Public tools exist too: OpenET publishes free field-scale evapotranspiration from Landsat for 17 western US states, and FAO's WaPOR portal provides satellite water productivity data worldwide. Growers use these figures to schedule irrigation, avoid over-watering and drought damage, and find uneven pivots or leaks.
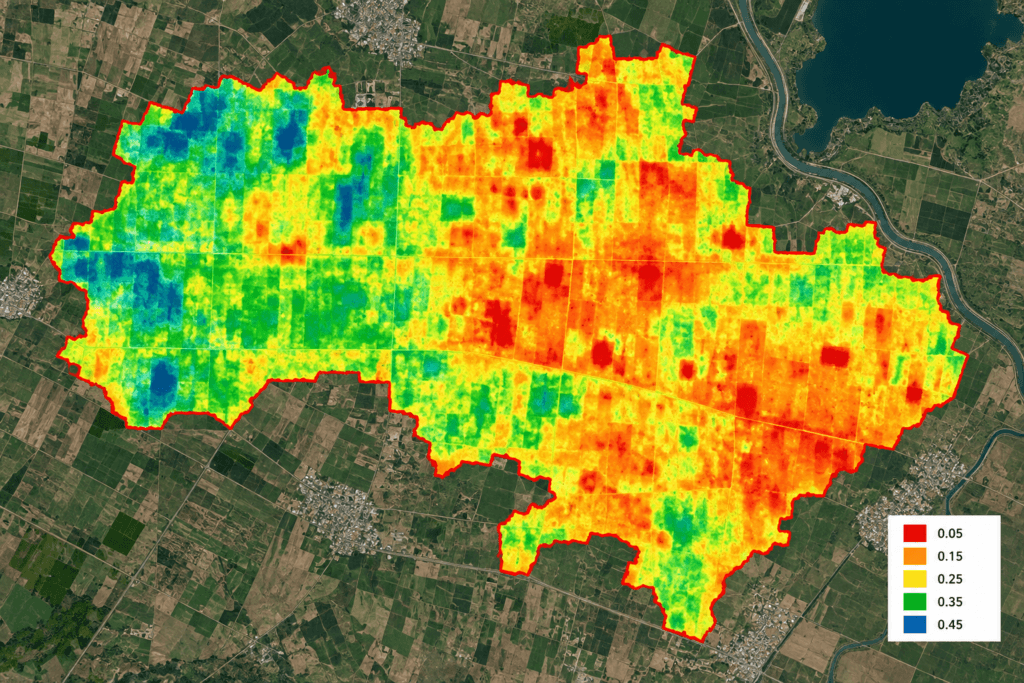
Soil moisture map derived from satellite data: red areas are driest, blue areas wettest.
4. Yield Forecasting and Crop Statistics
Combining multi-source spectral data with AI models lets analysts estimate biomass and forecast yields weeks before harvest. Across China's wheat belt, XRTech Group used multi-temporal satellite imagery and AI to track growth stages, flag drought stress and nutrient deficiencies early, and predict seasonal wheat yields, with county-level yield accuracy of up to 85% in its projects. At national scale, the USDA's Cropland Data Layer maps every field in the continental United States by crop each year, at 10 m resolution since the 2024 edition. Globally, the GEOGLAM Crop Monitor for the G20's Agricultural Market Information System publishes monthly satellite-based condition reports for wheat, maize, rice and soybean in countries producing over 80% of world supply, with NASA Harvest, a University of Maryland-led consortium of more than 50 partners, as NASA's contribution.
5. Pest, Disease and Weed Scouting
FAO estimates that up to 40% of global crop production is lost to pests every year, and plant diseases alone cost the world economy over $220 billion. Satellites flag the symptom rather than the culprit: a patch where vigour drops or the canopy changes faster than the rest of the field. AI risk-classification models trained on spectral signatures then sort those patches into likely causes such as pests, disease or weed competition; in specific field scenarios, XRTech Group's models exceed 90% accuracy. Growers send scouts or drones to confirm, then treat only the affected area, cutting chemical costs and environmental impact. Very high resolution imagery, at 30 to 50 cm, also shows weed patches, missing trees in orchards and gaps in plantations.

Satellite maps of disease distribution (left) and severity (right) across a farming area, used to target treatment and document losses.
6. Damage Assessment and Crop Insurance
Satellite data combined with weather monitoring gives early warning of drought, floods and frost, and before and after images show which fields were hit and how badly, without waiting for an adjuster to visit each one. Insurers use this objective evidence to verify crop loss and settle claims faster, and XRTech Group has supported crop health tracking and subsidy distribution accuracy in India and Nigeria. India's national crop insurance scheme, PMFBY, introduced the satellite-based YES-TECH yield estimation system for paddy and wheat from the Kharif 2023 season, giving remote sensing at least 30% weight in the official yield used to settle claims.
7. Subsidy and Compliance Checks
Since 1 January 2023, EU member states must run an Area Monitoring System that checks farm payment claims with Copernicus Sentinel-1 radar and Sentinel-2 optical images. Instead of inspecting a sample of farms, algorithms review every declared parcel through the season; Ireland alone monitors about 1.1 million parcels this way. AI models also classify crop types and detect unauthorised conversion of farmland, such as illegal construction, soil excavation or land clearing; XRTech Group's crop type and non-grain land change models exceed 90% accuracy.

Parcel-level land use maps from satellite imagery, used to check whether farmland is still cropped or has been converted.
8. Field Mapping and Land Assessment
High resolution farm imagery is used to draw field boundaries, measure planted area, count trees in orchards, plan drainage and roads, and assess land before purchase or lending. Historical archives show how a parcel was used over decades: the Landsat record starts in 1972, and Sentinel-2 imagery goes back to 2015.
9. Deforestation-Free Supply Chains (EUDR)
The EU Deforestation Regulation (EUDR) requires companies placing cattle, cocoa, coffee, oil palm, rubber, soya and wood products on the EU market to give the geolocation of every production plot and show the land was not deforested after 31 December 2020. Under amending Regulation (EU) 2025/2650, it applies from 30 December 2026 for large operators and 30 June 2027 for micro and small operators. Satellite archives from before and after the cut-off date are the practical way to check thousands of plots, so exporters, cooperatives and buyers are building plot-level imagery records now.
Who Uses Agriculture Satellite Imagery?
Satellite imagery for agriculture serves the whole value chain, from the grower to the lender, insurer, regulator and food buyer. Each needs a different answer from the same images:
Stakeholder
What they use it for
Farmers and growers
Crop health alerts, variable rate maps, irrigation timing and field records
Agronomists and crop advisers
Prioritising scouting and recommendations across many clients' fields
Input suppliers and machinery dealers
Prescription files for customers and regional demand planning
Crop insurers
Underwriting risk, verifying losses and settling claims faster
Banks and agricultural lenders
Confirming financed land is farmed and tracking seasonal risk on loan portfolios
Governments and statistics agencies
Subsidy checks, crop area and yield statistics, food security early warning
Commodity traders and food companies
Supply forecasts, sourcing risk and deforestation-free proof for buyers
Water authorities
Measuring irrigation water use and enforcing allocations
What Resolution Do You Need for Farm Satellite Imagery?
For most field crops, free 10 m Sentinel-2 imagery is enough to monitor crop health on fields of several hectares or more. Choose 3 m or sub-metre farm satellite imagery for small or narrow fields, orchards and tree counts, and for evidence in insurance or legal cases. The pixel count per hectare shows why:
Resolution class
Example satellites, revisit and cost
Pixels per hectare
Best for
Coarse (250 m to 1 km)
MODIS, Sentinel-3; daily; free
Less than 1 (one 250 m pixel covers 6.25 ha)
Regional crop conditions and drought
Medium (10 to 30 m)
Sentinel-2 at 10 m, about every 5 days; Landsat 8 and 9 at 30 m, every 8 days combined; free
100 at 10 m, about 11 at 30 m
Field-level crop health, crop type maps, irrigation on larger fields
High (about 3 m)
PlanetScope; near-daily; commercial subscription
About 1,100
Frequent within-field monitoring and management zones
Very high (30 cm to 1 m)
SuperView Neo, SuperView-2, Gaofen series and other commercial satellites; archive or new tasking; priced per km²
10,000 at 1 m, about 111,000 at 30 cm
Small plots, orchards, tree counts, boundaries, damage evidence
Radar (SAR)
Sentinel-1, every 6 to 12 days, free; commercial SAR on request
Varies by mode
Cloudy and monsoon regions, rice, flooding, soil moisture
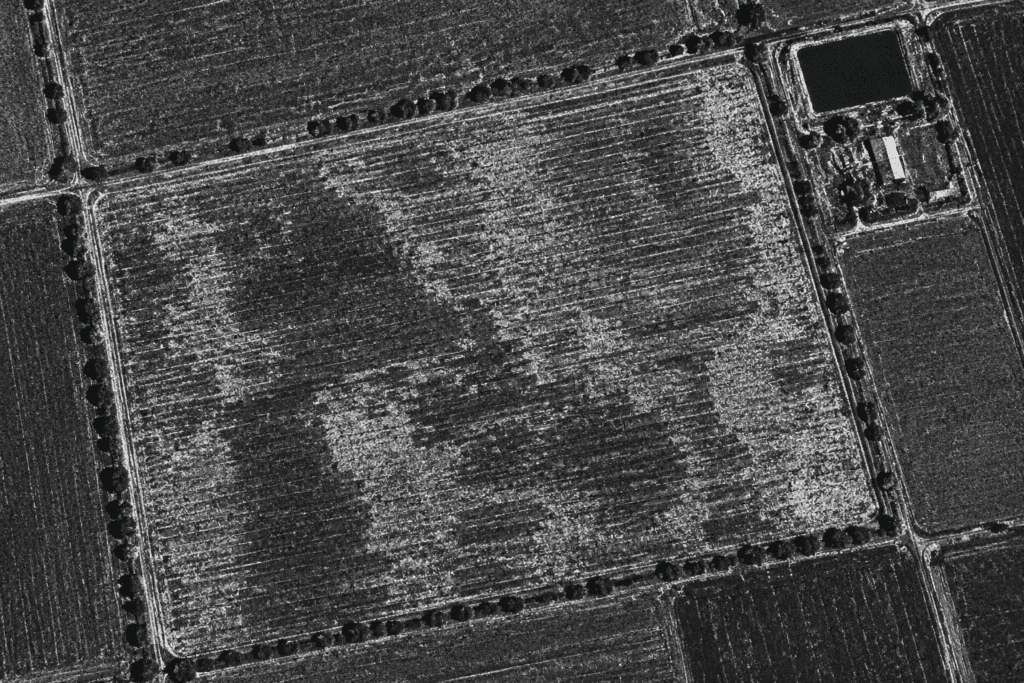
Radar (SAR) image of farm fields. Radar records crop structure and surface water even when clouds block optical satellites.
Satellite vs Drone vs Ground Scouting
Satellites are best for regular, whole-farm monitoring and history; drones for centimetre-level detail on problem spots; ground scouting for confirming causes. Most precision programmes combine all three: satellite maps show where to look, drone farm imagery shows the detail, and scouts decide what to do.
Factor
Satellite
Drone
Ground scouting
Area covered
Whole farms to whole countries in one pass
One field to a farm per flight day
A few fields per day
Detail
30 cm to 30 m per pixel
About 1 to 5 cm per pixel
Individual plants, leaves and insects
Frequency
Scheduled every 1 to 8 days, with archives going back decades
On demand, when a pilot flies
On demand, limited by labour
Weather limits
Optical needs clear sky; radar works through cloud
Grounded by wind and rain; can fly under cloud
Few limits
Best for
Season-long monitoring, large areas, past seasons
Detailed checks, plant counts, targeted spraying
Confirming causes, soil and tissue sampling
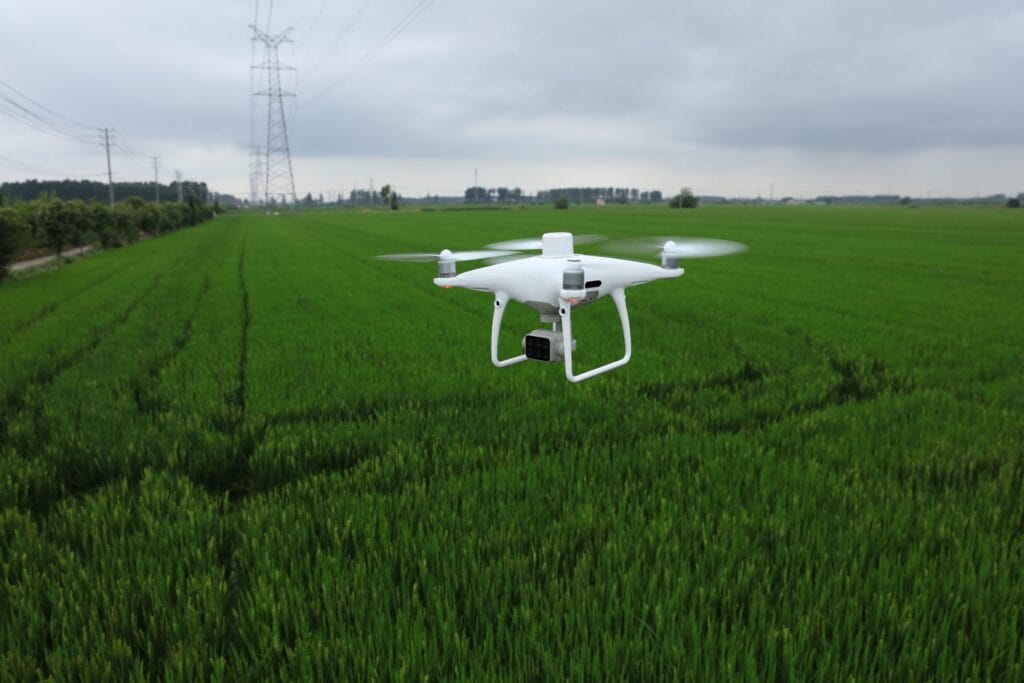
A mapping drone over a crop field. Drones add centimetre detail where satellite maps flag a problem.
Limitations of Agriculture Satellite Imagery
Satellite imagery shows where crops differ, not always why, and optical images depend on clear skies. Plan around these limits:
- Cloud cover: optical sensors cannot see through cloud, so a five-day revisit can turn into weeks without a usable image. Radar fills the gap but is harder to interpret.
- Field size: on small or narrow plots, a 10 m pixel mixes crop, bare soil and field edges, so field satellite images at that resolution blur the detail that matters.
- Symptoms, not causes: the same low-vigour patch can be drought, disease, compaction or a sprayer miss, so ground checks are still needed.
- Processing: raw images need cloud masking, atmospheric correction and calibration before dates can be compared fairly.
How to Start Using Satellite Imagery on Your Farm
- Map your field boundaries, or import them as a shapefile.
- Match resolution and revisit to your field size and the decisions you need to make.
- Build a baseline from archive images of past seasons to find stable high and low zones.
- Pick the index that answers your question: vigour, nitrogen or water stress.
- Ground-truth the zones with scouting and soil or tissue samples.
- Act on the maps through prescriptions, irrigation schedules or scouting routes, then compare results next season.
When free data is not detailed or frequent enough, XRTech Group supplies agriculture satellite imagery from more than 130 satellites, including red-edge, sub-metre and radar sensors, as archive images or new captures. See our satellite imagery for precision agriculture service for products and analytics.
Get Satellite Imagery of Your Fields
Tell us where your fields are, the crops you grow and how often you need images. We will check archive and new-capture options across more than 130 satellites and send you a free quote.
Frequently Asked Questions
Where can I get free satellite imagery of my farm?
Sentinel-2 and Landsat imagery is free. You can view and download it in the Copernicus Browser, USGS EarthExplorer or Google Earth Engine, and many farm management apps display it automatically once you draw your field boundaries.
Can satellite imagery see individual plants or trees?
Individual tree crowns, yes: at 30 to 50 cm resolution you can count trees in orchards and plantations and spot gaps. Individual plants in row crops such as wheat or maize, no; that needs drone imagery at a few centimetres per pixel.
What time of day are agricultural satellite images taken?
Most optical Earth observation satellites are in sun-synchronous orbits that pass overhead in the mid-morning. Sentinel-2 crosses the equator at about 10:30 local time and Landsat at about 10:00, so images of the same field are taken under similar light.
Can satellite imagery measure soil nutrients?
Not directly. Images of bare soil show differences in colour, organic matter and texture that tell you where to take samples, but nitrogen, phosphorus and potassium levels still need laboratory soil tests.
Can satellites show when a crop is ready to harvest?
They show when it is getting close. Vegetation index values fall as a crop senesces and dries down, so tracking that decline field by field helps schedule harvest and machinery, although moisture and quality still need checking on the ground.
Is satellite imagery used for pasture and grazing?
Yes. Satellite estimates of pasture growth and green biomass help graziers set stocking rates and plan rotations. Australia's Pastures from Space programme, developed by CSIRO and Western Australian agencies, is a long-running example.
How is satellite imagery used in farm carbon programmes?
Satellites map practices that affect soil carbon, such as cover crops, tillage and residue, across many farms at once. Systems such as the Operational Tillage Information System (OpTIS) use Landsat and Sentinel data for this, helping verify practice changes claimed in carbon and sustainability programmes.
What file formats work with farm machinery and software?
Imagery and index maps are usually delivered as GeoTIFF files. Management zones and prescriptions are exported as shapefiles or ISOXML, the ISO 11783 standard used by many tractor terminals, so they can drive variable rate equipment directly.
Sources
- USDA Economic Research Service: Precision agriculture in the digital era, recent adoption on U.S. farms
- USDA National Agricultural Statistics Service: Cropland Data Layer
- European Commission and Ireland Department of Agriculture: CAP Area Monitoring System
- European Union: Regulation (EU) 2023/1115 on deforestation-free products and amending Regulation (EU) 2025/2650
- Government of India, Ministry of Agriculture: PMFBY and YES-TECH yield estimation
- FAO and IPPC Secretariat: Scientific review of the impact of climate change on plant pests
- GEOGLAM: Crop Monitor for the G20 Agricultural Market Information System
- NASA Harvest: NASA's Food Security and Agriculture Program
- OpenET: satellite-based evapotranspiration for the western United States
- FAO: WaPOR, remote sensing for water productivity
- ESA: Sentinel-2 and Sentinel-1 mission overviews, Sentinel-1C launch
- USGS: Landsat 8 and Landsat 9 missions
- ESA Business Applications: FertiSat variable rate nitrogen service
- Planet: PlanetScope monitoring
- XRTech Group: satellite imagery for precision agriculture case studies

Mustafa Jawaad
General Manager, XRTech Group
Mustafa helps governments and critical industries get satellite and UAV data in days rather than weeks, from archive search and new satellite tasking to processed maps, so teams can plan infrastructure faster and with less risk. Connect on LinkedIn.