Quick answer: Yes. Satellite data can provide continuous, reliable remote monitoring of an oil and gas pipeline Right-of-Way (ROW), its facilities and the surrounding area. XRTech Group combines sub-metre optical imagery (0.25 m to 0.5 m), all-weather SAR radar that works day and night, AI change detection against a historical baseline, and InSAR ground movement measurement to 1 to 2 mm. The system flags encroachment, unauthorised construction, vegetation growth, ground subsidence, landslides, floods and oil leaks early, and sends each alert with GPS coordinates to field teams.
The enquiry: what pipeline operators are asking for
“Satellite data to provide continuous and reliable remote monitoring of the pipeline Right-of-Way (ROW), associated facilities and surrounding areas, with early identification of potential threats, abnormal activities and environmental events. The required solution shall combine satellite imagery, automated change detection…” This guide answers that oil and gas pipeline monitoring requirement point by point and shows how XRTech Group delivers it.
0.25 mSharpest optical detail along the ROWUp to 25x / dayRevisits from the SuperView Neo system1 to 2 mmInSAR ground movement accuracy24/7SAR monitoring through cloud, rain and darkness
How Satellite Oil and Gas Pipeline Monitoring Works
Satellite pipeline monitoring turns repeat imagery of the whole oil and gas corridor, from wellhead gathering lines to export terminals, into a stream of verified alerts. XRTech Group runs it in four steps:
01AcquireSub-metre optical and all-weather SAR images of the full ROW, facilities and buffer zone, on a fixed revisit schedule.02DetectAI change detection compares each new image with the historical baseline and flags anything new, moved or missing.03MeasureInSAR measures ground subsidence, landslides and soil movement around the buried pipe down to millimetres.04AlertEach verified change becomes a spatial alert with GPS coordinates, before and after images and a risk level for field teams.
What Threats Can Satellites Detect Along an Oil and Gas Pipeline ROW?
This matrix shows which satellite sensor finds which threat. It covers the main risks named in a typical oil and gas pipeline monitoring enquiry, for crude oil, gas and product lines.
Threat or event
Satellite data used
How it is detected
Encroachment and unauthorised construction
Sub-metre optical, SAR
AI change detection finds new buildings, roads, fences and earthworks in the buffer zone
Third-party excavation and heavy machinery
Sub-metre optical, frequent revisit
New trenches, spoil heaps, vehicles and machinery on or near the ROW
Vegetation encroachment
Multispectral (NDVI, NDRE)
Tree growth and root zones that block access or threaten the pipe
Ground subsidence and landslides
InSAR (L-band and C-band)
Millimetre ground movement over time, before strain damages the pipe
Erosion and river scour at crossings
Optical, SAR, DEM
Bank retreat, exposed pipe and channel changes after high flows
Oil leaks and spills
SAR backscatter, multispectral
Dark smooth patches on water, stained soil and dead vegetation
Thermal and gas anomalies
Thermal infrared, shortwave infrared
Hot spots, flares and gas release signals at facilities and valve stations
Floods and storms
SAR (day, night, any weather)
Flood extent over the route mapped even under storm cloud
Satellites Used for Oil and Gas Pipeline Right-of-Way Monitoring
Long linear corridors need two kinds of satellite: high resolution optical for visual detail, and radar that keeps watching when weather or darkness blocks cameras. XRTech Group supplies both from a fleet of more than 130 satellites.
Satellite
Type and resolution
Role in ROW monitoring
SuperView Neo-1
Optical, 0.25 m to 0.3 m
Detailed inspection of facilities, crossings and encroachment
SuperView-1
Optical, 0.5 m
Routine corridor coverage and change detection
SuperView Neo-3
Optical, 0.5 m, 130 km swath
Wide area corridor census in fewer passes
GF-3
C-band SAR, 1 m Spotlight
All-weather imaging and InSAR ground movement
LT-1
L-band SAR, 3 m
InSAR through vegetation for subsidence and landslides
SuperView Neo-2
X-band SAR, 0.5 m
Detailed day and night radar imaging of the ROW
The SuperView Neo system of 28 satellites can revisit a site up to 25 times per day, and its corridor acquisition modes scan long linear assets in a single orbital pass. See SAR satellite imagery and our 30 cm satellite imagery for sensor details, and our guide to whether satellites can see through clouds.
Automated Change Detection: Encroachment and Unauthorised Construction
Third-party activity is one of the leading causes of oil and gas pipeline damage. XRTech Group AI models compare every new image of the corridor with the historical baseline and classify land use changes inside the pipeline buffer zone:
- Unauthorised earthworks and excavation close to the buried line
- Heavy machinery and vehicle movement on or across the ROW
- Illegal road building and new access tracks
- Structural encroachment: new houses, sheds, walls, fences and farm buildings
Each change is flagged against the baseline and sent as a spatial alert with GPS coordinates, so maintenance teams go straight to the right kilometre point.
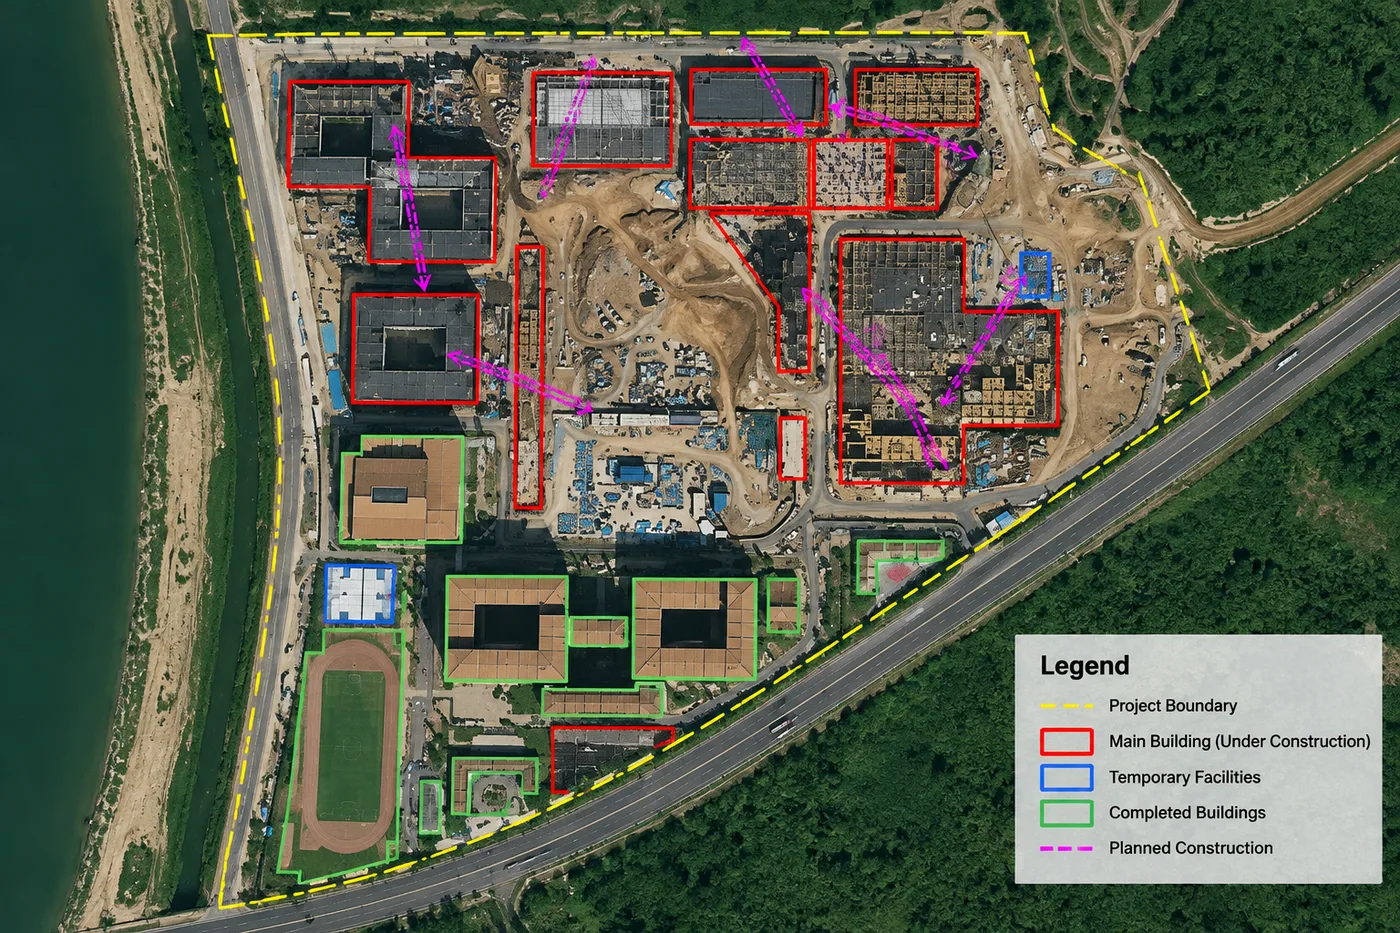
AI change detection on high resolution satellite imagery: inside the project boundary, structures are classified as completed, under construction, temporary or planned. The same method flags new construction in a pipeline buffer zone.
Vegetation and Clearance Monitoring with NDVI and NDRE
Trees and deep roots along a ROW block aerial and ground access and can damage coatings on buried pipe. Multispectral vegetation indices such as NDVI and NDRE (normalised difference red edge) measure vegetation growth along every kilometre, so operators can schedule clearance where it is needed instead of cutting the whole corridor on a fixed cycle.
InSAR Ground Movement and Pipeline Integrity Monitoring
Oil and gas pipelines fail when the ground around them moves. InSAR (interferometric SAR) compares radar images of the same place over time and measures ground surface movement down to 1 to 2 mm. XRTech Group uses L-band (LT-1) and C-band (GF-3) InSAR pairs to:
- Measure subsidence from mining, groundwater pumping or soft soils
- Detect landslides and slope instability on hillside sections
- Track erosion at river and wadi crossings
- Identify soil displacement around buried pipe that can cause bending and stress before it leads to a rupture or leak
Digital elevation models add the terrain context: slope, drainage and landslide prone ground along the route. See our DEM services.
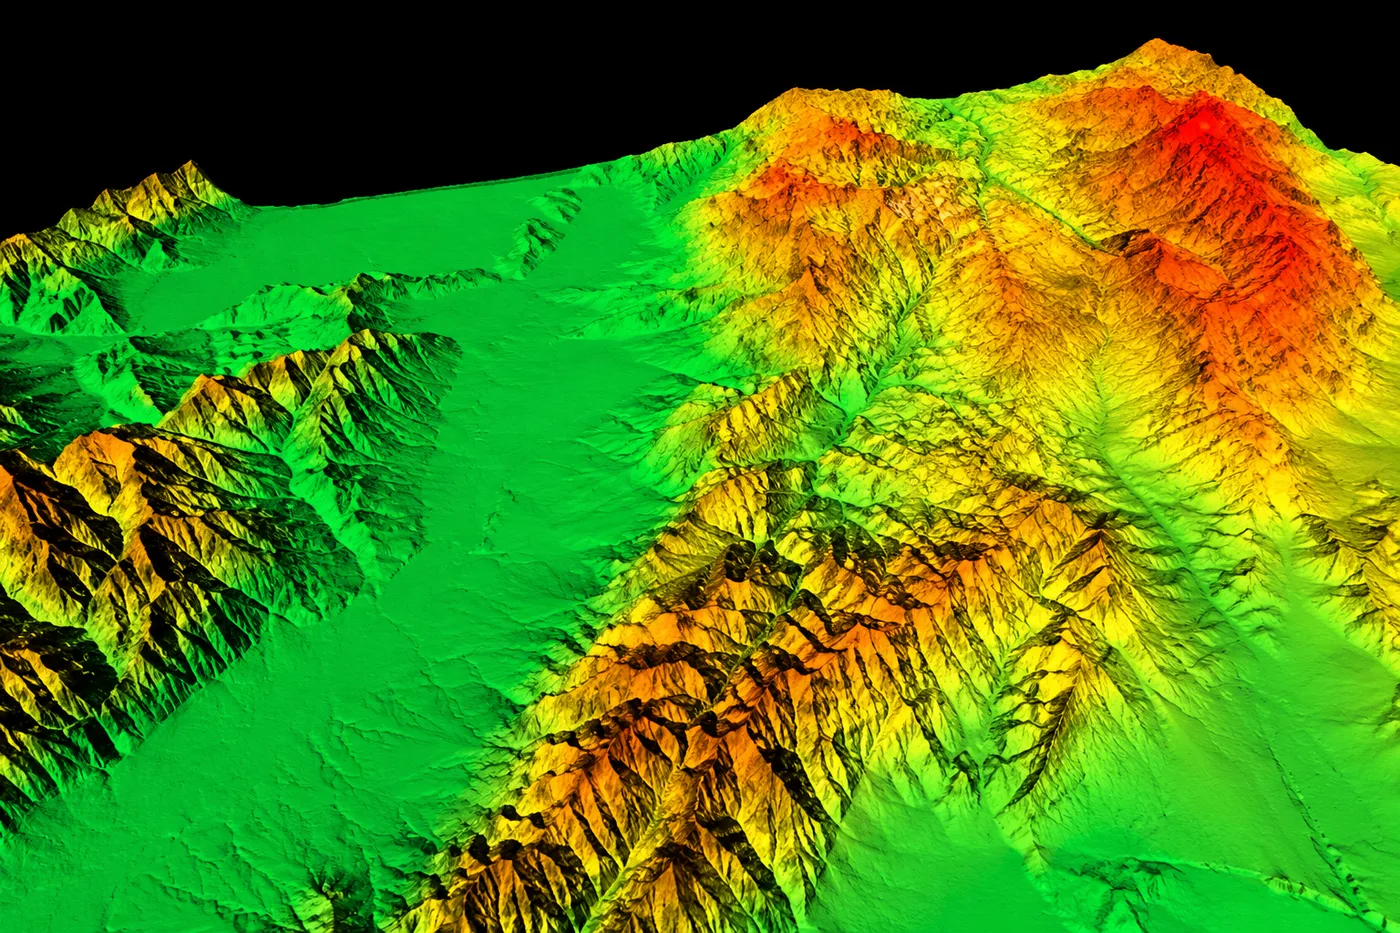
A satellite digital elevation model of mountain terrain. Slope and relief data show where pipeline sections face landslide and erosion risk.
Oil and Gas Leak, Spill and Environmental Event Detection
Satellites detect the environmental signs of an oil or gas leak around the pipeline, at river crossings and at coastal terminals:
- SAR oil spill detection: oil smooths the water surface, so spills appear as dark patches in SAR backscatter, day or night. See SAR oil spill detection.
- Soil and vegetation staining: multispectral sensors pick up stained ground and stressed vegetation near the line.
- Thermal and gas anomalies: infrared and shortwave infrared sensors monitor hot spots and greenhouse gas releases at operational facilities and valve stations.
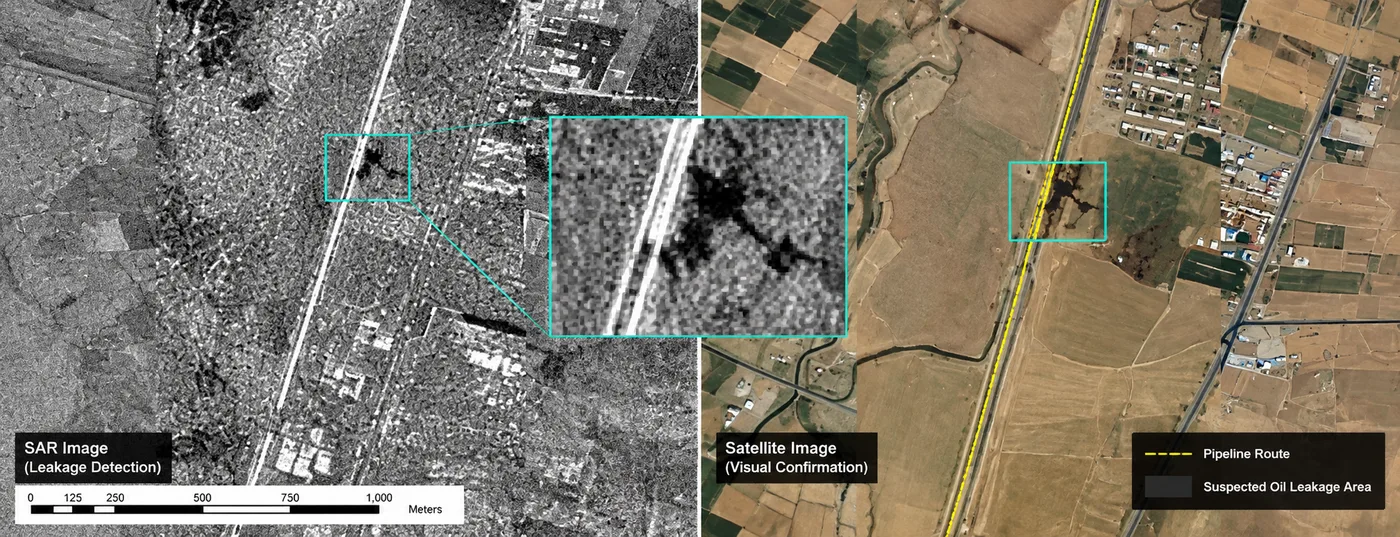
Leak detection along a pipeline route: the SAR image (left) shows a suspected oil leakage area as a dark patch, and high resolution optical imagery (right) confirms it beside the pipeline.
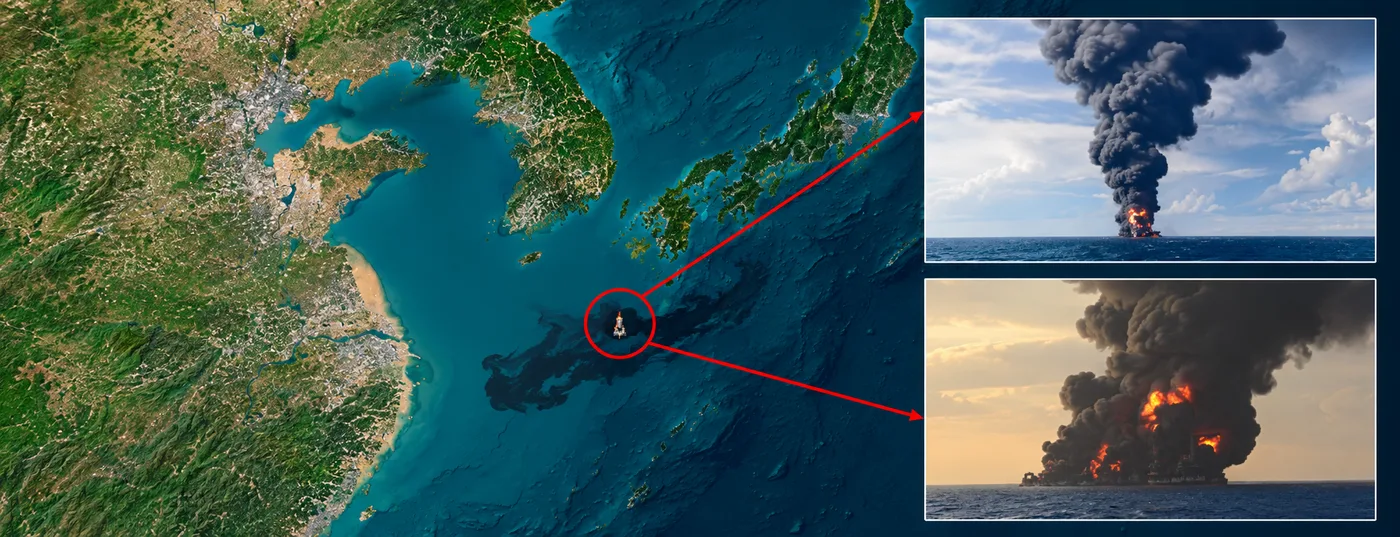
Environmental event monitoring: satellite imagery tracks an oil slick spreading from a burning tanker at sea, the kind of event that also threatens coastal terminals and subsea lines.
Emergency Response: Floods, Storms and Night-Time Events
When a flood, storm or landslide hits the corridor, SAR satellites image the route through cloud and darkness. XRTech Group maps flood extent over the pipeline, finds exposed or washed out sections and supports emergency satellite imagery delivery within 24 hours.
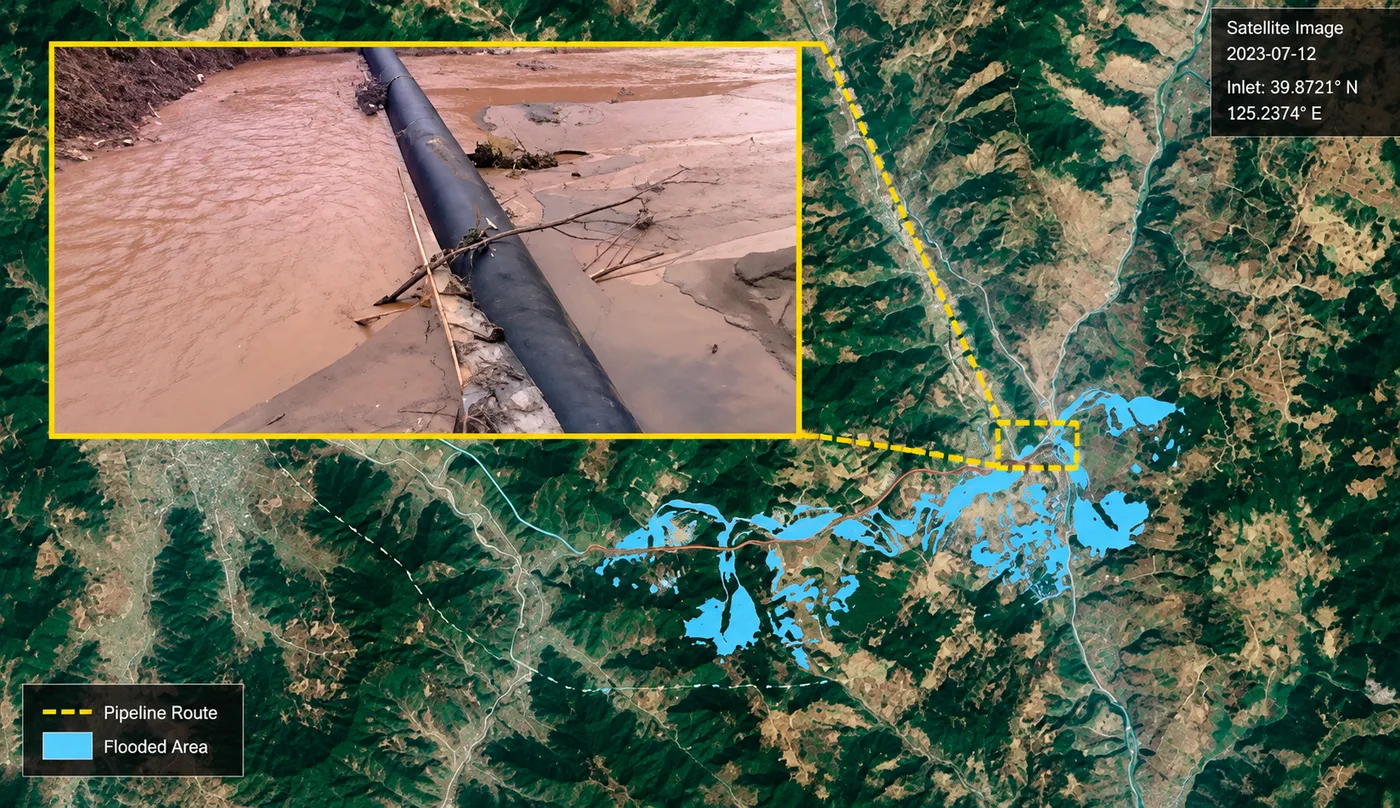
Flood inundation mapped over a pipeline route in a river valley, with a ground photo of the exposed pipe in floodwater. Satellite flood maps show which sections need inspection first.
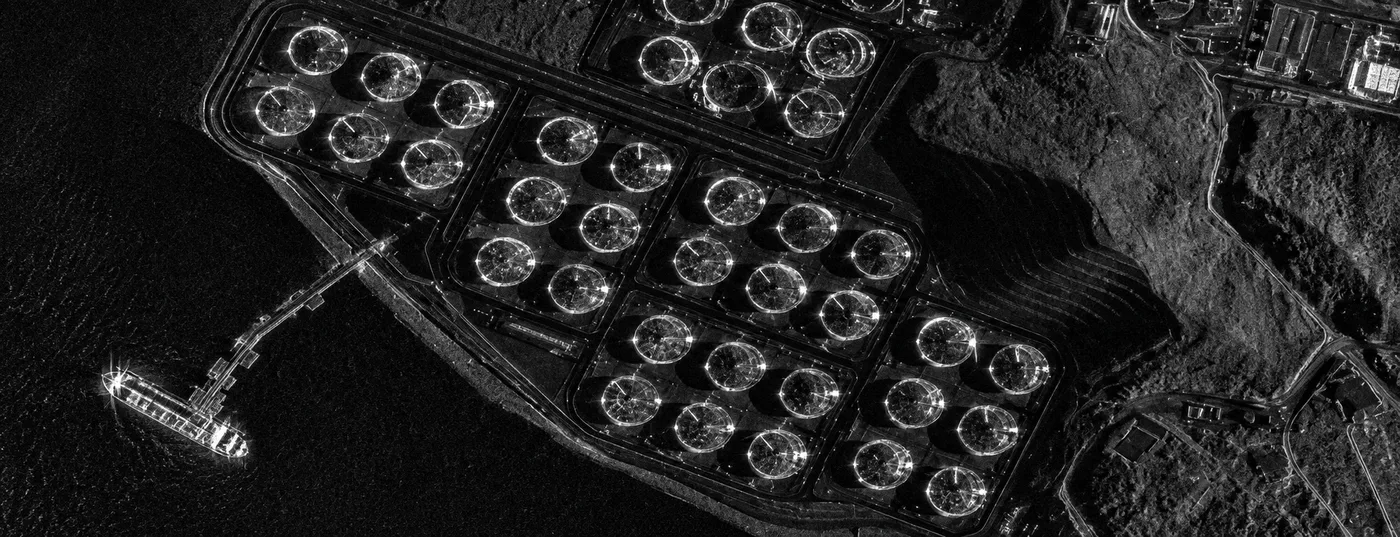
Night-time SAR image of an oil tank farm and a tanker at the jetty. Radar keeps facilities under watch through cloud, rain and darkness.
Monitoring Oil and Gas Facilities: Tank Farms, Terminals and Ports
ROW monitoring also covers the assets the pipeline connects: pump and valve stations, tank farms, terminals and ports. High resolution satellite imagery with AI detection counts storage tanks, tracks tanker traffic and watches for new activity around each site. Shadow analysis on floating roof tanks estimates fill levels.
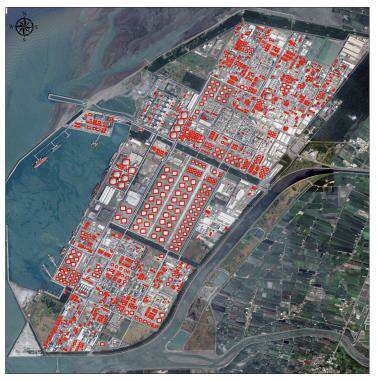
AI detection of every storage tank in a coastal oil terminal (highlighted in red). Tank inventories and shadow analysis track facility activity over time.
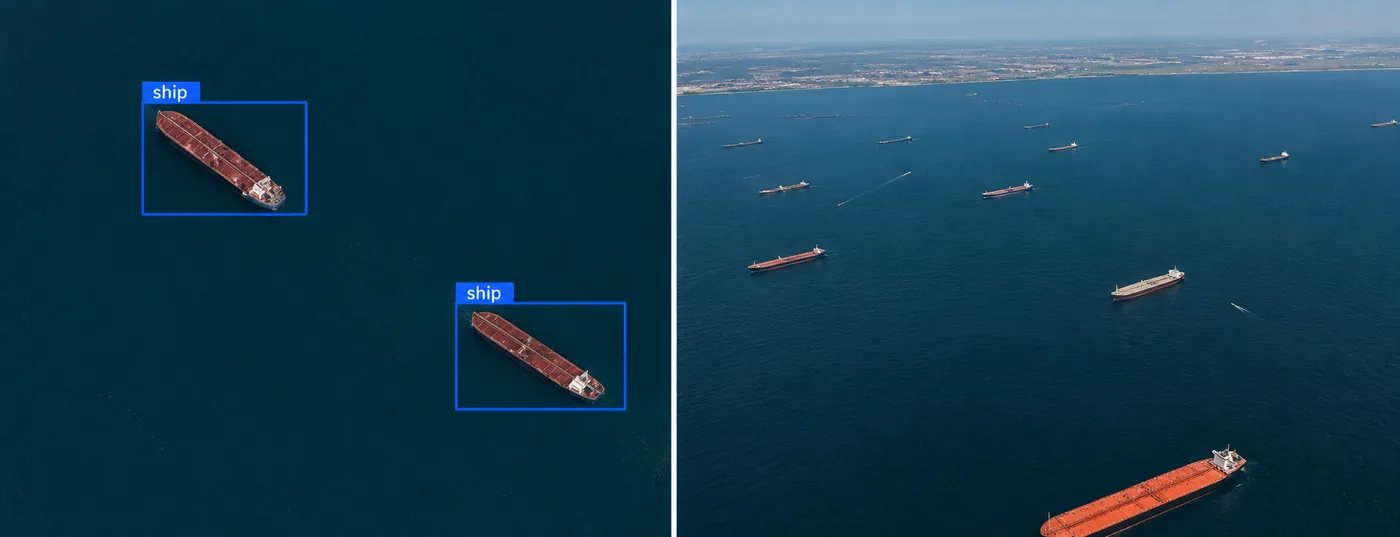
AI ship detection on high resolution satellite imagery identifies oil tankers at a port anchorage, part of monitoring the terminals a pipeline serves.
Monitoring Frequency, Alerts and Deliverables
Monitoring frequency is set by risk. High consequence areas such as river crossings, towns and landslide zones can be imaged daily or weekly; remote low risk sections monthly. InSAR stacks are updated on each radar revisit. Typical deliverables:
- Change alerts with GPS coordinates, kilometre point, before and after images and a risk level
- GIS layers of changes, encroachments and ground movement in shapefile, KML and GeoTIFF
- InSAR displacement maps and time series for each monitored section
- Periodic corridor reports summarising threats, trends and actions
You can also follow upcoming satellite passes over your corridor with our free live satellite tracking tool.
Satellite vs Ground and Aerial Patrols for Oil and Gas Pipelines
Factor
Satellite monitoring
Ground patrol
Aerial patrol
Coverage
Entire ROW and buffer zone every pass
Sections reachable by road or foot
Corridor along the flight line
Weather and night
SAR works in cloud, rain and darkness
Limited by weather and safety
Grounded by bad weather
Ground movement
InSAR to 1 to 2 mm
Not visible
Not measurable
Remote or unsafe areas
No access needed
Difficult or risky
Needs permits and airspace
Records
Dated archive for audits and claims
Patrol notes
Photos and video
Most oil and gas operators combine them: satellites watch the whole corridor and decide where patrols go first.
How XRTech Group Helps With Oil and Gas Pipeline Monitoring
XRTech Group is a satellite imagery and geospatial analytics provider that monitors pipelines, facilities and corridors for oil and gas operators. It delivers the full requirement in one service:
- Multi-sensor coverage: sub-metre optical (0.25 m to 0.5 m) and all-weather SAR (X, C and L band) from more than 130 satellites.
- High revisit: up to 25 revisits per day from the SuperView Neo system, with corridor modes for long linear assets.
- AI change detection: encroachment, construction, machinery and vegetation changes flagged against your baseline.
- InSAR integrity monitoring: subsidence, landslides and soil movement measured to 1 to 2 mm.
- Leak and environmental events: SAR oil spill detection, thermal and gas anomaly monitoring.
- Actionable alerts: GPS located alerts, GIS layers and reports for field teams, with emergency delivery within 24 hours.
Need imagery only? You can buy satellite imagery of any section as archive or new tasking.
Monitor Your Oil and Gas Pipeline From Space
Send your oil or gas pipeline route as KML, KMZ or shapefile. XRTech Group will propose the sensors, revisit schedule, change detection and InSAR setup for your ROW, facilities and surrounding area.
Frequently Asked Questions
Can satellites monitor a pipeline Right-of-Way?
Yes. Satellites image the whole pipeline ROW, its facilities and the surrounding area on a regular schedule. XRTech Group combines sub-metre optical imagery, all-weather SAR, AI change detection and InSAR to flag encroachment, construction, vegetation growth, ground movement, floods and leaks early.
How do oil and gas companies monitor pipelines with satellites?
Oil and gas companies use satellites to watch the full pipeline Right-of-Way, pump and valve stations, tank farms and terminals. High resolution optical imagery and SAR are processed with AI change detection and InSAR, so encroachment, ground movement, floods and leaks are flagged with GPS coordinates. XRTech Group provides this as a complete monitoring service.
How does satellite change detection work for pipelines?
AI models compare each new satellite image of the corridor with a historical baseline. New buildings, roads, earthworks, machinery and vegetation changes inside the buffer zone are flagged as alerts with GPS coordinates for field teams.
Can satellites detect pipeline leaks?
Satellites detect the signs of leaks: oil slicks on water in SAR imagery, stained soil and stressed vegetation in multispectral data, and thermal or gas anomalies at facilities. Suspected leaks are then confirmed with high resolution optical imagery and ground checks.
What is InSAR pipeline monitoring?
InSAR compares radar images over time to measure ground movement down to 1 to 2 mm. For pipelines, it reveals subsidence, landslides and soil displacement around buried pipe before strain causes damage.
Can satellites monitor pipelines at night and through clouds?
Yes. SAR radar satellites send their own microwave signal, so they image the ROW through cloud, rain, fog, smoke and darkness. Optical satellites add sharp visual detail when skies are clear.
How often can a pipeline be monitored by satellite?
As often as the risk requires. The SuperView Neo system can revisit a site up to 25 times per day. Most operators image high risk sections daily or weekly and remote sections monthly.
What resolution is needed for pipeline ROW monitoring?
Sub-metre optical imagery, 0.25 m to 0.5 m, is used to see machinery, excavation and small structures. SAR at 0.5 m to 3 m adds all-weather coverage and InSAR ground movement.
Who provides satellite oil and gas pipeline monitoring?
XRTech Group provides satellite oil and gas pipeline monitoring that combines high resolution optical imagery, SAR, AI change detection, InSAR and leak detection for pipelines, facilities and surrounding areas, with GPS located alerts for field teams.
Related guides: satellite imagery for oil and gas, SAR oil spill detection, SAR vs InSAR and emergency satellite imagery.
Sources
- U.S. Pipeline and Hazardous Materials Safety Administration (PHMSA): pipeline damage prevention and right-of-way guidance
- European Space Agency: InSAR and Sentinel-1 ground motion services
- NASA Earthdata: What is synthetic aperture radar
- U.S. Geological Survey: Landsat vegetation indices (NDVI)