Quick Answer: An image is a single visual snapshot of a location captured by a camera, satellite, or sensor. Imagery is the broader technical category covering the full dataset behind those captures, including spectral bands, metadata, processing levels, and analytical depth beyond what the human eye can see. In geospatial and remote sensing work, satellite imagery includes optical, SAR, infrared, and hyperspectral data. A satellite image is the specific deliverable you buy, view, or publish. The distinction matters because imagery drives analysis while images drive display.
Intro
The words “image” and “imagery” appear together constantly in geospatial work. Most people use them as if they mean the same thing. In casual conversation, that is fine. In technical procurement, project planning, or GIS analysis, the distinction matters because it affects what you are ordering, what format you receive, and what you can do with the data.
What Is an Image?
An image is a single visual capture: a discrete file containing pixel data for a specific location at a specific point in time. It is the most familiar form of remotely sensed data.
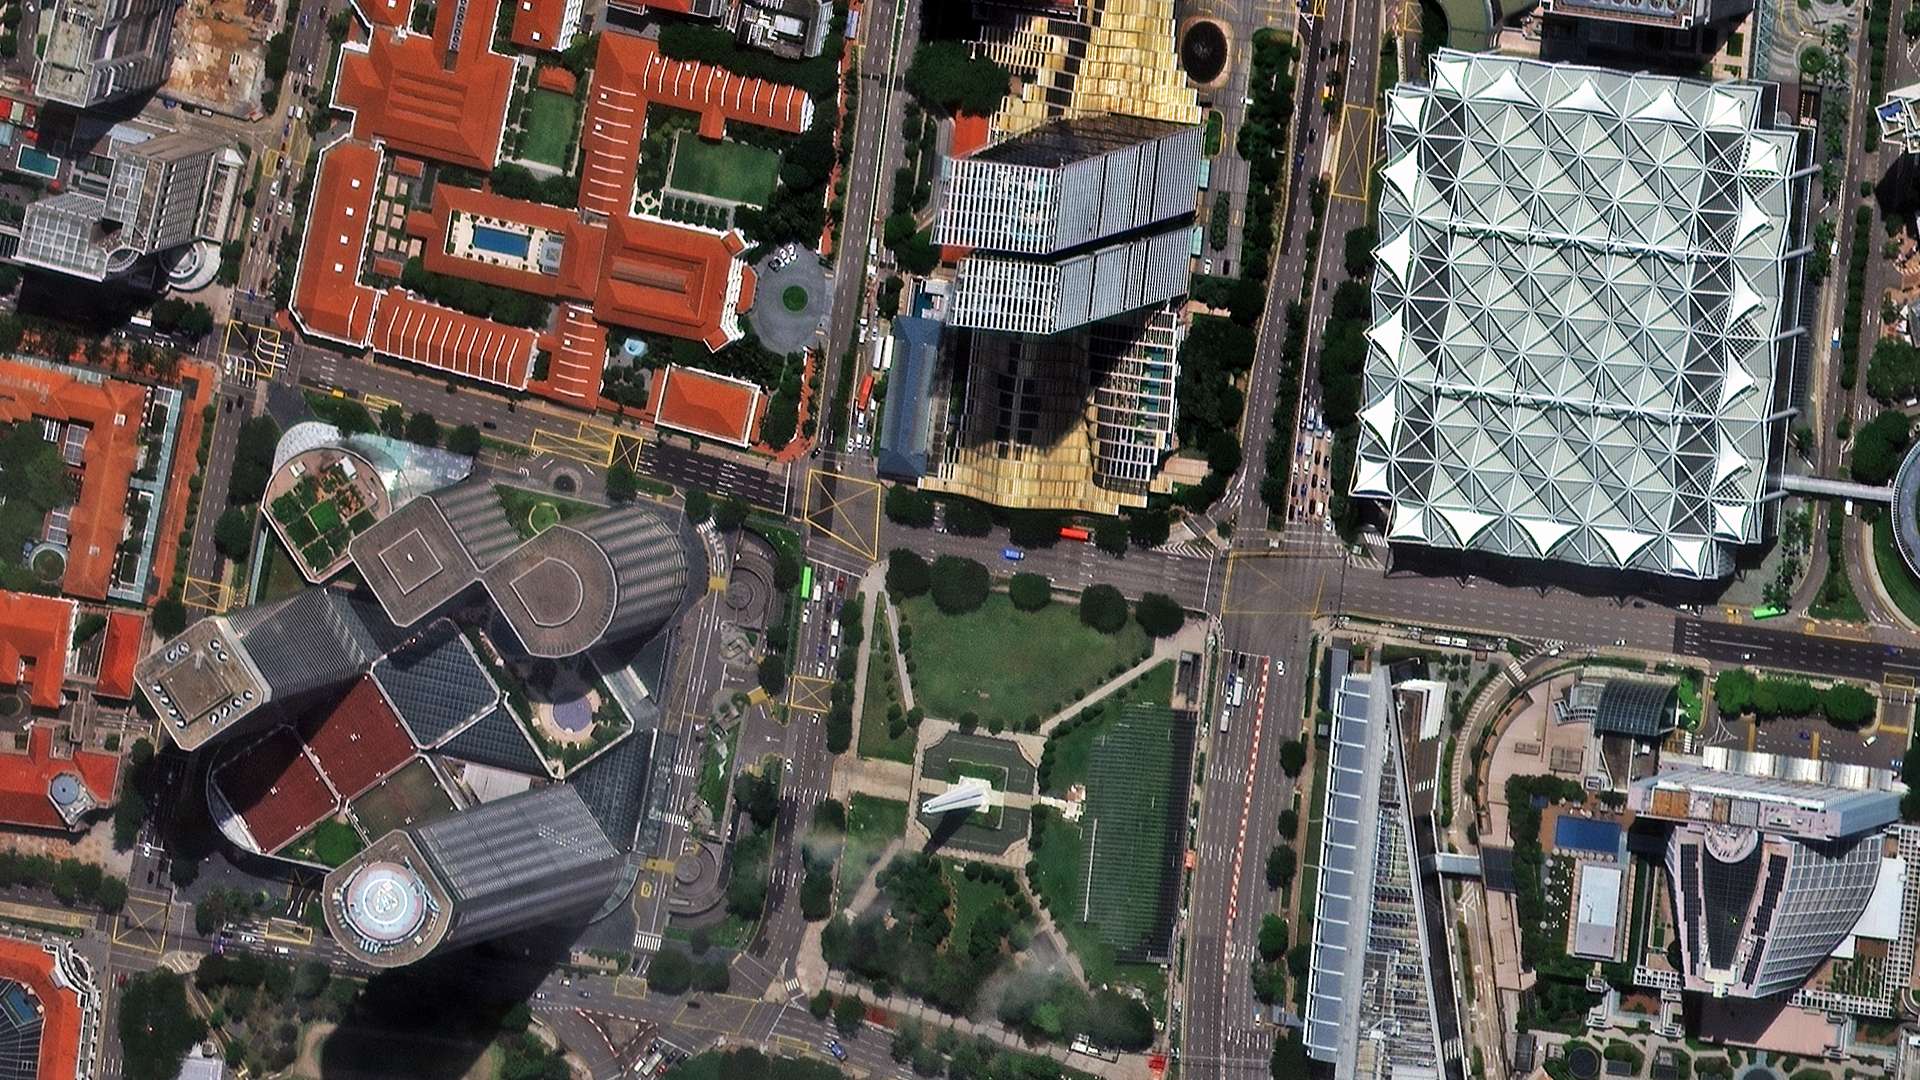
A satellite image of Dubai from 15 March 2025 is one image. It has a defined footprint, a capture date, a resolution, and a processing level. It shows what the sensor recorded at that moment.
In geospatial and GIS work, images are typically raster files where each pixel corresponds to a specific location on the Earth’s surface. Each pixel contains a value representing reflectance, elevation, temperature, or another measurable property depending on the sensor type.
Images are the transactional unit in satellite data procurement. When you order from XRTech, you buy archive images (captured more than 90 days ago) or new tasking images (freshly captured on a date you specify). The image is the deliverable: a GeoTIFF, IMG, or similar file that loads directly into GIS software.
What Images Are Used For
- Visual site identification: confirming the location, layout, and current state of a specific place
- Media and publication: imagery scaled to 8-bit RGB for use in reports, presentations, and news media
- Base map creation: a georeferenced visual layer for GIS platforms
- Object detection: locating vehicles, buildings, infrastructure, and other visible features at a specific date
What Is Imagery?
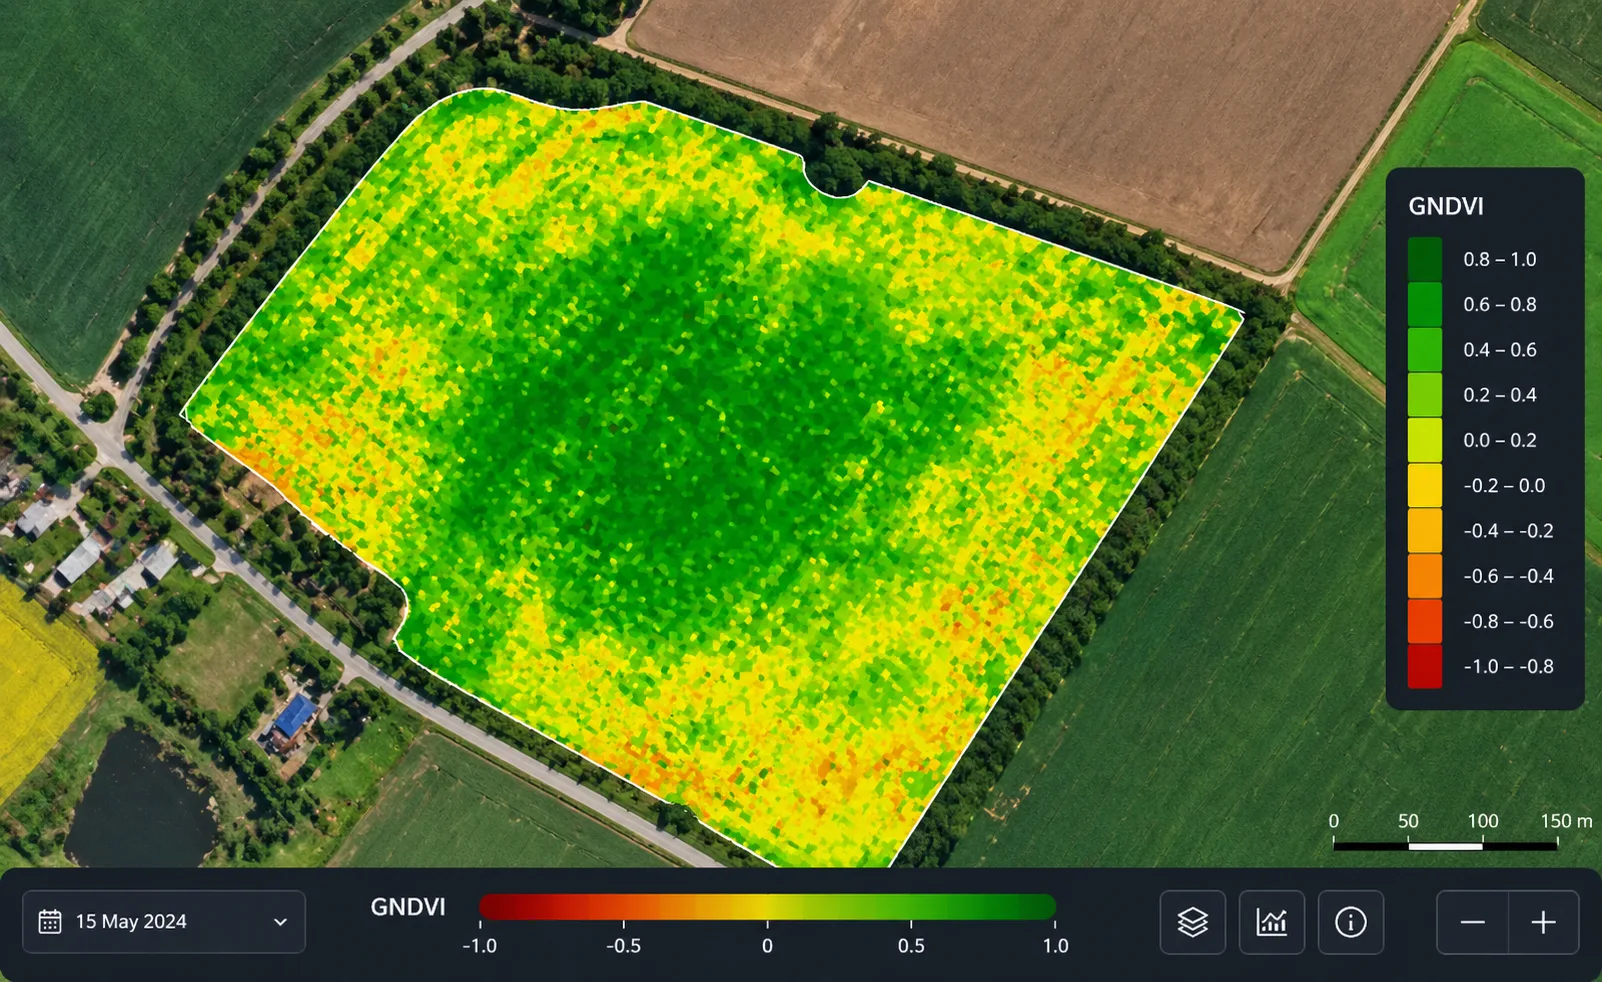
Imagery is the broader technical category. It refers not just to the visual output but to the full dataset captured by a sensor, including all spectral bands, metadata, processing history, and analytical layers that go far beyond what the human eye can see.
When a geospatial professional says “satellite imagery,” they mean the complete data product: the spectral bands, the radiometric calibration, the geometric corrections, and the analytical information embedded in every pixel. That data product may include near-infrared bands that reveal vegetation health, shortwave infrared bands that detect soil moisture and mineral composition, or radar backscatter that measures surface roughness and detects subsidence.
None of that is visible in a standard RGB image. All of it is part of the imagery dataset.
What Is Geospatial Imagery?
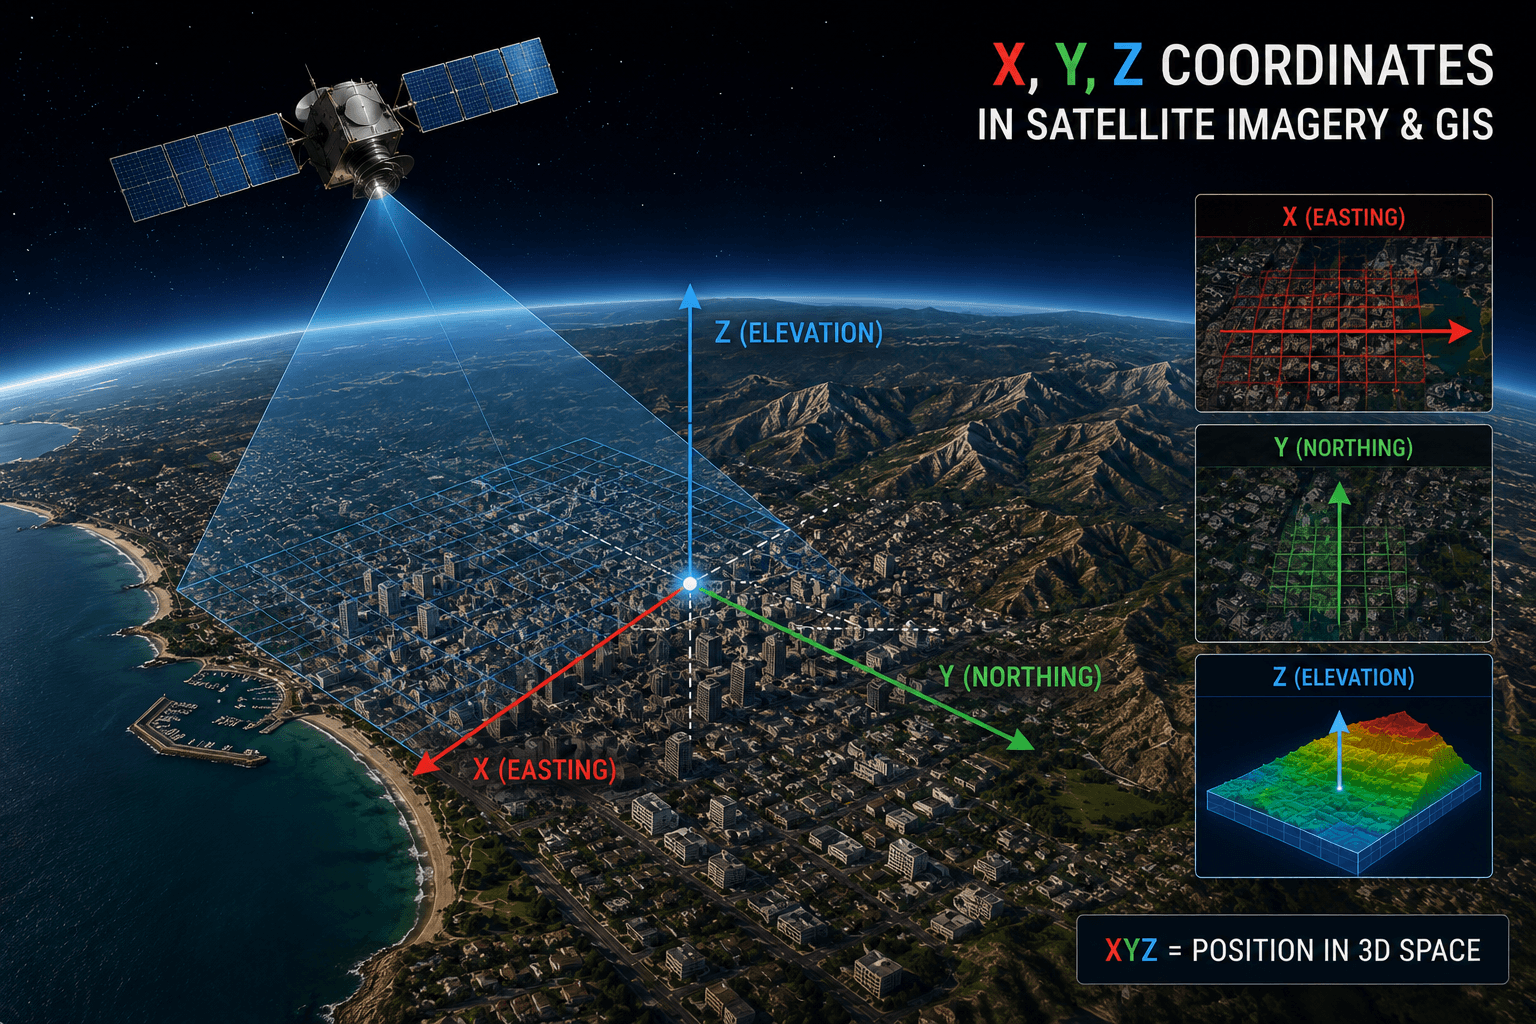
Geospatial imagery is remotely sensed data that is georeferenced: every pixel is tied to a precise coordinate on the Earth’s surface. It is the foundation of GIS analysis, environmental monitoring, urban planning, disaster management, and precision agriculture.
Geospatial imagery is collected using different sensor types, each capturing a different part of the electromagnetic spectrum or measuring a different physical property:
| Sensor Type | What It Captures | Primary Use |
|---|---|---|
| Optical (multispectral) | Visible and near-infrared light in 4 to 13 bands | Vegetation health, land cover, change detection |
| Panchromatic | Single broad visible band at highest spatial resolution | Fine structural detail, high-resolution basemaps |
| Hyperspectral | Hundreds of narrow bands from 400nm to 2500nm | Mineral mapping, pollution detection, species identification |
| Thermal infrared | Heat emitted by surfaces | Urban heat mapping, fire detection, industrial monitoring |
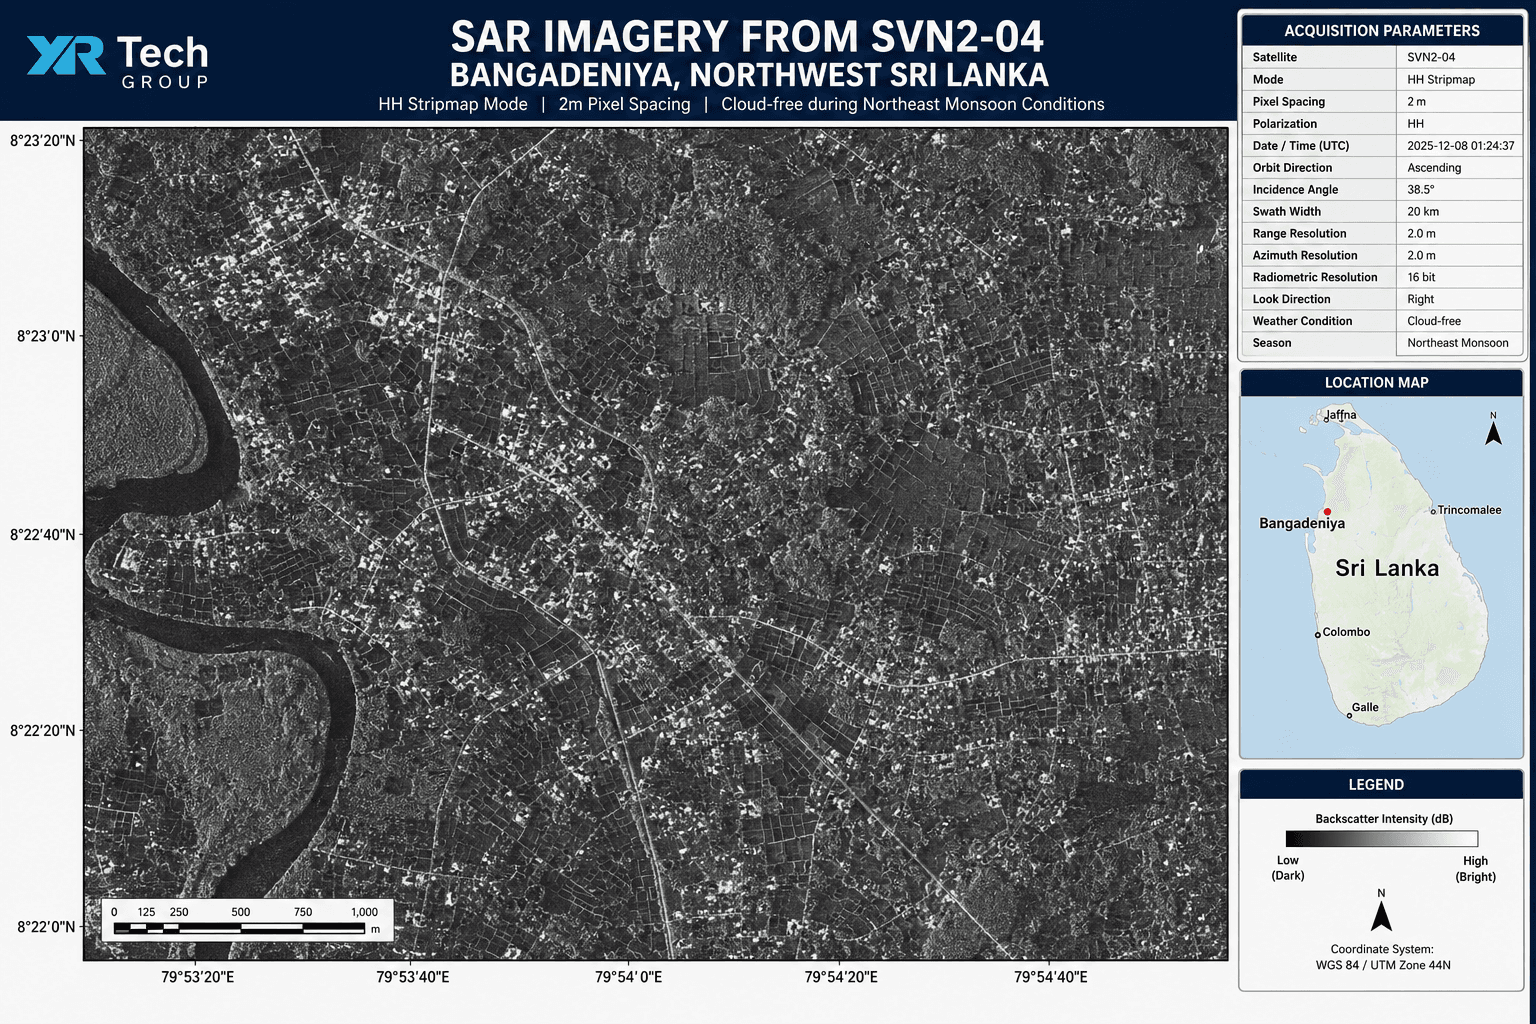
| SAR (Synthetic Aperture Radar) | Microwave radar backscatter, day and night, all weather | Flood mapping, deformation detection, maritime surveillance |
| Lidar | Laser pulses measuring precise elevation | Bare-earth DEMs, forest canopy height, 3D city models |
Geospatial imagery from these sensor types is used for land cover classification, change detection, environmental monitoring, urban planning, disaster management, and scientific research. It is the data that drives decisions, not just the visual that supports a presentation.
What Is Aerial Imagery?
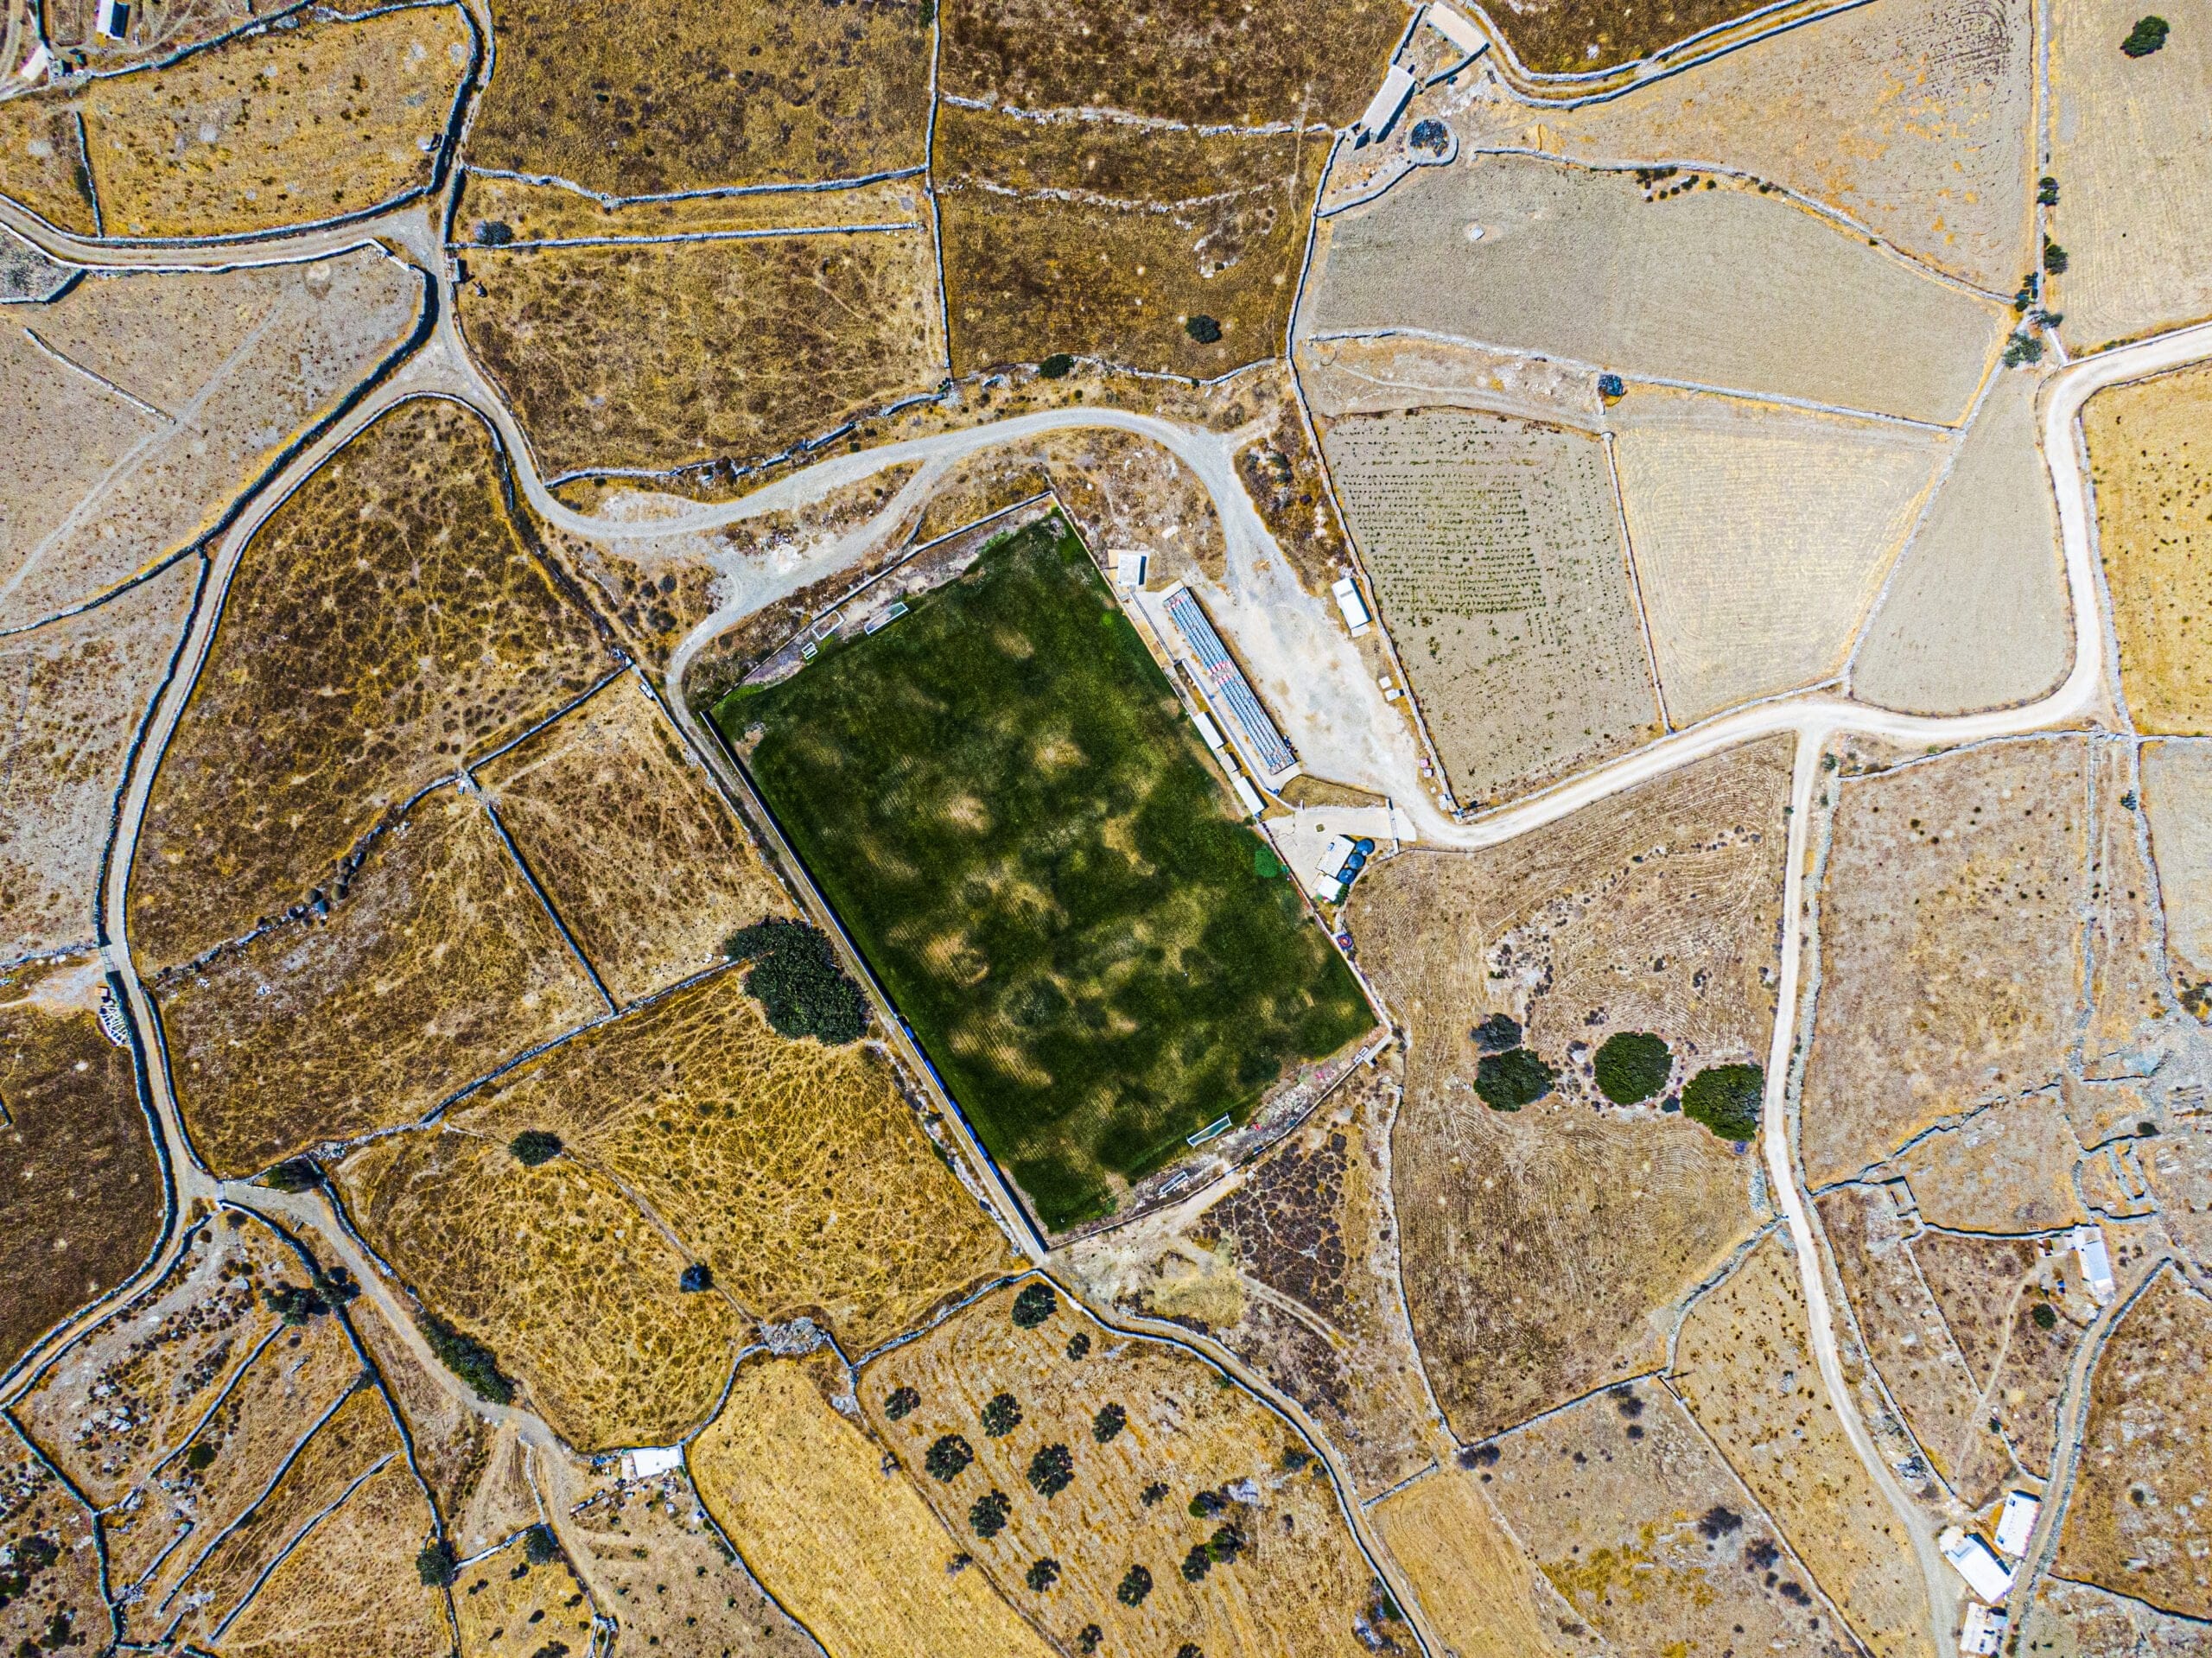
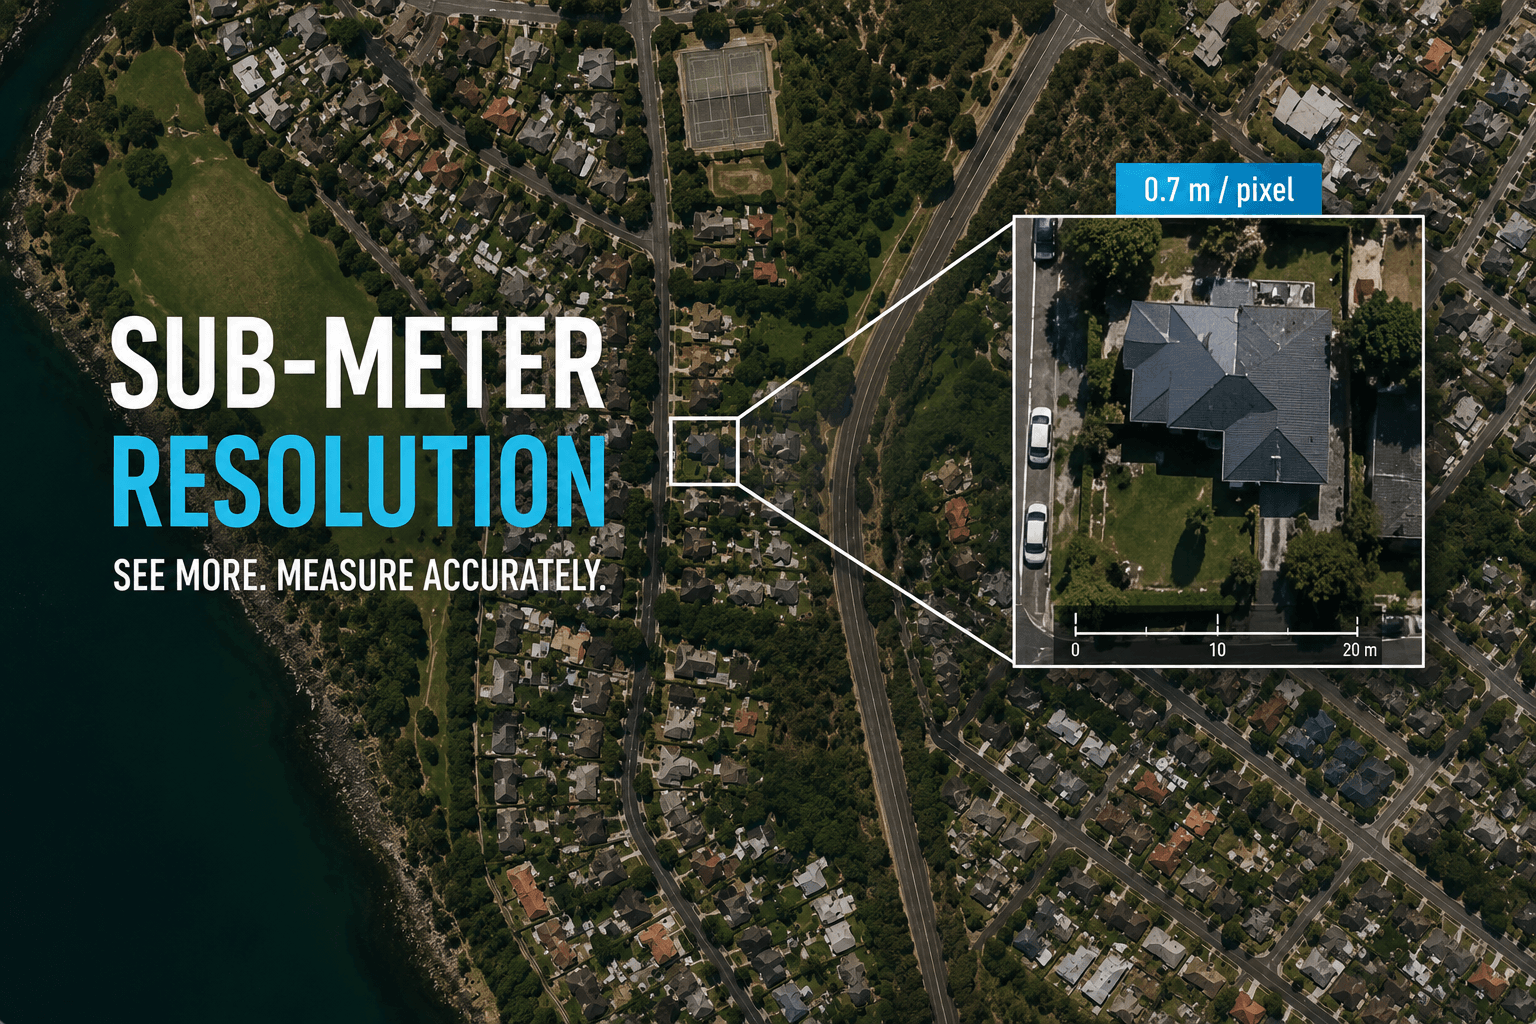
Aerial imagery is remotely sensed data captured from aircraft, helicopters, or drones at altitudes far lower than satellites. Because the sensor is closer to the ground, aerial imagery can achieve finer Ground Sample Distance (GSD), often 5cm to 30cm, compared to the 25cm to 2m range of commercial satellites.
Aerial Imagery Definition
Aerial imagery is any remotely sensed image captured from an airborne platform rather than a ground-based or space-based sensor. It includes vertical aerial photography taken straight down, oblique imagery taken at an angle to show building facades and terrain relief, and drone imagery captured from UAVs at low altitude for site-level work.
Aerial Imagery vs Satellite Imagery
| Feature | Aerial Imagery | Satellite Imagery |
|---|---|---|
| Platform | Aircraft, helicopter, drone | Orbiting satellite |
| Typical GSD | 5cm to 30cm | 0.3m to 50m |
| Area coverage | Small to medium, requires flight | Global, any location on demand |
| Frequency | Scheduled flight campaigns | Daily revisit available |
| Weather dependency | Cannot fly in bad weather | SAR satellites unaffected by cloud |
| Cost model | Per flight hour plus mobilisation | Per km2, archive or tasking |
| Best for | Precise site-level surveys | Large area monitoring and analysis |
Aerial imagery is the right tool for small areas requiring centimetre-level GSD. Satellite imagery is the right tool for any project covering more than a few hundred hectares or requiring repeat coverage without field mobilization.
What Is Hybrid Imagery?

Hybrid imagery combines data from two or more sensor types to produce a dataset with more information and analytical depth than either source alone.
In the context of Google Maps, “hybrid” refers to the satellite imagery layer with road names and labels overlaid on top. That is the most common consumer definition of hybrid imagery: a visual combination of satellite photo and vector map data.
In professional remote sensing and geospatial imaging, hybrid imagery has a more specific meaning: the fusion of different sensor datasets to extract information that no single sensor can provide independently.
Examples of Professional Hybrid Imagery
- Optical and SAR fusion: Combining optical VHR imagery from SuperView Neo-1 at 0.3m with SAR data from GF-3 produces a dataset where the optical provides visual detail and the SAR provides all-weather surface geometry and deformation data. Together, they give a complete picture of infrastructure condition that neither sensor alone can deliver.
- Panchromatic and multispectral pan-sharpening: A panchromatic image has higher spatial resolution but no spectral information. A multispectral image has spectral bands but lower spatial resolution. Pan-sharpening fuses both to produce an image that has both the sharp detail of the panchromatic and the spectral richness of the multispectral.
- Lidar and optical fusion: Lidar provides precise elevation measurements. Optical imagery provides photographic detail. Fused together, the result is a georeferenced 3D model with photorealistic surface texture and engineering-grade vertical accuracy.
XRTech provides hybrid imagery products through SAR and optical fusion for infrastructure monitoring, flood mapping, and 3D terrain modelling.
What Is Geospatial Imaging?
Geospatial imaging is the full process of capturing, correcting, processing, and delivering remotely sensed data in a format that is tied to real geographic coordinates and ready for GIS and analytical workflows.
It covers:
- Capture: The satellite, aircraft, or drone collects raw data using its sensor, recording the electromagnetic energy reflected or emitted by the Earth’s surface.
- Radiometric correction: Raw sensor values are converted to physically meaningful measurements of reflectance or backscatter, removing sensor-specific noise and calibration offsets.
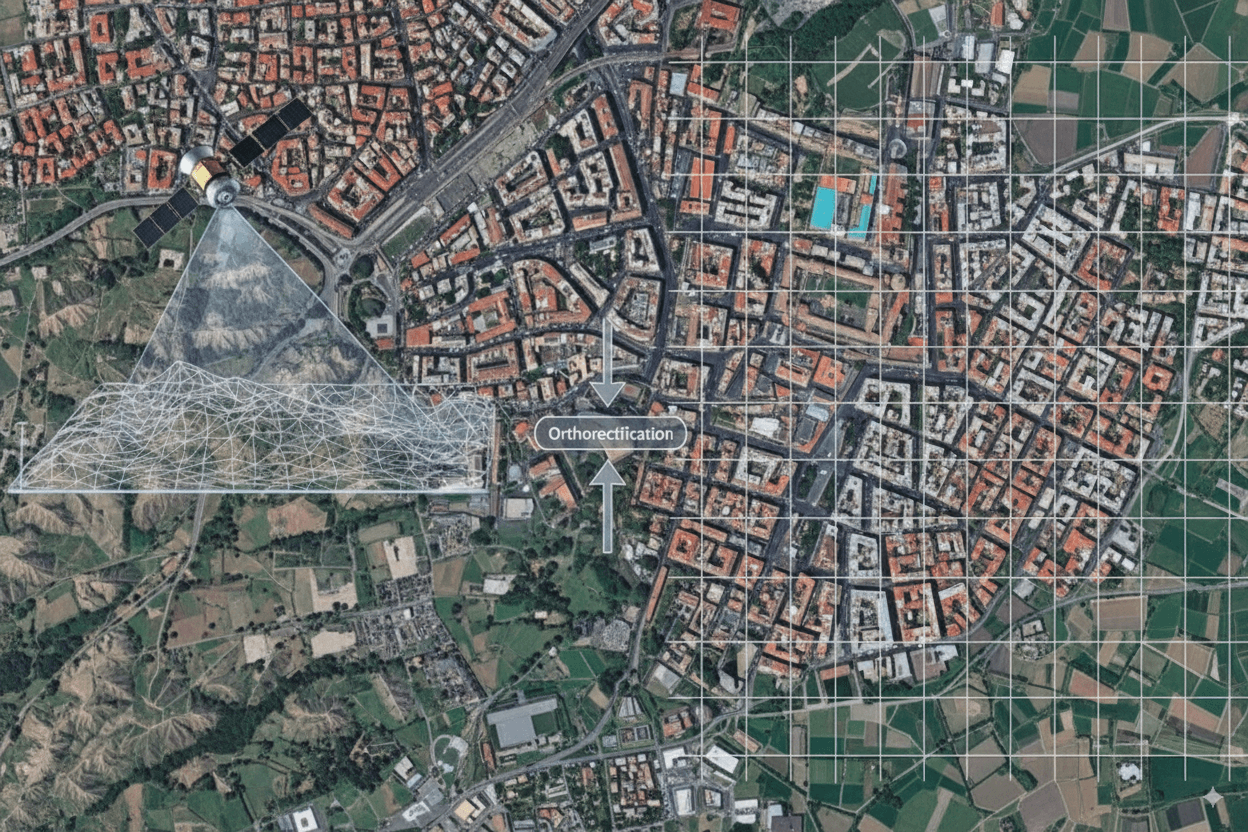
- Geometric correction: The image is corrected for distortions caused by the Earth’s curvature, terrain relief, and the sensor’s viewing angle. This is orthorectification: the process that makes every pixel correspond to its true ground coordinate.
- Atmospheric correction: Haze, aerosols, and atmospheric water vapour are removed to restore true surface reflectance. This is essential for multispectral analysis and spectral index calculations.
- Mosaicking: Multiple scenes are stitched together into a seamless coverage layer for large areas.
- Delivery: The final product is delivered in GIS-compatible formats (GeoTIFF, IMG, SHP, DWG) at the correct coordinate reference system for the project.
Geospatial imaging is what transforms a raw sensor reading into a usable data product. It is the difference between a blurry, distorted scene and an orthorectified, analysis-ready image that loads correctly into QGIS, ArcGIS, or AutoCAD on the first try.
What Is a Sensing Image?
A sensing image is any image produced by a remote sensing device. Remote sensing is the science of collecting data about an object or area from a distance, without physical contact.
Every satellite image, aerial photograph, lidar point cloud, and radar scene is a sensing image. The sensor detects electromagnetic radiation (light, heat, microwave energy) reflected or emitted by the Earth’s surface and records it as a digital file.
Sensing images are classified by the part of the electromagnetic spectrum they capture:
Ordering the wrong category means getting data that cannot do what your project needs. An imagery order gives you analytical depth. An image order gives you a visual deliverable. A map order gives you a seamless spatial reference layer.
XRTech Imagery by Sensor Type
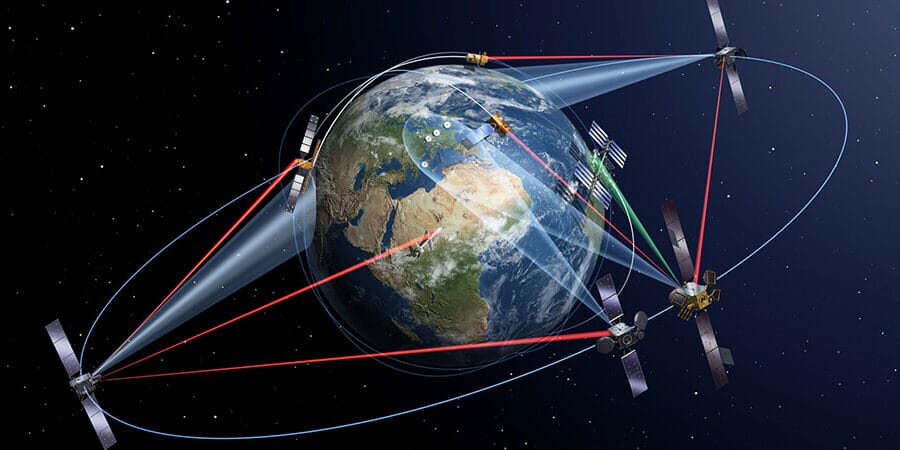
XRTech provides geospatial imagery across all major sensor types from a constellation of over 130 satellites.