What Is Sub-Meter? A Complete Guide to Sub-Meter Resolution in Satellite Imagery

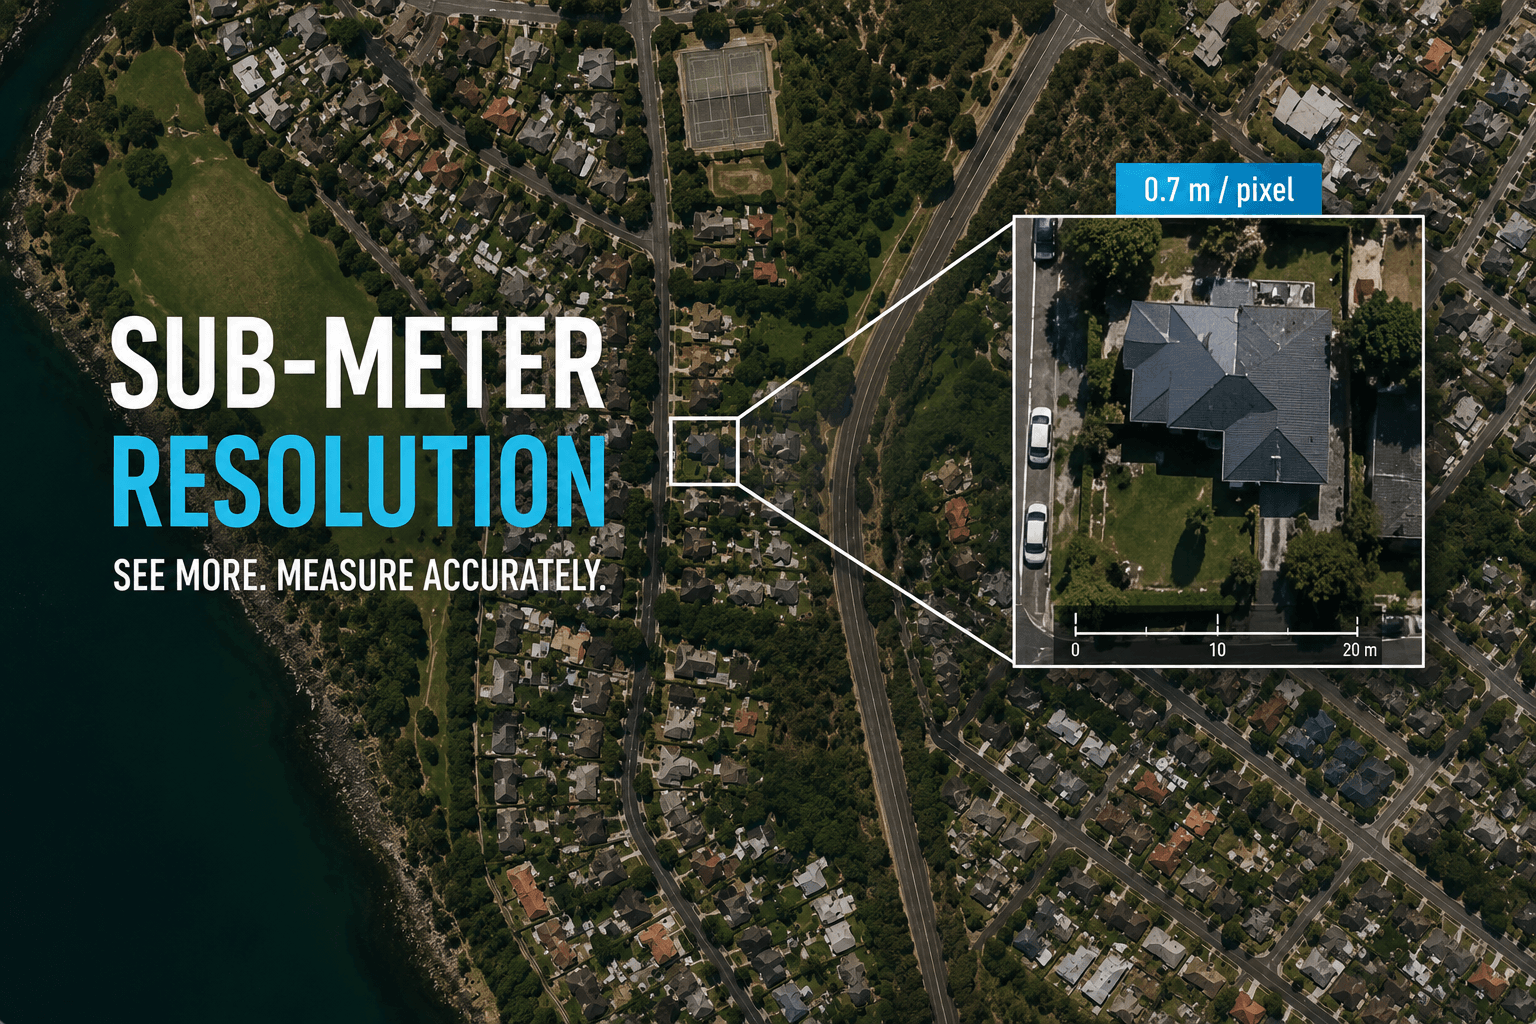
Quick Answer: Sub-meter means a Ground Sampling Distance (GSD) of less than 1 metre per pixel in satellite or aerial imagery. Each pixel represents a ground area smaller than 1m x 1m. At sub-meter resolution, individual vehicles, road markings, building foundations, and construction trenches are visible from orbit. Sub-meter also refers to GPS and GNSS positioning accuracy below 1 metre, typically 30cm to 50cm, achieved through RTK or SBAS correction systems. Both definitions share the same meaning: precision at a level finer than one metre.


what-is-sub-meter-resolution-satellite-imagery


The word “sub-meter” appears in two distinct technical fields: satellite and aerial imagery, and GPS positioning. In both, it means the same thing: a level of precision finer than one metre. This guide covers both definitions fully, explains the sub-meter tiers in satellite imagery, shows exactly what you can and cannot see at each tier, and covers the applications where sub-meter precision is not optional.


Sub-Meter Meaning in Satellite Imagery

what-is-sub-meter-resolution-satellite-imagery

In satellite and aerial remote sensing, sub-meter refers to the spatial resolution of an image measured as Ground Sampling Distance (GSD). GSD is the real-world size of one pixel in the image.

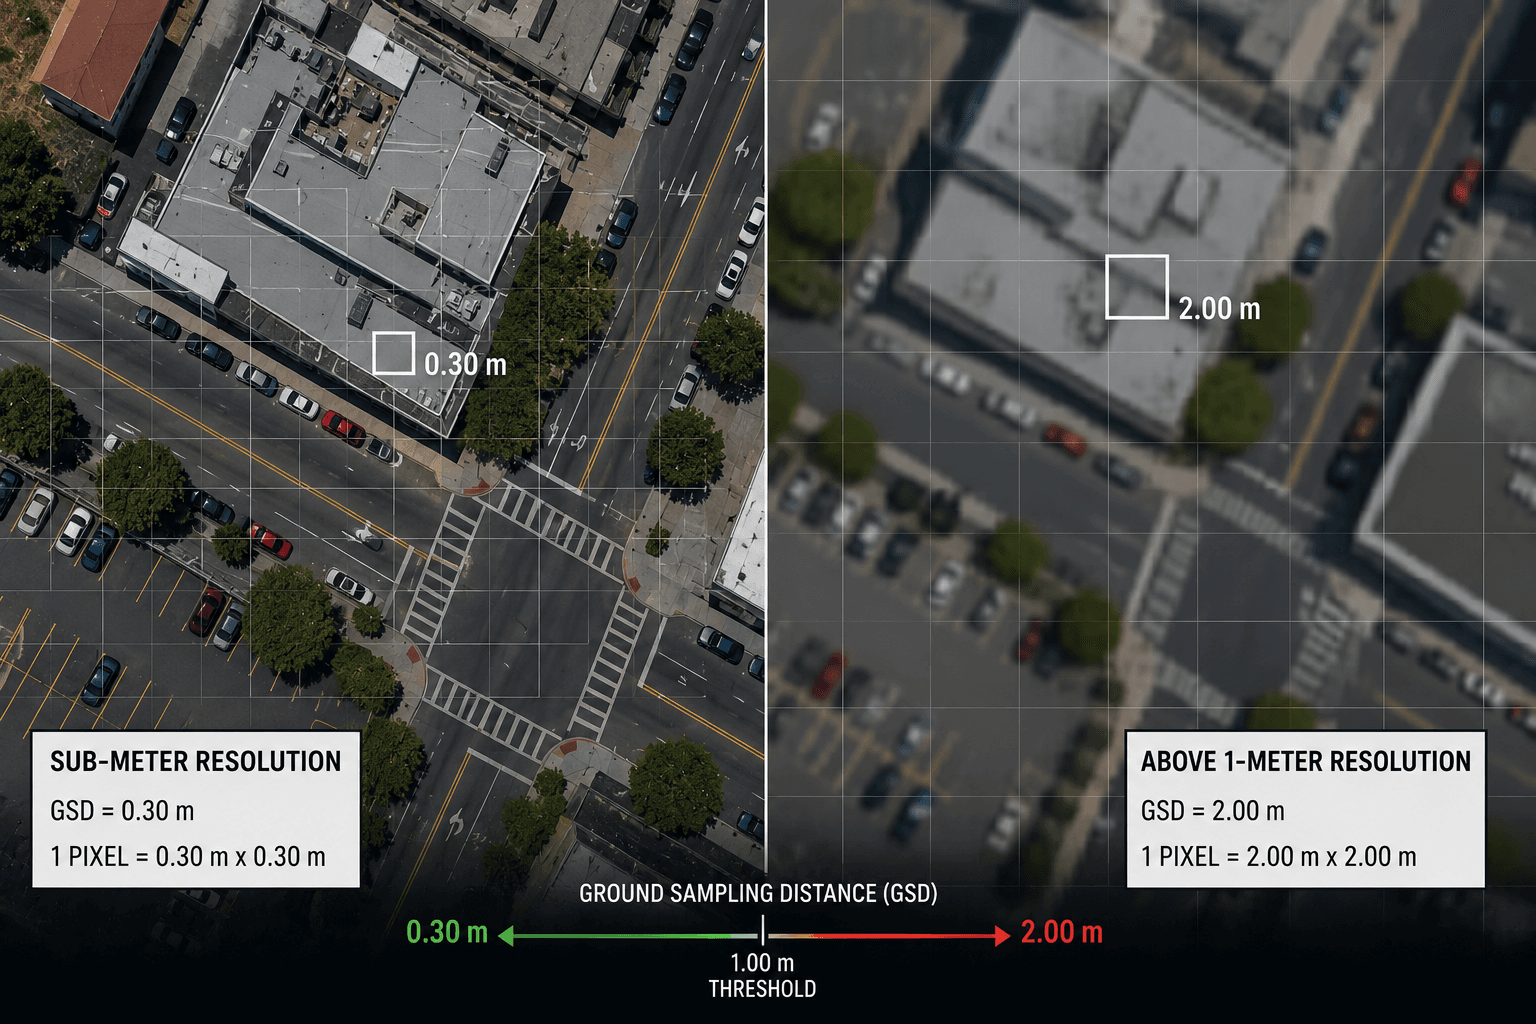
A GSD of 0.30m means each pixel represents a 30cm x 30cm square on the ground. Because 0.30m is less than 1m, this is sub-meter resolution. A GSD of 2m means each pixel represents a 2m x 2m square: this is above 1m and is not sub-meter.

The 1-metre threshold is significant because it is roughly the point at which individual vehicles, road lane markings, and precise building outlines become distinguishable from space. Below 1m GSD, the image contains enough pixels per feature to support object identification, extraction, and measurement. Above 1m GSD, those features become ambiguous or invisible.


The Three Sub-Meter Resolution Tiers

XRTech categorises sub-meter satellite imagery into three tiers based on GSD range and the analytical capabilities of each.


Super High Resolution: 0.25m to 0.30m GSD

Raffles-City-Singapore-SuperView-Neo-1-satellite-imagery-30cm

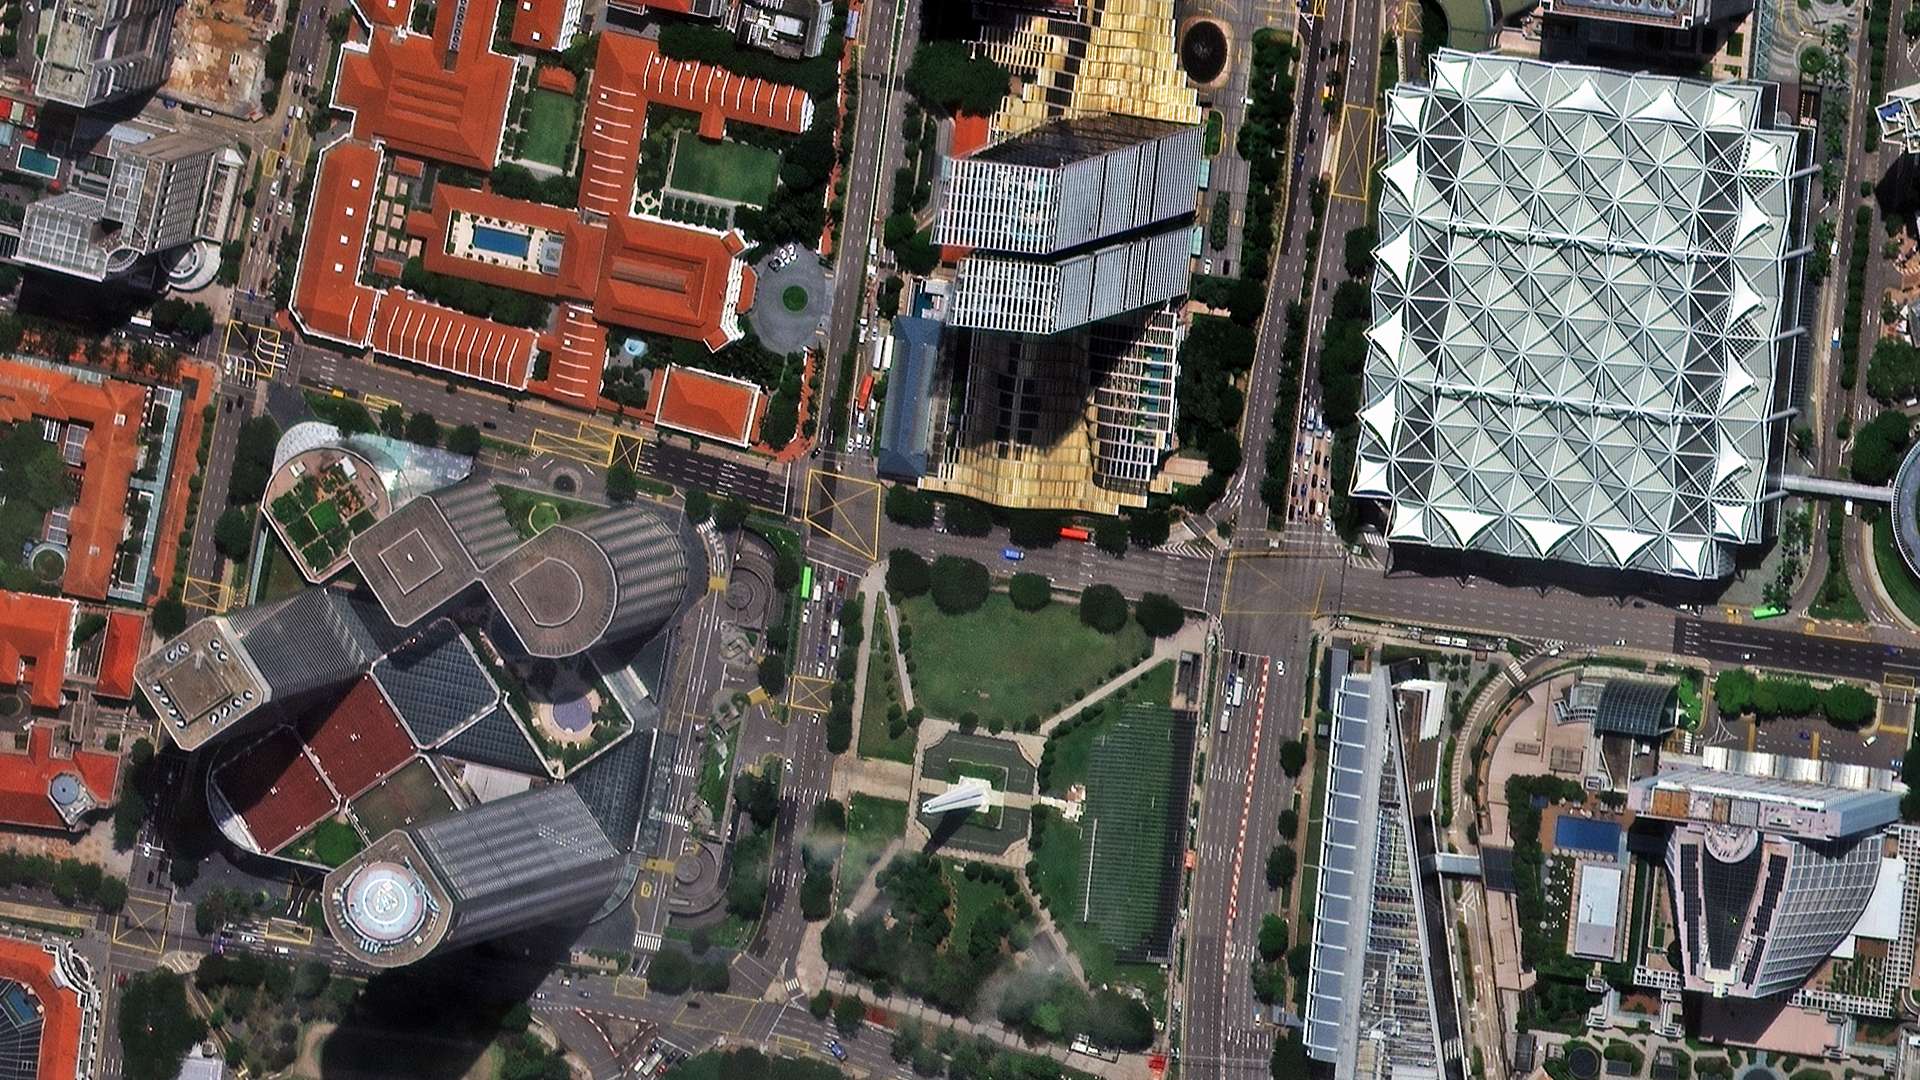
This is the finest native commercial satellite resolution currently available anywhere in the world. At 0.25m to 0.30m GSD, one pixel covers a 25cm to 30cm square on the ground.

At this resolution you can see:

  • Individual vehicles including cars, trucks, and buses with shape and orientation
  • Road lane markings, pedestrian crossings, and road surface detail
  • Building foundations, rooftop features, HVAC units, and skylights
  • Construction trenches, earthwork progress, and foundation pours
  • Vessel type identification in ports and harbours
  • Individual trees and gaps in tree canopy

XRTech satellite: SuperView Neo-1 at 0.25m to 0.30m GSD. CE90 horizontal accuracy of 2m to 4m at nadir. Buy Satellite Imagery


Very High Resolution: 0.31m to 0.50m GSD

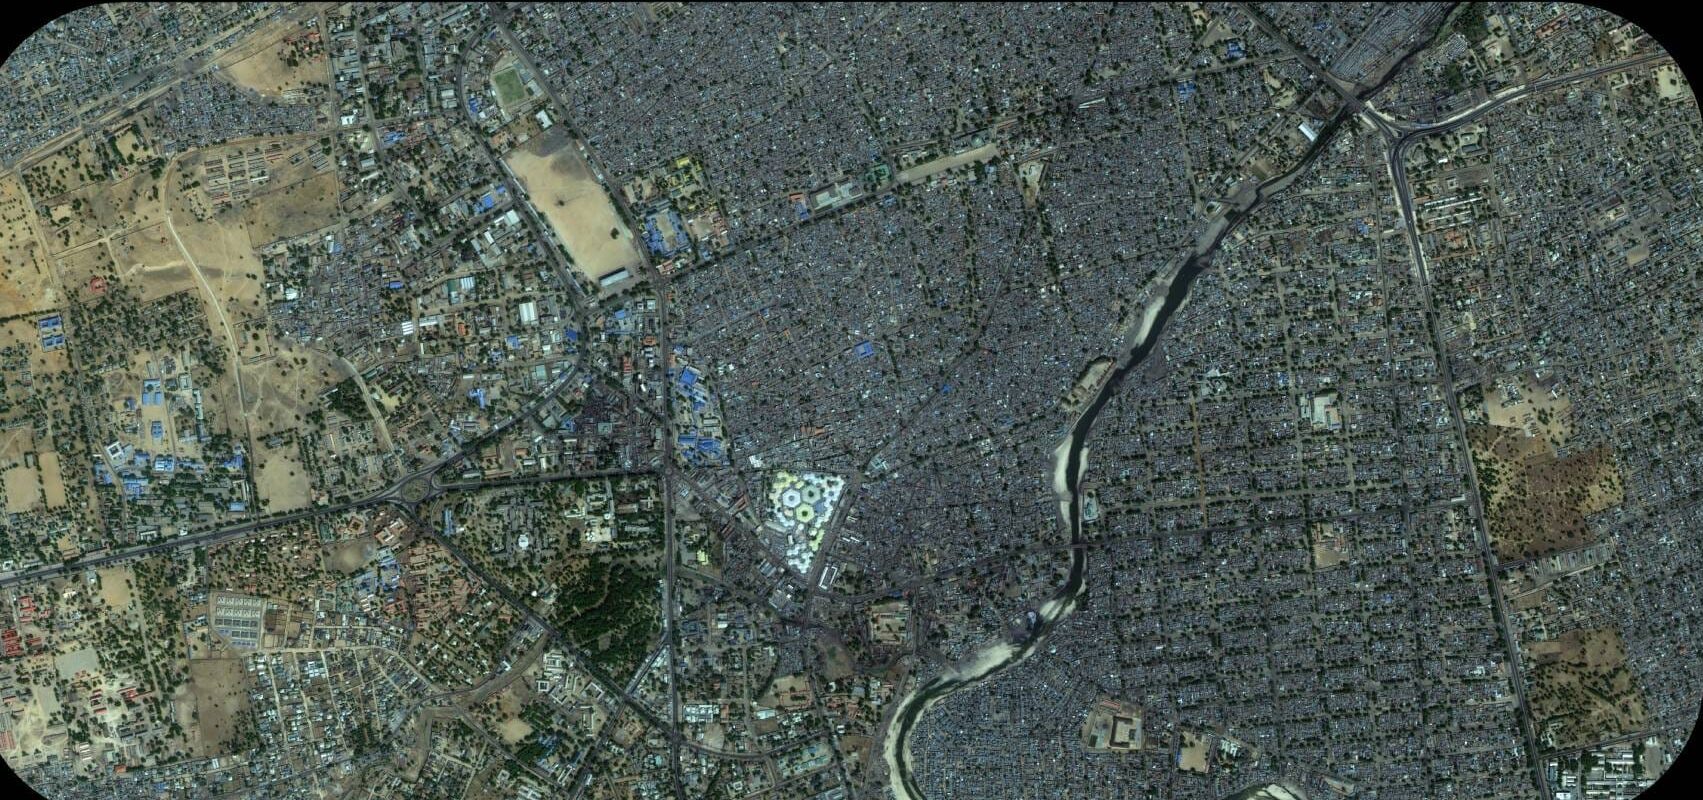
One pixel covers a 31cm to 50cm square. Detail is excellent for monitoring urban infrastructure, site-level change detection, and building footprint mapping.

At this resolution you can see:

  • Vehicles are detectable but type identification becomes less reliable beyond 0.40m
  • Building footprints and roof structures are clearly defined
  • Road widths and junction layouts are measurable
  • Construction progress at building and site level
  • Field boundary mapping and large tree identification

XRTech satellites: SuperView-2 (0.42m, 8-band multispectral), SuperView-1 (0.50m).


High Resolution: 0.51m to 0.80m GSD

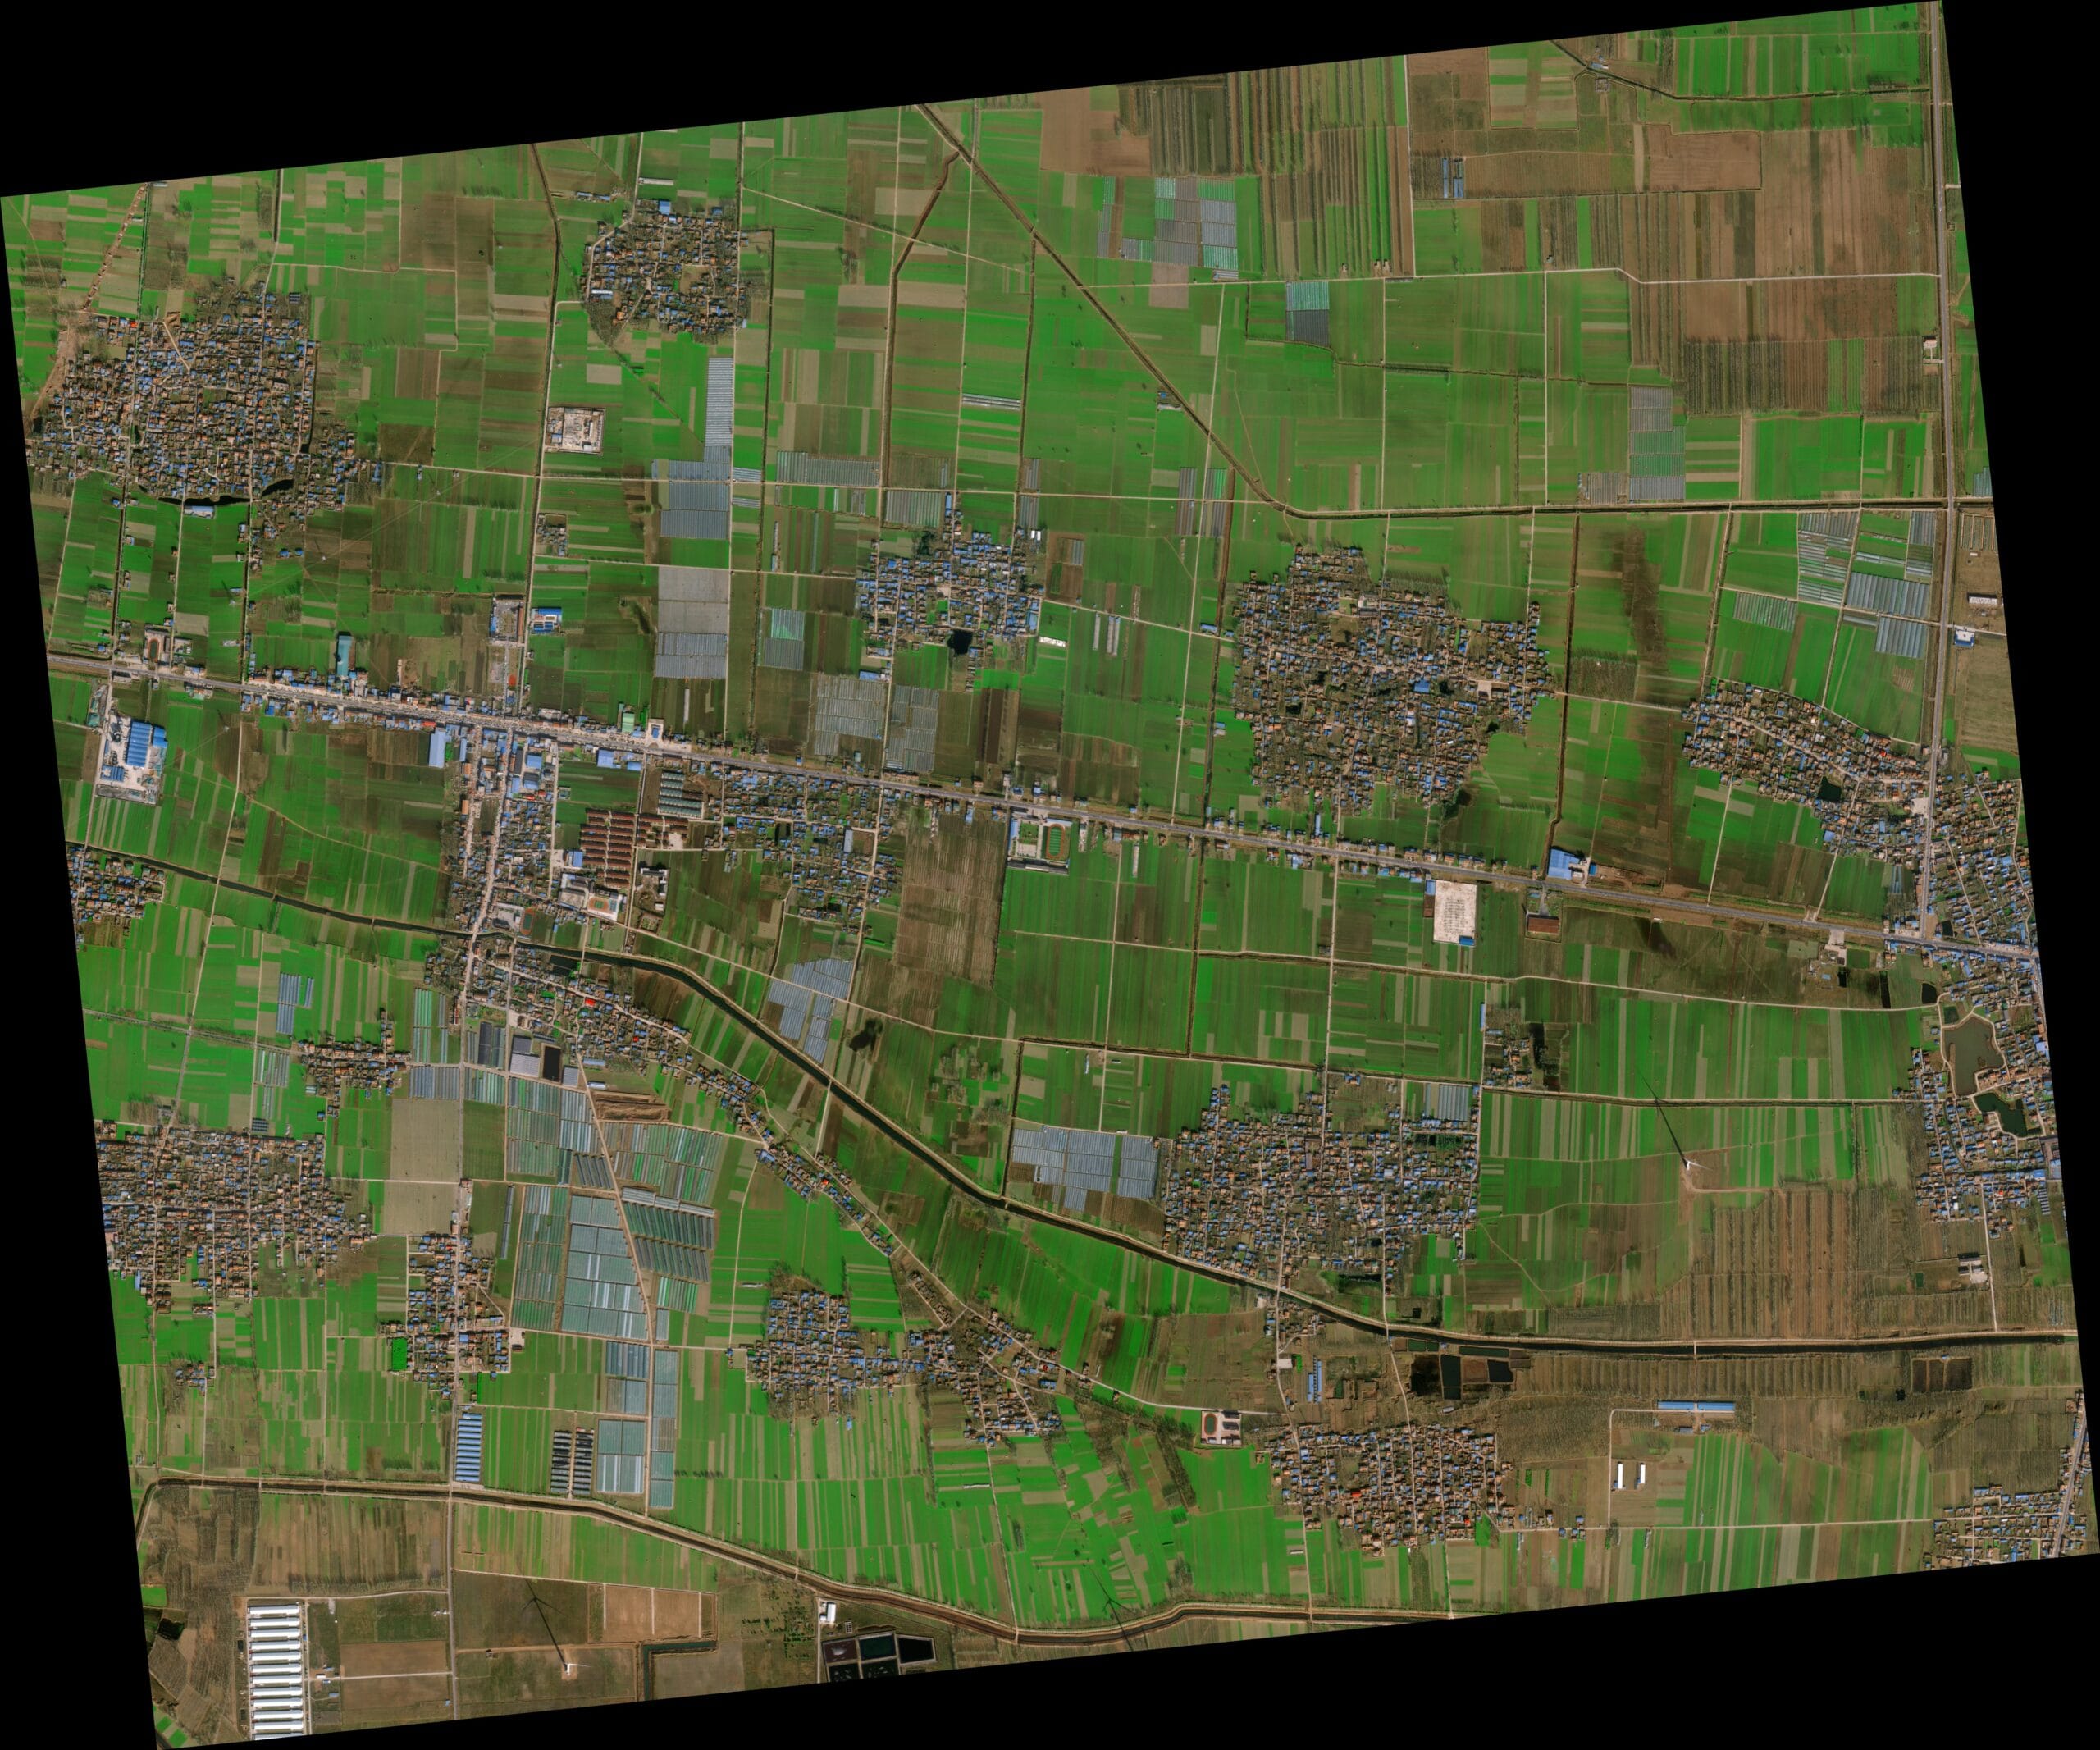
One pixel covers a 51cm to 80cm square. This tier is used for sub-meter mapping where extreme detail is less critical but positional accuracy at better than 1m is still required.

At this resolution you can see:

  • Buildings, roads, and large infrastructure features clearly
  • Construction zones and site boundaries
  • Field-level agricultural patterns
  • Large vehicles such as trucks and buses are detectable but cars become marginal

XRTech satellites: GF-7 (0.65m stereo for DEM and 3D mapping), GF-2 (0.80m).


Summary: Sub-Meter Detection Thresholds

GSDPixel SizeWhat Is DetectableXRTech Satellite
0.25m to 0.30m25cm to 30cmVehicles, road markings, foundations, trenches, vessel typesSuperView Neo-1
0.31m to 0.50m31cm to 50cmBuildings, roads, construction progress, field boundariesSuperView-2, SuperView-1
0.51m to 0.80m51cm to 80cmLarge structures, roads, site boundaries, agricultural plotsGF-7, GF-2
1m to 5m1m to 5mBuilding footprints, large roads, field blocksGF-3 SAR, GF-6
Above 5m5m plusLand cover zones, rivers, regional patternsGF-1, GF-1 WFI, GF-4

Sub-Meter vs Non-Sub-Meter: What the Difference Looks Like

sub-meter-vs-meter-imagery

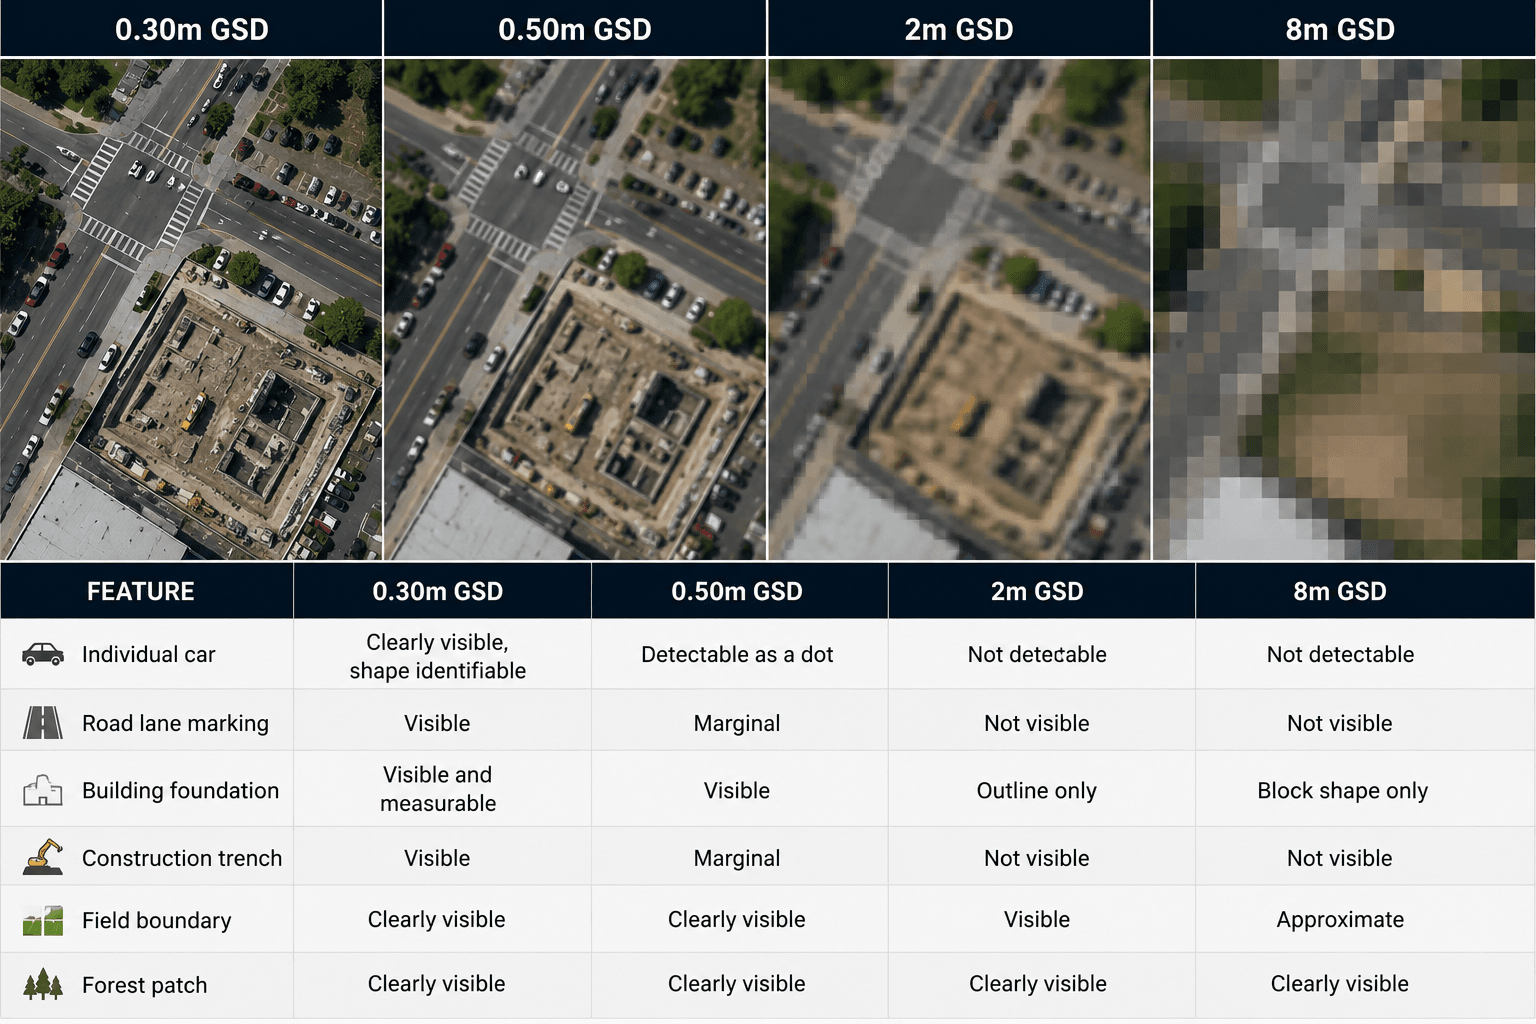
The difference between sub-meter and medium-resolution imagery is not subtle. It is the difference between actionable intelligence and a general overview.

At 0.30m GSD, a standard car covers approximately 44 pixels in the image. You can see the vehicle shape, orientation, and shadow. At 2m GSD, the same car covers less than 2 pixels and is invisible as a distinct object.


Feature0.30m GSD0.50m GSD2m GSD8m GSD
Individual carClearly visible, shape identifiableDetectable as a dotNot detectableNot detectable
Road lane markingVisibleMarginalNot visibleNot visible
Building foundationVisible and measurableVisibleOutline onlyBlock shape only
Construction trenchVisibleMarginalNot visibleNot visible
Field boundaryClearly visibleClearly visibleVisibleApproximate
Forest patchClearly visibleClearly visibleClearly visibleClearly visible

Wide-area satellites like GF-1 at 8m GSD and GF-4 at 50m GSD are excellent tools for environmental monitoring, national land cover surveys, and rapid global refresh. But they are the wrong data source for any application requiring object-level identification or precise boundary measurement. For those applications, sub-meter imagery is not a preference. It is a requirement.

Sub-Meter Meaning in GPS and GNSS Positioning

In positioning and navigation, sub-meter level accuracy means a horizontal error of less than 1 metre between your measured position and your true position. This is a separate definition from satellite imagery resolution but shares the same core concept: precision finer than one metre.

Why Standard GPS Is Not Sub-Meter

Standard GPS receivers in smartphones and consumer devices achieve 3m to 5m accuracy under good conditions. This is sufficient for navigation to a street address but not for surveying, utility mapping, precision agriculture, or any application where your measured position must match your true position within one metre.

The sources of GPS error that prevent sub-meter accuracy include:

  • Atmospheric delays as the signal passes through the ionosphere and troposphere
  • Satellite clock and orbit errors
  • Multipath reflections in urban environments where signals bounce off buildings
  • Receiver hardware limitations


How Sub-Meter GPS Accuracy Is Achieved

RTK (Real-Time Kinematic): A base station with a precisely known position broadcasts correction data to a rover receiver in real time. The rover applies the corrections to its raw GPS measurements, reducing positional error to 1cm to 3cm. RTK requires a base station within roughly 10km to 30km of the rover.

SBAS (Satellite-Based Augmentation System): Ground reference stations across a region calculate GPS correction data and broadcast it via geostationary satellites. SBAS receivers like WAAS (North America), EGNOS (Europe), and MSAS (Japan) achieve 30cm to 50cm accuracy without a local base station. This is true sub-meter GPS.

PPK (Post-Processed Kinematic): Similar to RTK but corrections are applied after data collection rather than in real time. Used in drone surveys and aerial mapping where real-time correction is not practical.

PPP (Precise Point Positioning): Uses precise satellite orbit and clock corrections from global networks. Achieves 5cm to 10cm accuracy without a local base station but requires longer convergence times (20 to 40 minutes).

Sub-Meter GPS Applications

ApplicationRequired AccuracyMethod
Precision agriculture (variable rate application)30cm to 50cmSBAS or RTK
Utility mapping (pipelines, cables)50cmSBAS
Forestry and environmental survey30cm to 1mSBAS
Municipal asset management50cm to 1mSBAS
Construction stakeout1cm to 3cmRTK
Drone survey ground control1cm to 3cmRTK/PPK
Emergency response mapping50cm to 1mSBAS

Standard smartphone GPS (3m to 5m) is adequate for routing and navigation. Sub-meter GPS is needed when the feature being mapped is smaller than 1m, when features need to be located relative to existing mapped infrastructure, or when regulatory requirements specify sub-metre positional accuracy.


Sub-Meter Level Accuracy in Geospatial Standards

CE90 vs RMSE: Horizontal vs Vertical Accuracy

In professional geospatial standards, sub-meter accuracy has specific meanings tied to map scale and product specifications.

CE90 (Circular Error 90%): 90% of all measured points in an image fall within a defined radius of their true ground position. For sub-meter imagery, CE90 specifications range from 2m to 8m depending on the satellite and processing level. CE90 is the positional accuracy standard for horizontal mapping.

1:1,000 scale mapping requires approximately 50cm CE90 or better. Sub-meter imagery with GCPs applied can meet this standard.

1:5,000 scale mapping requires approximately 2.5m CE90. Standard orthorectified sub-meter imagery without GCPs typically meets this.

1:10,000 scale mapping requires approximately 5m CE90. SuperView-1 at 5m to 8m CE90 meets this. GF-7 with its laser altimeter achieves under 2m CE90 without GCPs, comfortably exceeding the 1:10,000 requirement.


Applications of Sub-Meter Satellite Imagery

Construction and Infrastructure Monitoring

Sub-meter imagery at 0.30m GSD shows individual foundations, trenches, rebar layouts, and earthwork volumes at a level of detail that enables weekly progress tracking without site visits. Project managers compare sequential captures to verify that construction milestones match drawings and schedules.

Urban Digital Twin Creation

Building a digital twin of a city requires sub-meter optical imagery for building footprint extraction and roof geometry, combined with DSM data for building heights. At 0.30m to 0.50m GSD with tri-stereo acquisition, automated algorithms can extract building outlines, heights, and rooftop features across entire urban areas in a single processing run.

Marine and Port Security

Vessel identification in ports and harbours requires enough pixels per vessel to distinguish ship type, orientation, and activity. At 0.30m GSD, container ships, tankers, patrol vessels, and small craft are identifiable by shape and size. Port traffic analysis, vessel counting, and anchorage monitoring all depend on sub-meter resolution.

Precision Agriculture

Sub-meter imagery combined with multispectral bands (red edge, NIR, SWIR) from SuperView-2 at 0.42m GSD enables individual plant row mapping, variable-rate input prescription, and early disease detection at a spatial scale where field management decisions align with crop variability. This is not achievable at medium resolution where individual rows merge into uniform pixel blocks.

Engineering and Legal Boundary Surveys

Property boundaries, easement lines, and right-of-way limits require imagery precise enough to identify physical markers and boundary features. Sub-meter imagery with GCPs applied achieves 50cm to 1m horizontal accuracy, which is sufficient for boundary confirmation and legal documentation in many jurisdictions.

Infrastructure Inspection

Pipelines, power lines, roads, and bridges are all inspectable at sub-meter resolution. Damage, encroachment, and deformation are detectable at 0.30m GSD without physical access to the site. For linear infrastructure covering hundreds of kilometres, satellite inspection covers the full route in one pass at a fraction of the cost of aerial or ground survey.


Sub-Meter Imagery Pricing at XRTech

Resolution TierGSDArchive PriceNew Tasking Price
Super High Resolution0.25m to 0.30m$20/km2$30/km2
Very High Resolution0.31m to 0.50m$14/km2$22/km2
High Resolution0.51m to 0.80m$5/km2$10/km2

Minimum order: 25km2 for archive, 100km2 for new tasking. Emergency collection at 0.30m is available at $80/km2 for urgent response situations. A free sample tile is included with every enquiry.

Order Sub-Meter Satellite Imagery From XRTech

XRTech provides sub-meter satellite imagery from 0.25m to 0.80m GSD for any location on Earth. Archive orders are delivered within 48 hours. New tasking is completed in under 7 days at standard priority.

Contact XRTech with your AOI, required resolution tier, and project timeline. We will confirm availability, recommend the right sub-meter tier for your application, and deliver a free sample tile within 24 hours.


FAQs

What is a sub-meter in satellite imagery?

Sub-meter in satellite imagery means a Ground Sampling Distance of less than 1 metre per pixel. Each pixel covers less than a 1m x 1m square on the ground. At sub-meter resolution, individual vehicles, road markings, building foundations, and construction trenches are visible from orbit.

What does sub-meter level mean in GPS positioning?

Sub-meter level GPS accuracy means a positional error of less than 1 metre between the measured position and the true ground position. It is achieved through SBAS corrections (30cm to 50cm accuracy) or RTK corrections (1cm to 3cm accuracy). Standard smartphone GPS achieves only 3m to 5m accuracy.

What is the sub-meter meaning in surveying?

In surveying, sub-meter means positional accuracy better than 1 metre. This is required for utility mapping, cadastral surveys, construction stakeout, and any application where features must be located relative to existing mapped infrastructure with metre or better precision.

What is the finest sub-meter resolution available from satellites?

The finest native commercial satellite resolution currently available is 0.25m GSD from SuperView Neo-1, available through XRTech. This means one pixel covers a 25cm x 25cm square on the ground. Super resolution processing can achieve an effective 0.15m GSD for metro area basemaps.

What can you see at sub-meter satellite resolution?

At 0.30m GSD you can see individual vehicles, road lane markings, building foundations, construction trenches, rooftop features, vessel types in ports, and individual trees. At 0.50m GSD, vehicles are detectable and building footprints are clearly defined. At 0.80m GSD, large structures and site boundaries are precise but individual vehicles become marginal.

Is sub-meter resolution always necessary?

No. For regional land cover mapping, vegetation monitoring, flood extent analysis, and national environmental surveys, 2m to 10m resolution is sufficient and more cost-effective. Sub-meter is required when the smallest feature you need to detect or measure is smaller than roughly 4 metres, which puts it below the 4-pixel detection threshold at 1m GSD.

What is the CE90 accuracy of sub-meter satellite imagery?

CE90 accuracy for sub-meter imagery varies by satellite and processing level. SuperView Neo-1 at 0.30m GSD achieves 2m to 4m CE90 at nadir. SuperView-1 at 0.50m achieves 5m to 8m CE90. With ground control points applied during reprocessing, CE90 can be reduced to under 1m for engineering-grade accuracy requirements.

What is the difference between sub-meter satellite imagery and drone imagery?

Drone imagery achieves finer GSD than sub-meter satellites: professional drones reach 2cm to 5cm GSD. The trade-off is coverage: a drone survey covers tens to hundreds of hectares per day. A satellite order covers thousands of square kilometres in a single pass. Sub-meter satellites are more practical for large areas. Drones are better for small sites requiring centimetre-level detail.

How much does sub-meter satellite imagery cost?

XRTech archive pricing starts at $5/km2 for 0.51m to 0.80m high resolution, $14/km2 for 0.31m to 0.50m very high resolution, and $20/km2 for 0.25m to 0.30m super high resolution. New tasking starts at $10/km2, $22/km2, and $30/km2 respectively. Minimum order is 25km2 for archive and 100km2 for new tasking.

What satellites does XRTech use for sub-meter imagery?

XRTech’s sub-meter fleet includes SuperView Neo-1 at 0.25m to 0.30m GSD, SuperView-2 at 0.42m with 8-band multispectral capability, SuperView-1 at 0.50m, GF-7 at 0.65m with laser altimeter for precision 3D mapping, and GF-2 at 0.80m. All are available for archive and new tasking orders globally.


Blog Summary

  1. Sub-meter resolution in satellite imagery means a GSD of less than 1m per pixel, so each pixel covers less than a 1m x 1m square on the ground
  2. The three sub-meter tiers are super high resolution (0.25m to 0.30m), very high resolution (0.31m to 0.50m), and high resolution (0.51m to 0.80m)
  3. At 0.30m GSD, one pixel covers a 30cm x 30cm square: individual vehicles, road markings, and building foundations are clearly visible
  4. Sub-meter GPS accuracy of 30cm to 50cm is achieved through RTK (Real-Time Kinematic) or SBAS (Satellite-Based Augmentation System) corrections
  5. Standard smartphone GPS gives 3m to 5m accuracy: sub-meter GPS is 6 to 15 times more precise
  6. Sub-meter satellite imagery meets CE90 horizontal accuracy standards for engineering, urban planning, and infrastructure inspection
  7. Medium and wide-area imagery at 2m to 50m GSD cannot show individual vehicles, road markings, or precise building boundaries
  8. Sub-meter imagery is used for construction monitoring, urban digital twin creation, vessel identification, infrastructure inspection, and precision agriculture
  9. The SuperView Neo-1 at 0.25m to 0.30m GSD is the finest native commercial satellite resolution available and is in the XRTech fleet
  10. Archive sub-meter imagery starts at $5/km2 for 0.51m to 0.80m and $20/km2 for 0.30m from XRTech

Related Posts

Request Product Details

Satellite Imagery Advisor

Brief questions. Practical guidance. Get an indicative estimate instantly, and we only proceed to a formal quote once the basics are clear.

Advisor mode: this form will recommend the lowest resolution and type that fits your objective so you do not overpay.
Step 1 — Area & Location
1 / 4
Start simple: Upload a KML/KMZ/ZIP if you have it. If not, a bounding box or center plus dimensions works fine. We will calculate area for you where possible.
Upload AOI file (KML / KMZ / ZIP) — recommended
Preferred: a single polygon AOI. We compute the area automatically.
Enter corner coordinates (bounding box)
Use min/max latitude and longitude.
Enter center coordinate + width & height
Good for quick feasibility when exact boundaries are not available.
Describe location (city / region / site name)
We will follow up to confirm an AOI boundary if needed.
Advisor note: If speed is the priority, we usually check archive first. If you need a specific date window or fresh capture, choose new tasking.
Archive imagery
Previously captured imagery, typically faster delivery.
New capture (tasking)
Satellite is tasked for your AOI; weather and availability can affect capture date.
Not sure, advise me
We will recommend the most feasible option based on area, timing, and objective.
Minimum order guidance
Archive imagery: typically 15 to 25 km²
New capture: typically 50 to 100 km²
Feasibility depends on satellite, location, and timing.
Pick a date window. We will advise what is realistic for your area and cloud conditions.
Resolution guidance: Higher resolution increases detail and cost. We will recommend the lowest resolution that meets your objective.
I know what I need
Select 30cm, 50cm, 75cm, or 1m.
Advise me based on my objective
Answer a quick question about what you need to see.
Almost done. You will see an indicative estimate. If you agree, we will run feasibility and send a formal quote.
I understand this is an indicative estimate and request feasibility and a formal quote.
We handle requests confidentially. No data is shared with third parties.
Protected by spam filter and bot detection. Genuine enquiries only.
Live Summary
Updates as you answer
Area (km²)
AOI method
Coordinates / Location
Imagery type
Date range
Resolution

Indicative Estimate

Based on XRTech published pricing. Final price confirmed after feasibility check.
Complete Steps 1 to 3 to see an estimate.
Once you submit, XRTech will:
  • Archive: run a coverage check in your date range
  • Tasking: confirm window and issue order form or invoice

Quote Request Sent

Your satellite imagery request has been sent to admin@xrtechgroup.com. XRTech will review feasibility and send a formal quote within 24 hours. A free sample tile for your AOI is included in the quote response.