Quick answer: There are two main families of maps. General reference maps show where things are: political, physical, topographic and road maps. Thematic maps show one topic across an area, such as population, climate or risk, using methods like choropleth, dot density, proportional symbol, heat, isoline, flow and cartogram maps. Around them sit special purpose types: weather and climate maps, nautical and aeronautical charts, cadastral, land cover, geologic and hazard maps, historical maps, and the newest group built from satellite data: satellite image maps, elevation models and interactive web maps.
Textbooks and GIS platforms each sort map types a little differently, so this guide explains all types of maps in the order people actually meet them, with a real example of a map for each one. Every example below is free to use: public domain maps from the USGS, NOAA, FAA, FEMA, USDA, the CIA and historic collections, plus maps XRTech Group made from US Census data. We supply satellite imagery and GIS data that teams turn into many of these maps, so we also explain which map types need current imagery and which do not.
All Types of Maps at a Glance
Use this table to find the right type of map fast. Each one is explained in detail below.
Type of map
What it shows
Example of a map
Typical users
Political map
Borders, countries, states, capitals
World political map
Governments, schools, publishers
Physical map
Landforms, rivers, relief
Shaded relief map of the US
Education, travel, planning
Topographic map
Elevation with contour lines
USGS 1:24,000 quadrangle
Engineers, hikers, surveyors
Road map
Highways and streets
Interstate Highway System map
Drivers, logistics, delivery
Choropleth map
A rate shaded by area
Population density by county
Analysts, planners, media
Dot density map
Individual events or counts as dots
John Snow cholera map, 1854
Health, crime, retail analysis
Proportional symbol map
Totals as sized circles
City populations
Market and sales analysis
Heat map
Concentration of points as a surface
Incident or customer hotspots
Security, retail, mobility
Isoline map
Lines of equal value
Isobars, isotherms, contours
Meteorology, engineering
Flow map
Movement between places
Minard map of Napoleon in Russia
Transport, trade, migration
Cartogram
Area resized by a variable
Countries sized by population
Elections, economics
Climate map
Long term averages
USDA plant hardiness zones
Agriculture, insurance, energy
Weather map
Current and forecast conditions
NOAA surface analysis
Forecasters, aviation, shipping
Nautical chart
Water depths, channels, hazards
NOAA electronic navigational chart
Mariners, ports
Aeronautical chart
Airspace, airports, obstacles
FAA VFR sectional chart
Pilots, drone operators
Cadastral map
Property parcels and lot lines
County plat or parcel map
Real estate, tax, legal
Land use and land cover map
Forest, farmland, urban, water
National Land Cover Database
Planners, environment teams
Geologic and resource map
Rock units, faults, minerals
USGS geologic map
Mining, oil and gas, engineering
Hazard and risk map
Flood, fire, quake exposure
FEMA flood insurance rate map
Insurers, lenders, emergency teams
Historical map
Places and borders in the past
Waldseemuller world map, 1507
Researchers, lawyers, heritage
Satellite image map
The real ground surface
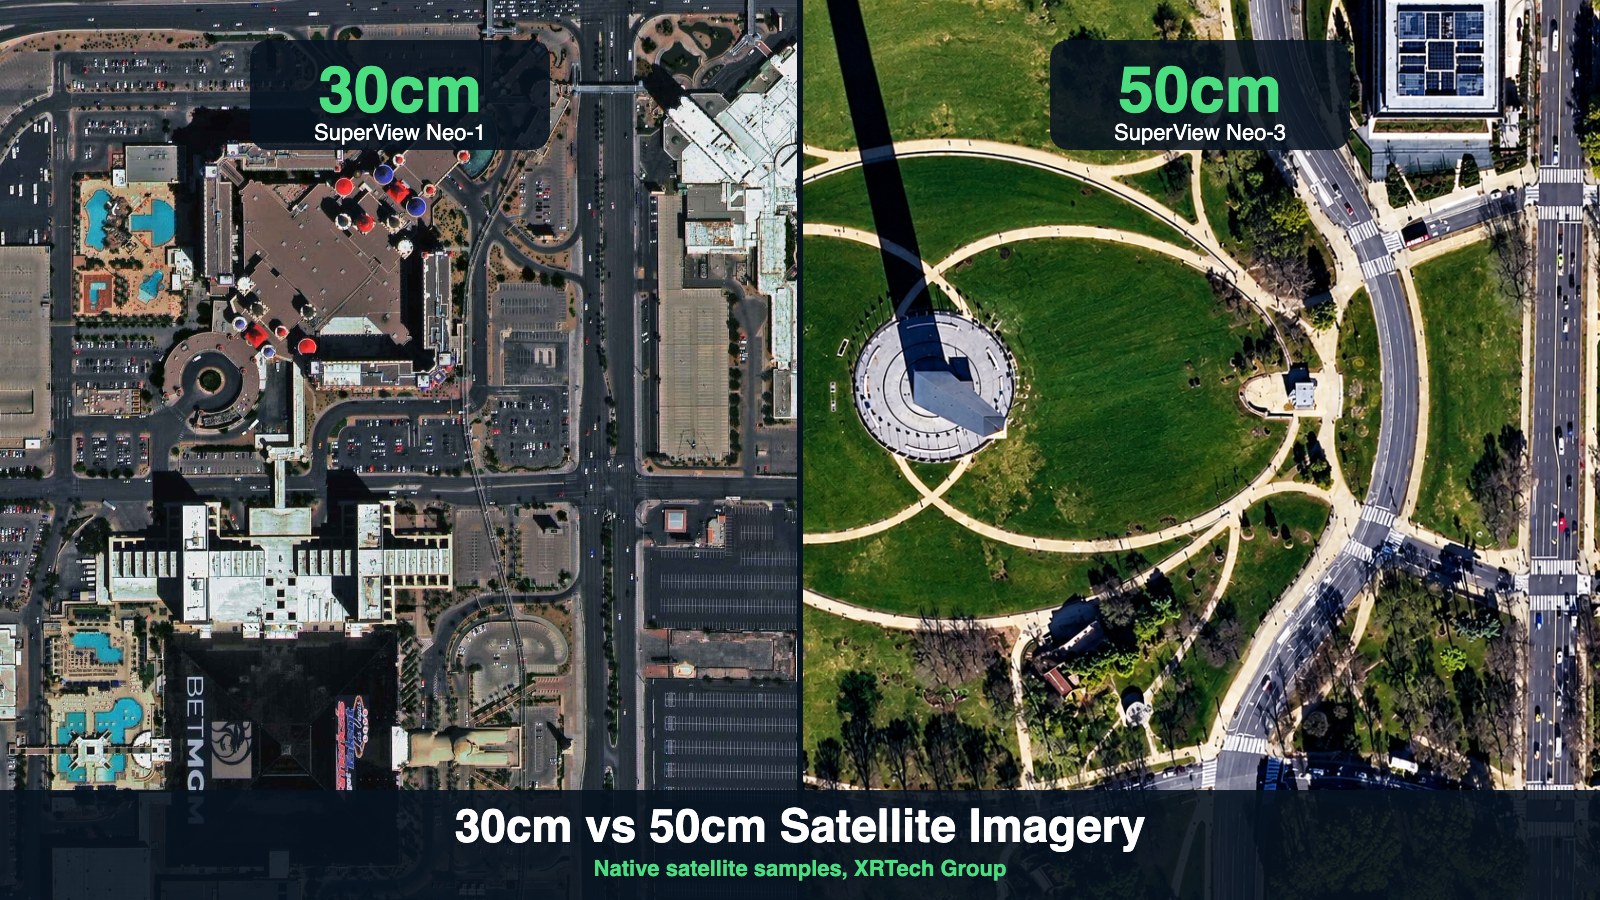
30 cm orthorectified satellite image
Construction, insurance, defense
Elevation and 3D map
Terrain or surface height
Digital elevation model (DEM)
Engineering, flood and mine planning
Interactive web map
Layers you can search and click
Florida cities and towns map
Everyone, from consumers to GIS teams
What Is a Map?
A map is a scaled, simplified picture of part of the Earth (or another surface) that shows where things are and how they relate. Cartography, the craft of making maps, decides three things for every map: what to show (the data), how big (the scale) and how to flatten the round Earth (the projection).
A good map, printed or digital, carries a few standard map elements so readers can trust it:
- Title: what, where and, for data maps, when.
- Legend or key: what each color, line and symbol means.
- Scale: a ratio such as 1:24,000 or a scale bar.
- North arrow or grid: orientation and coordinates, such as latitude and longitude or a UTM grid.
- Source and date: who made the data and how current it is.
- Projection: how the curved surface was flattened, which controls what is distorted.
What Are the Different Types of Maps?
The different types of map fall into two big families, plus specialist charts and data products:
- General reference maps show many features at once so you can find places: political, physical, topographic and road maps.
- Thematic maps show one subject, such as population, income, rainfall or risk, on top of a simple base map. Choropleth, dot density, proportional symbol, heat, isoline, flow and cartogram maps are the main thematic methods.
- Special purpose maps and charts are built to a standard for one job: nautical charts for ships, aeronautical charts for pilots, cadastral maps for property, geologic maps for what lies underground and hazard maps for insurance and safety.
- Image and data maps come from sensors rather than drawing: satellite and aerial image maps, digital elevation models and interactive web maps that combine many layers.
One place can appear on all of them. Seattle on a political map is a dot inside Washington State, on a topographic map it is hills and contour lines, on a choropleth it is a set of shaded ZIP codes, and on a satellite image map it is every roof, road and ship in the harbor.
General Reference Maps
1. Political Maps
Political maps show human boundaries: countries, states, provinces, counties and cities, with capitals and major towns. Each unit gets a flat color so borders stand out, and physical detail is kept to rivers and coastlines.
When to use it: to show jurisdiction, such as which country, state or county a site falls in, or to set the scene in a report. Watch out for: borders change and some are disputed, so check the date and source. Administrative maps at local level, such as city limits or ZIP code areas, are the working version of a political map. Our free Florida cities and towns map and Seattle ZIP code map are examples built from US Census boundaries.
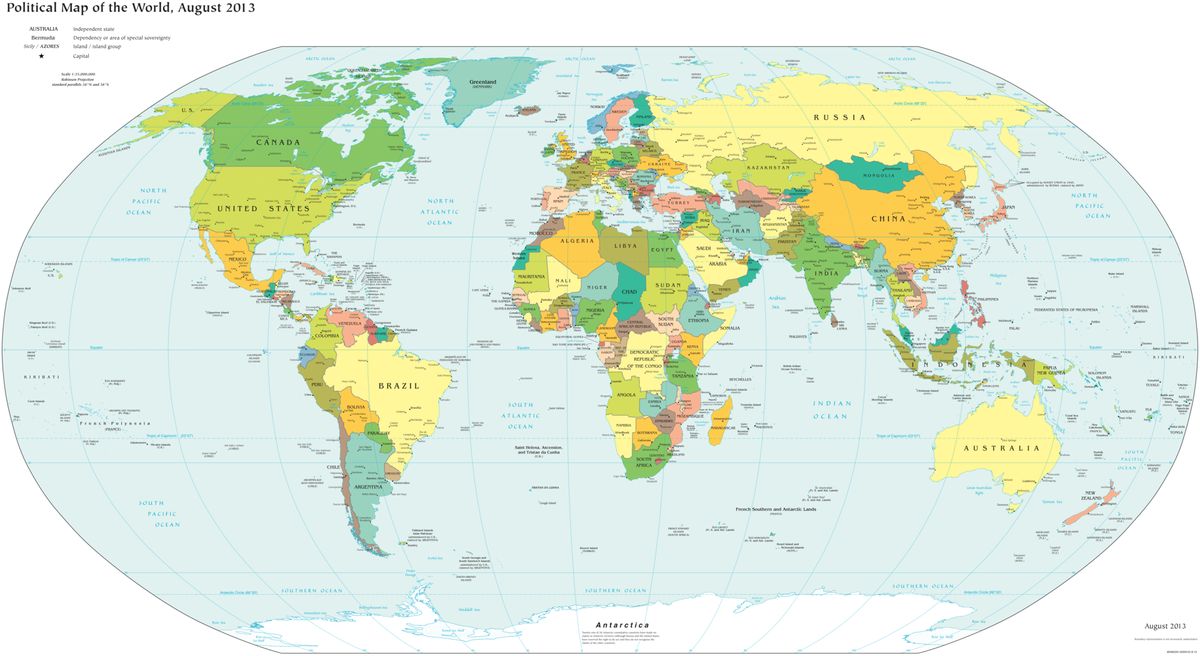
Political map of the world. Source: Central Intelligence Agency, The World Factbook, public domain.
2. Physical Maps
Physical maps show the natural landscape: mountains, plateaus, valleys, plains, rivers, lakes and deserts. They use shaded relief and color tints that suggest height, often green for lowlands rising through brown to white for high peaks, plus bathymetric blues for ocean depth.
When to use it: to understand the lie of the land before planning a route, a pipeline or a regional study. Limit: a physical map shows the general shape of the terrain, not exact heights. When you need measured elevation, use a topographic map or a digital elevation model.
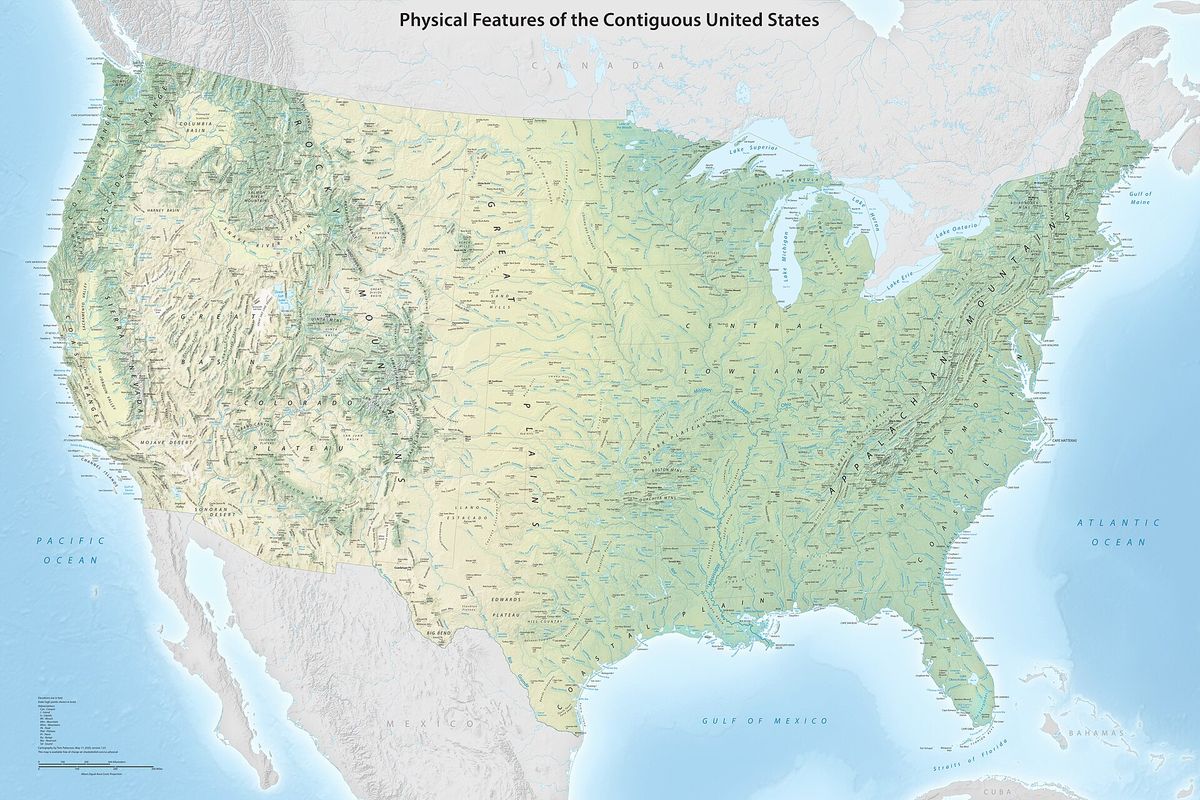
Physical map of the contiguous United States with shaded relief. Source: Tom Patterson, US National Park Service, public domain.
3. Topographic Maps
A topographic map shows the shape and height of the land with contour lines, lines that join points of equal elevation. Lines close together mean steep ground and lines far apart mean gentle slopes. Topographic maps also show roads, buildings, water, vegetation and place names, which makes them the most detailed general reference map.
In the United States the USGS standard is the 7.5 minute quadrangle at 1:24,000 scale, used since 1947, where one inch on the map equals 2,000 feet on the ground (Alaska uses 1:25,000). The current US Topo series is produced from The National Map and is refreshed on a three year cycle that follows the NAIP aerial imagery program, so about a third of the country is updated each year.
When to use it: site selection, drainage and earthworks planning, trail and route planning, and any job that needs slope or relief. For engineering grade heights, pair it with a digital elevation model (DEM, DSM or DTM).
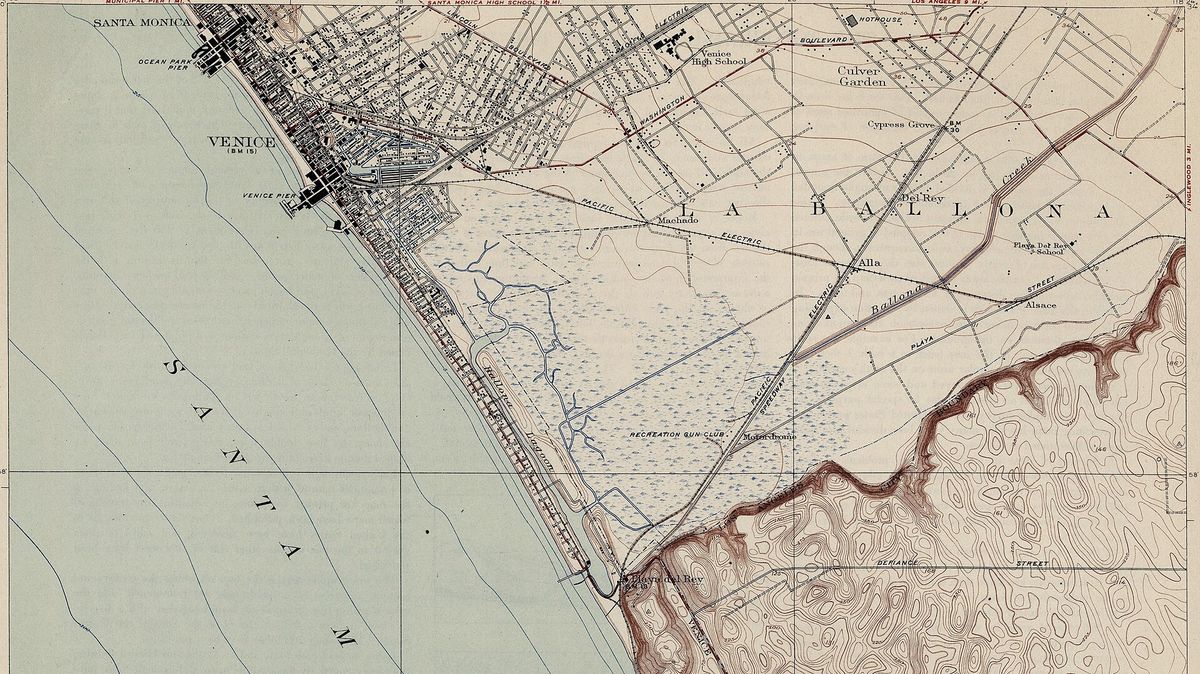
USGS topographic quadrangle map with contour lines (Venice, California, 1923). Source: US Geological Survey, public domain.
4. Road Maps and Navigation Maps
Road maps show highways, streets, interchanges, distances and points of interest for travel. Printed atlases have largely given way to navigation apps, but the road map is still the base layer behind every routing engine, delivery platform and fleet tracking system.
When to use it: route planning, logistics, service areas and drive time analysis. Limit: road maps show the network, not what is on the ground next to it. Construction, new estates and closed roads often appear in current satellite imagery before map apps update. Learn the difference in satellite imagery vs satellite maps.
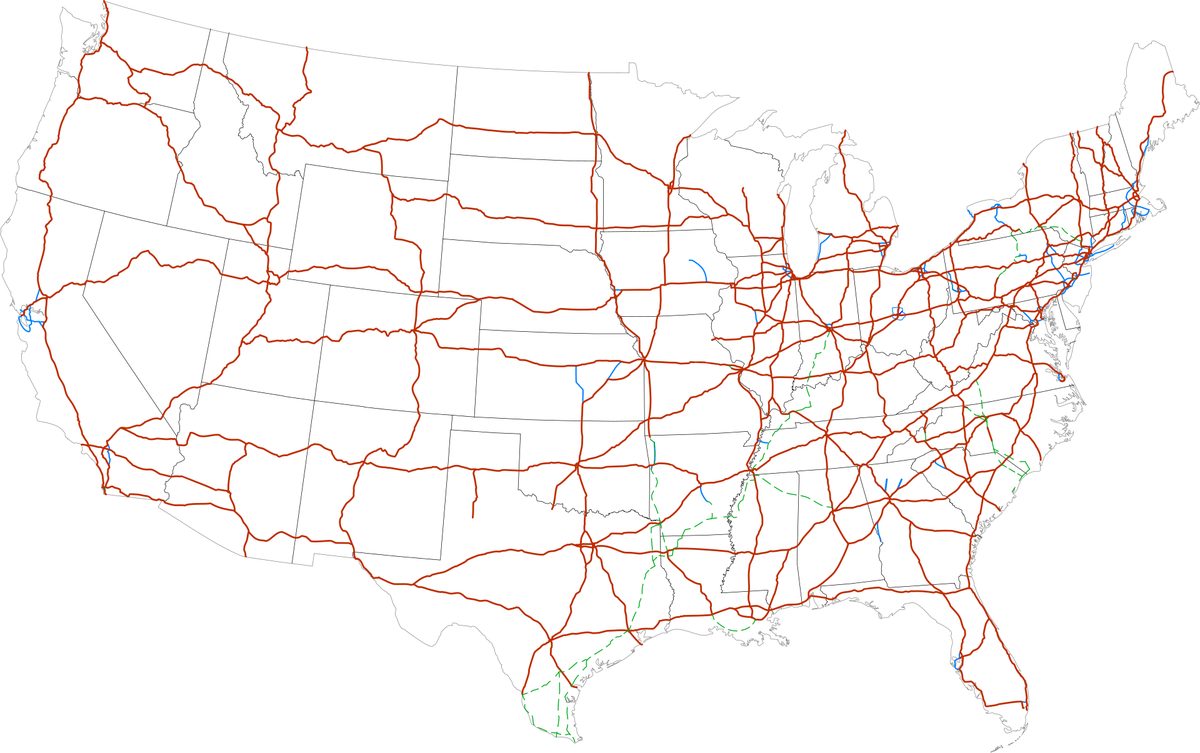
Road map of the US Interstate Highway System. Source: Wikimedia Commons (SPUI), public domain.
Thematic Maps: Different Ways to Map One Topic
Thematic maps answer "how much" or "how many" questions. The topic can be anything with a location, from population to crop yield, but the method you choose changes the story the map tells. These are the seven thematic map types analysts use most.
5. Choropleth Maps
A choropleth map shades each area, such as a country, county or ZIP code, by the value of one variable. Darker colors usually mean higher values. It is the most common thematic map in news, government reports and dashboards.
Rule that keeps it honest: map rates or densities, not raw totals. Large areas hold more people simply because they are large, so a map of total population by county mostly shows county size. The example below, made by XRTech Group from 2020 Census data, maps people per square kilometer of land instead. Pinellas County is by far the densest at about 1,353 people per km², followed by Broward, Orange, Seminole, Hillsborough, Miami-Dade and Duval, all above 500.
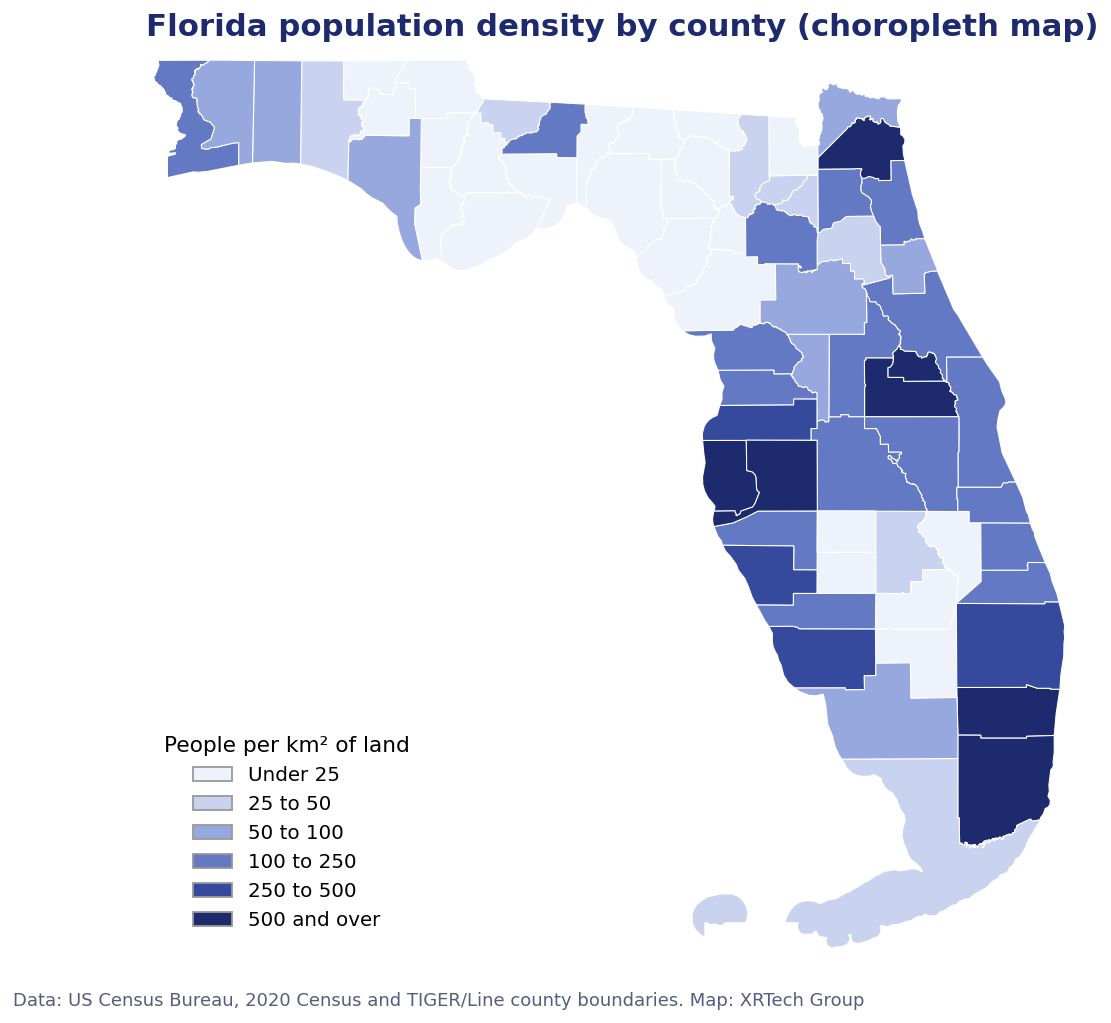
Choropleth map of Florida population density by county. Data: US Census Bureau, 2020 Census and TIGER/Line boundaries. Map: XRTech Group.
6. Dot Density and Dot Distribution Maps
A dot density map places one dot for each event, or for a fixed number of people or things, so you can see clusters and gaps. Unlike a choropleth, it shows where inside an area things actually are.
The most famous example of a map in this style is John Snow's 1854 map of cholera deaths in Soho, London. The dots cluster around the Broad Street water pump, evidence that helped show cholera spread through water. Today the same method maps customers, crimes, wells, store locations and assets.
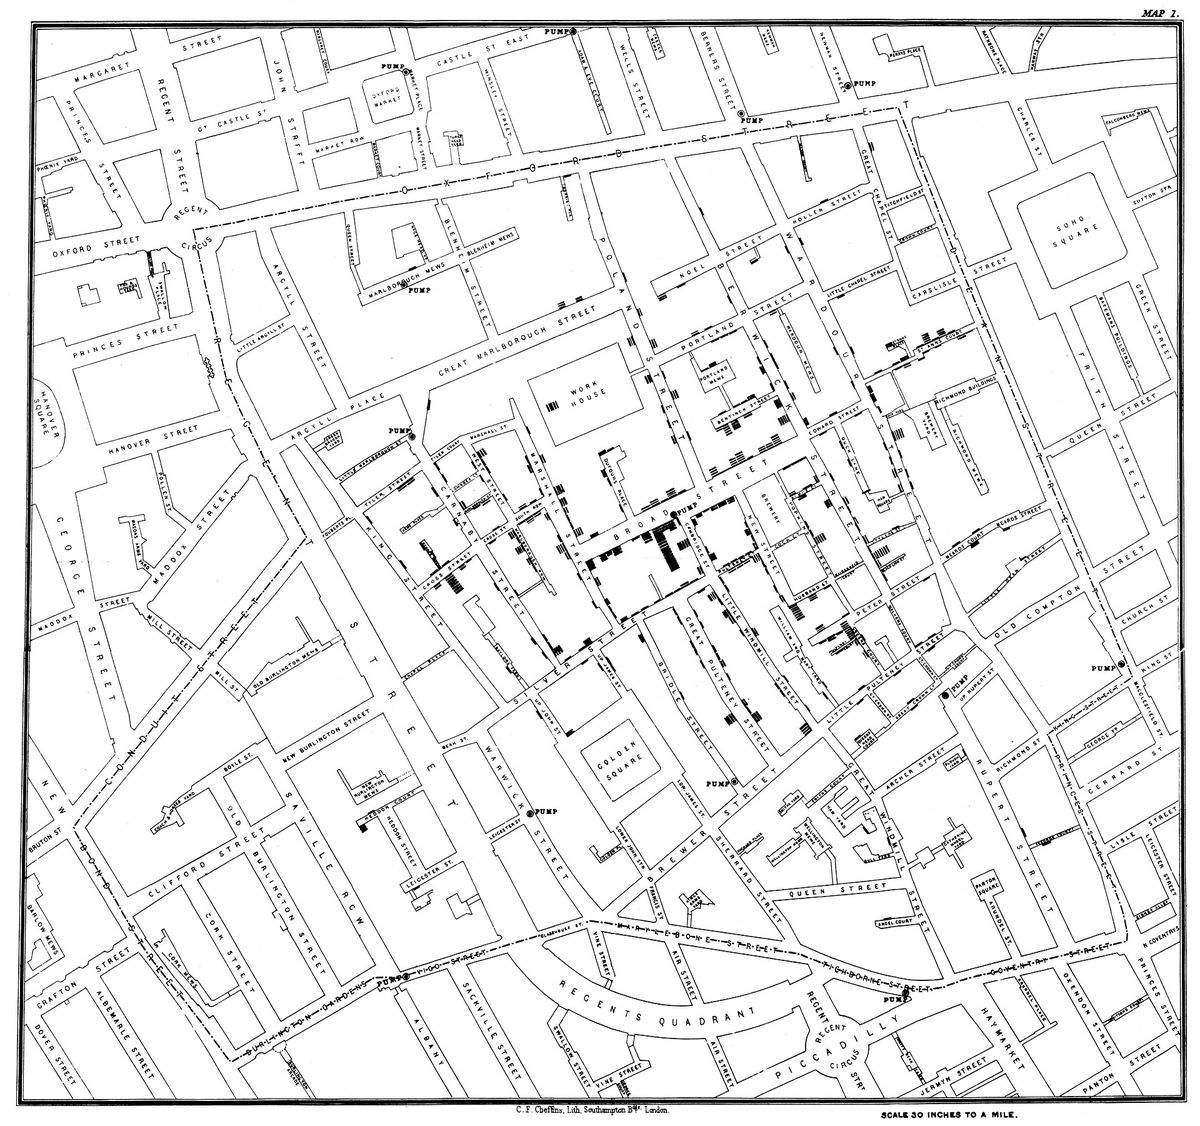
John Snow's 1854 dot map of cholera deaths around the Broad Street pump, London. Source: John Snow, public domain.
7. Proportional Symbol Maps
A proportional symbol map draws a circle or other symbol at each place, sized by a total such as population, sales or production. It is the right choice for totals tied to points, the case a choropleth handles badly.
In the XRTech example below, circle area is proportional to the 2020 Census population of every Florida city with 75,000 or more residents. Jacksonville, the largest, stands out at once, while the cluster of large cities in South Florida shows how much of the state lives along that coast.
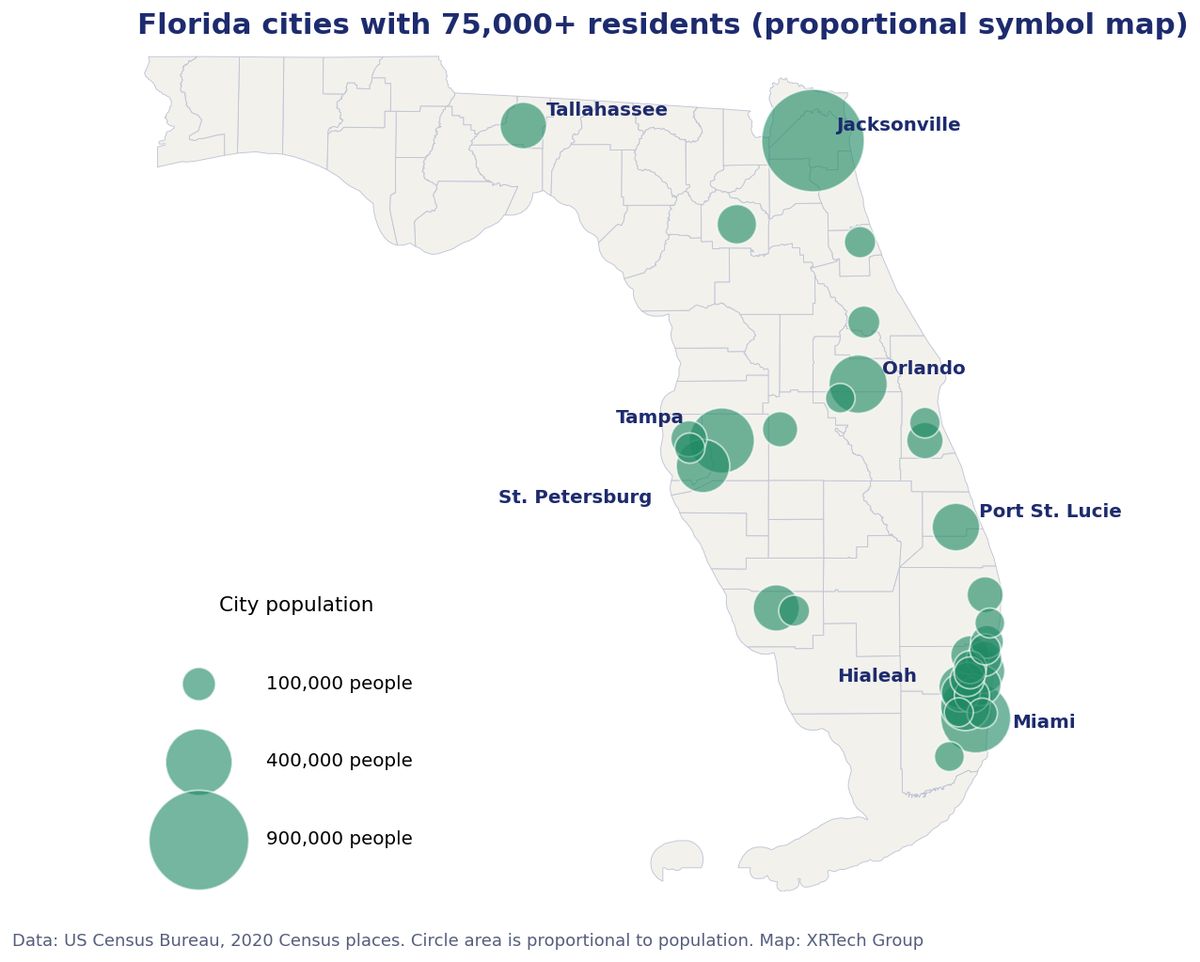
Proportional symbol map of Florida cities with 75,000 or more residents. Data: US Census Bureau, 2020 Census. Map: XRTech Group.
8. Heat Maps
A heat map turns many points into a smooth surface of intensity, usually with a kernel density calculation, and colors it from cool to hot. It shows hotspots without the clutter of thousands of overlapping dots.
When to use it: incident reports, footfall, delivery stops, wildlife sightings or any large set of points. Watch out for: the result depends on the search radius you pick, and a heat map of raw points can simply repeat where people live. Normalize when you can.
9. Isoline Maps
An isoline map joins points of equal value with lines. Contour lines (elevation) on a topographic map are isolines, and so are isobars (air pressure), isotherms (temperature) and isohyets (rainfall). They suit values that change smoothly across space and are measured at sample points, such as weather stations or survey points.
10. Flow Maps
Flow maps show movement between places, with line width scaled to the amount moving: goods, people, traffic, money or water. Charles Minard's 1869 map of Napoleon's 1812 campaign in Russia is still cited as one of the best data graphics ever made. One band shows the army shrinking on the march to Moscow and back, and a chart below links the losses to falling temperatures.
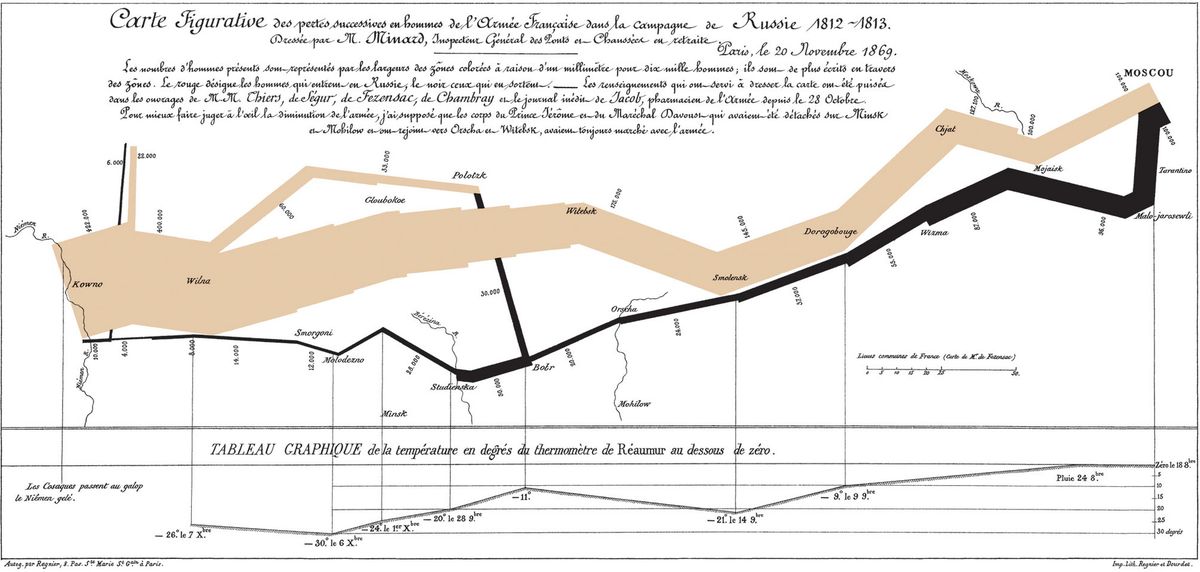
Charles Minard's 1869 flow map of Napoleon's Russian campaign. Source: Charles Minard, public domain.
11. Cartograms
A cartogram deliberately resizes each area by a variable, such as population or electoral votes, so the map reads like a chart. Small, crowded places swell and large, empty ones shrink. Cartograms correct the visual bias of choropleth maps, where big rural areas dominate, at the cost of familiar shapes.
Climate Maps and Weather Maps
12. Climate Maps
Climate maps show long term averages, usually 30 years of observations: temperature, rainfall, growing season or climate zones such as the Koppen classification. The USDA Plant Hardiness Zone Map, used by growers and nurseries, maps the average coldest winter temperature. The example below is the earlier edition based on 1976 to 2005 data. USDA released an updated map in November 2023 based on 1991 to 2020 data from more than 13,000 weather stations.
When to use it: crop and tree selection, building design, energy demand and long term insurance and risk planning.
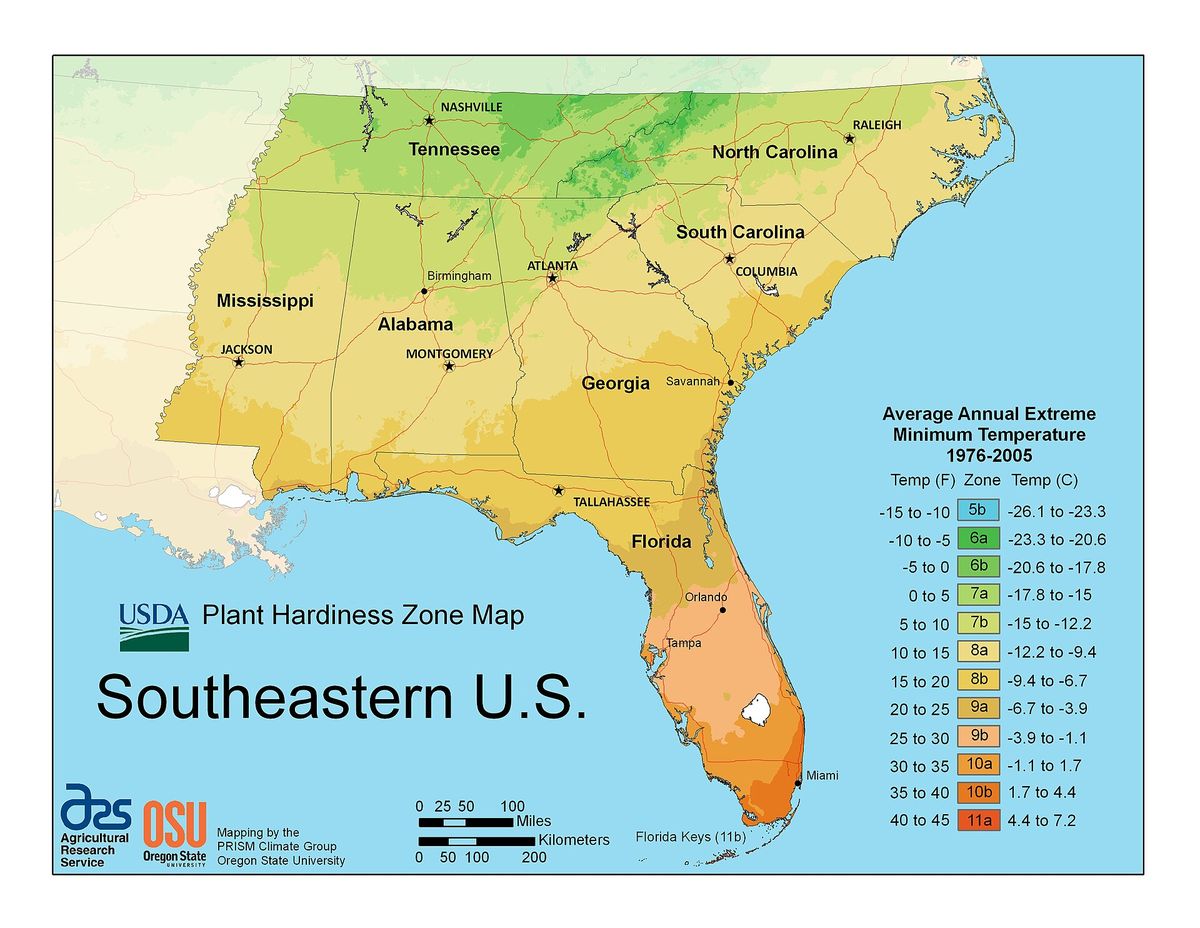
USDA Plant Hardiness Zone Map of the southeastern United States (2012 edition). Source: US Department of Agriculture, public domain.
13. Weather Maps
Weather maps show conditions at one moment or forecast for the next hours and days: pressure systems, fronts, precipitation, wind and temperature. A surface analysis map from NOAA, like the one below, plots highs, lows, fronts and isobars over station observations.
The difference is time. Climate is what you expect over decades, and weather is what you get today. Weather maps are updated many times a day, and climate maps change only when a new 30 year normal is calculated.
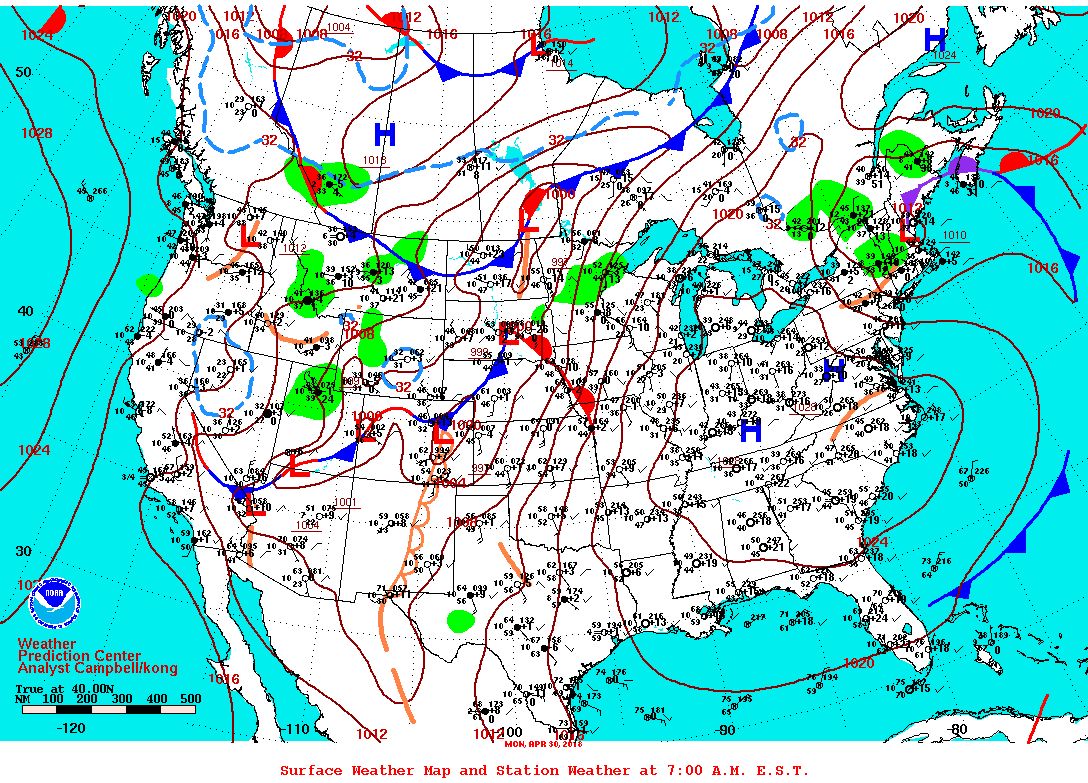
NOAA surface weather analysis map of the United States. Source: NOAA National Centers for Environmental Prediction, public domain.
Navigation Charts: Nautical and Aeronautical
14. Nautical Charts
Nautical charts are maps for water navigation. They show depths (soundings), channels, buoys, lights, wrecks, anchorages and the shape of the coast, all on a standard symbol set that mariners worldwide can read.
What changed recently: NOAA finished retiring its traditional paper and raster nautical charts in December 2024. Its electronic navigational charts (ENCs) are now the official product, and paper charts can be printed from ENC data. The next standard, IHO S-100 with the S-101 ENC format, became available for voluntary use on 1 January 2026 and is planned to replace today's S-57 charts.
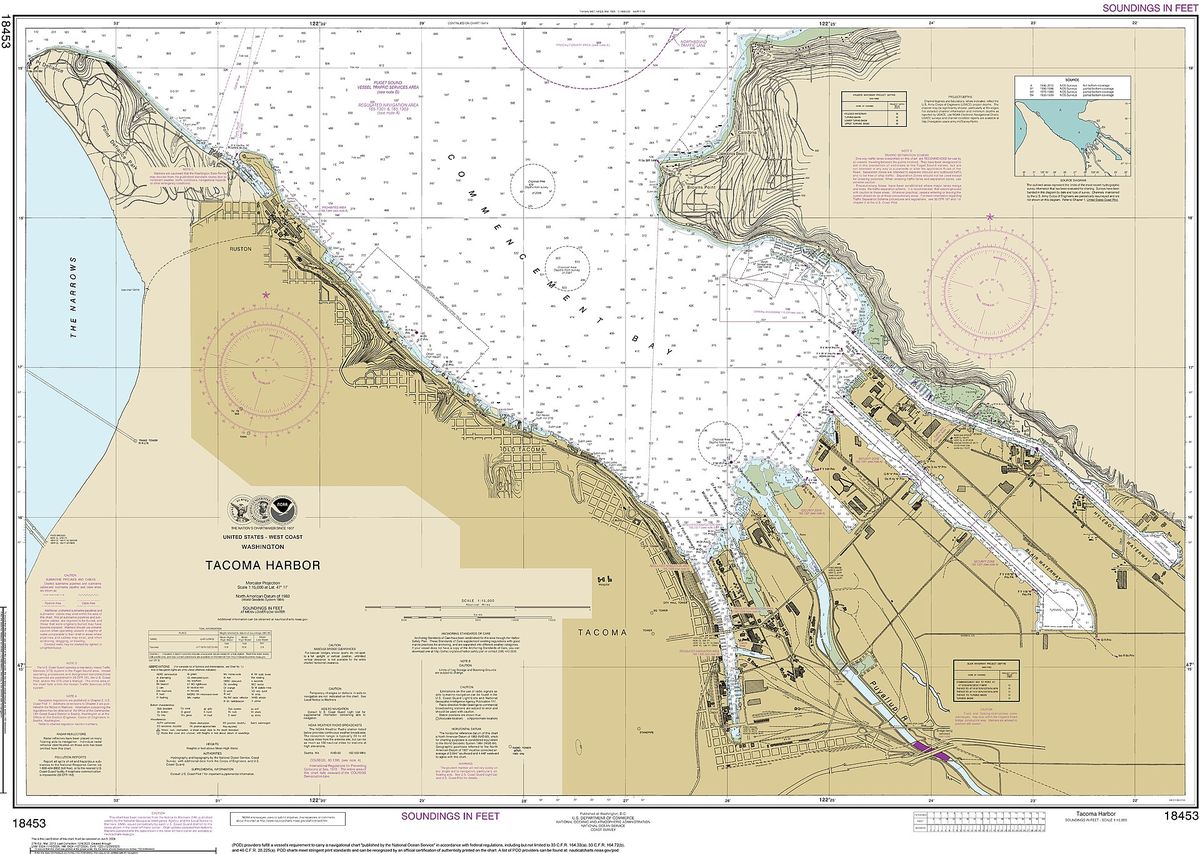
NOAA nautical chart 18453, Tacoma Harbor, with depth soundings and navigation aids. Source: NOAA Office of Coast Survey, public domain.
15. Aeronautical Charts
Aeronautical charts show what pilots need: airports, controlled and special use airspace, navigation aids, obstacles, terrain heights and visual landmarks. In the United States, FAA VFR charts, including sectional charts, have been published on a 56 day cycle since February 2021, the same cycle as IFR charts, so pilots must always fly with the current edition. Drone operators use the same airspace data to check where they may fly.
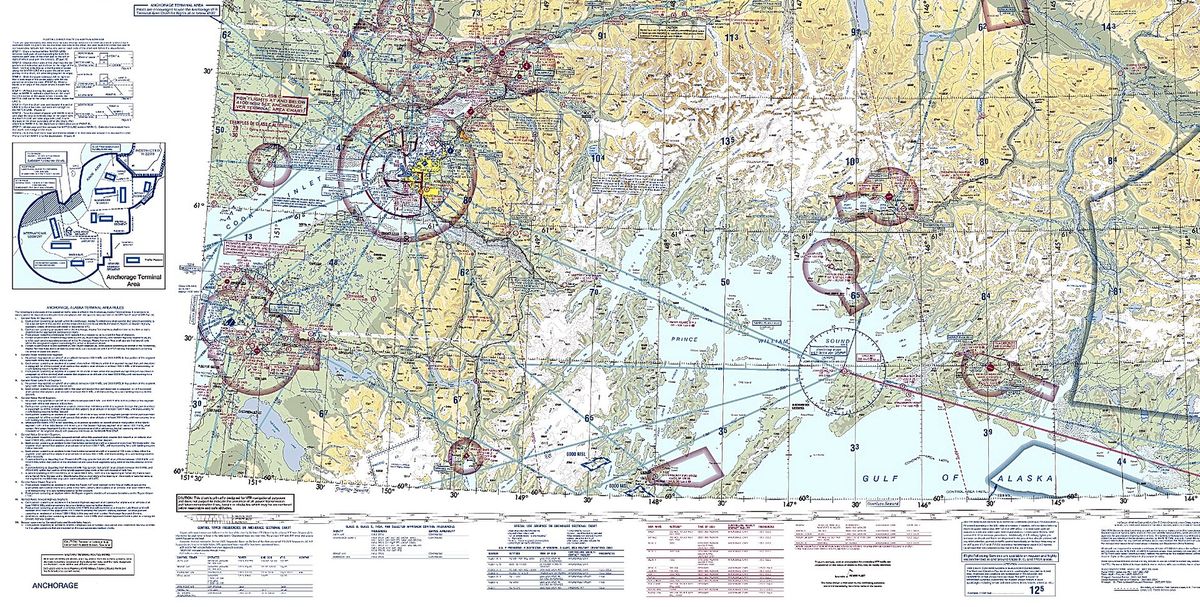
FAA VFR sectional aeronautical chart, Anchorage area. Source: Federal Aviation Administration, public domain.
Land, Property and Earth Science Maps
16. Cadastral Maps
Cadastral maps show land ownership units: parcels, lot lines, blocks, easements and parcel numbers. Counties and land registries maintain them for property tax and records, and surveyors and title companies rely on them in sales and disputes. A recorded plat, like the 1857 Salt Lake City example below, is the classic form.
Important: parcel maps on county websites are for reference. The legal boundary comes from the recorded deed and a licensed survey. Laying parcel lines over current satellite imagery is a fast way to spot fences, structures or clearing that do not match the record, and our land survey services cover the next step.
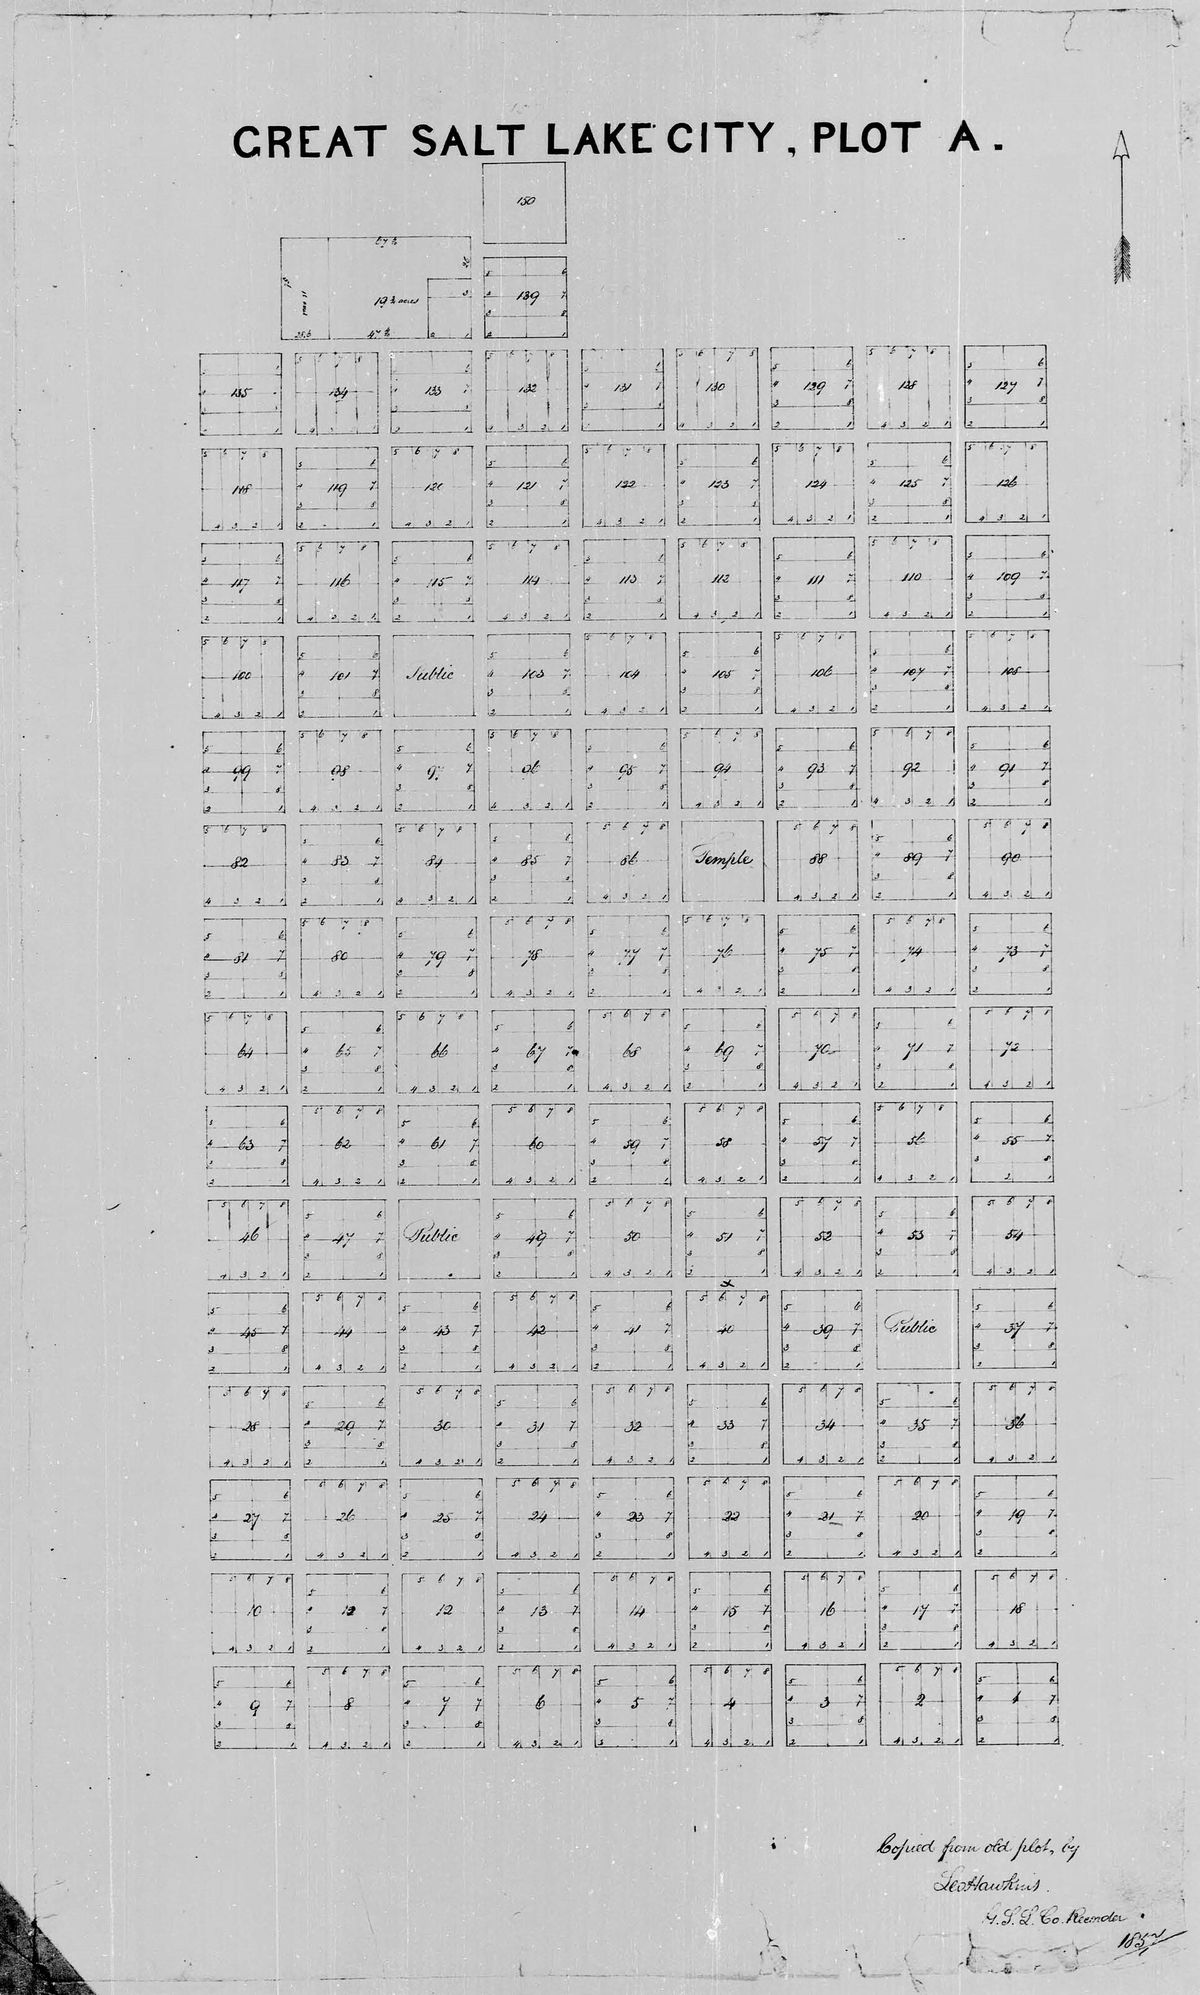
Cadastral plat map of Great Salt Lake City, Plat A, 1857. Source: Salt Lake County Recorder, public domain.
17. Land Use and Land Cover Maps
Land cover maps show what physically covers the ground, such as forest, cropland, wetland, water or developed surfaces. Land use maps show what people use it for, such as residential, industrial or agricultural. The two often differ: a field is land cover, a golf course is land use.
In the US, the USGS led National Land Cover Database (NLCD) classifies the country from 30 m Landsat imagery. For site level work, higher resolution satellite imagery shows individual buildings, roads and trees that a 30 m map cannot.
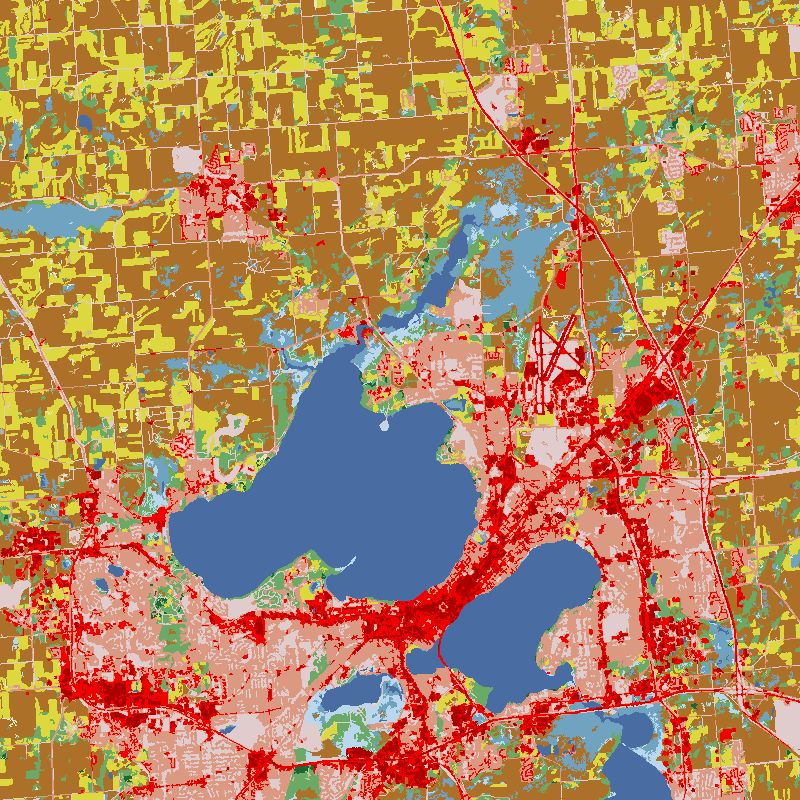
National Land Cover Database map of the Madison, Wisconsin area. Source: Multi-Resolution Land Characteristics (MRLC) Consortium, public domain.
18. Geologic and Resource Maps
Geologic maps color rock units by type and age and show faults, folds and the angle of rock layers. Resource maps show where minerals, oil and gas, groundwater, soils or timber are found. They guide exploration, engineering, groundwater studies and hazard assessment.
Modern exploration combines these maps with satellite data, such as multispectral and hyperspectral imagery for alteration minerals and radar for ground movement, to narrow targets before fieldwork.
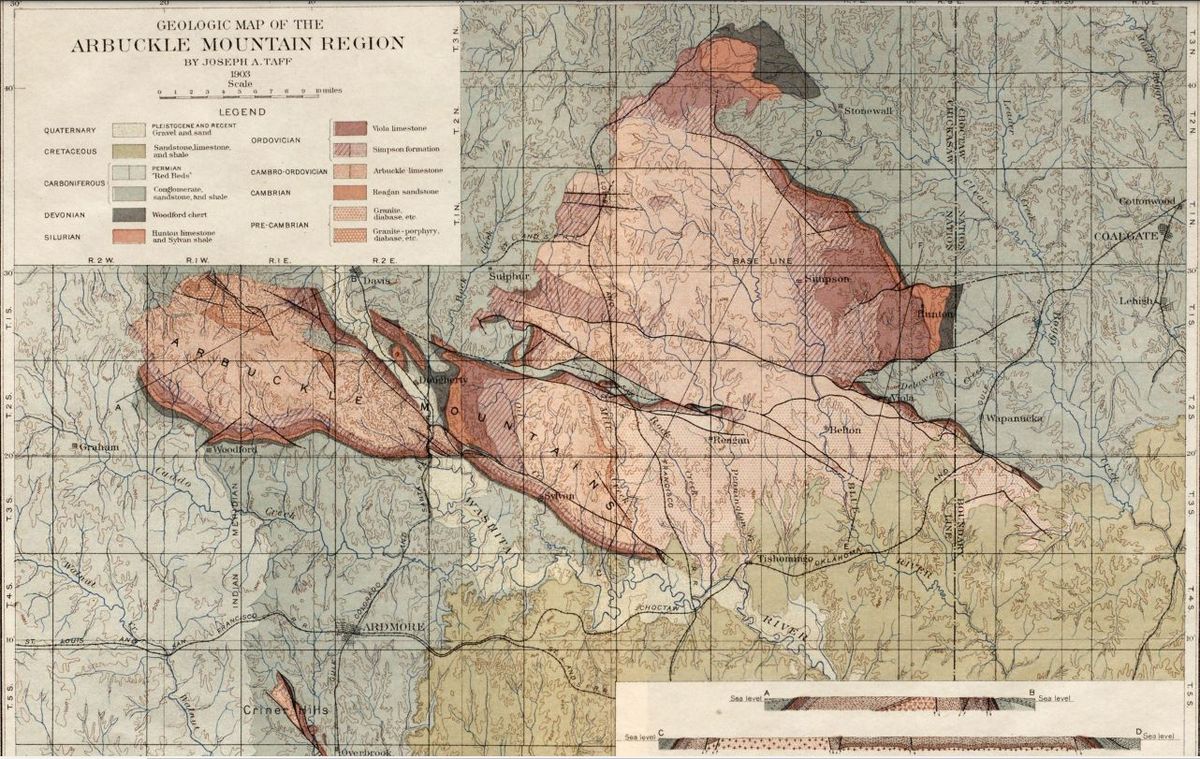
USGS geologic map of the Arbuckle Mountain region, Oklahoma. Source: J. A. Taff and H. F. Bain, US Geological Survey, public domain.
19. Hazard and Risk Maps
Hazard maps show where floods, wildfires, earthquakes, landslides or storm surge are likely. In the US, FEMA flood insurance rate maps (FIRMs) mark Special Flood Hazard Areas, land with a 1 percent or greater chance of flooding in any year, which drives flood insurance requirements for mortgages. Insurers, lenders, planners and emergency managers are the main users.
After an event, before and after satellite imagery is the fastest way to map actual damage across a whole area. See how insurers use satellite imagery for claims and portfolio risk.
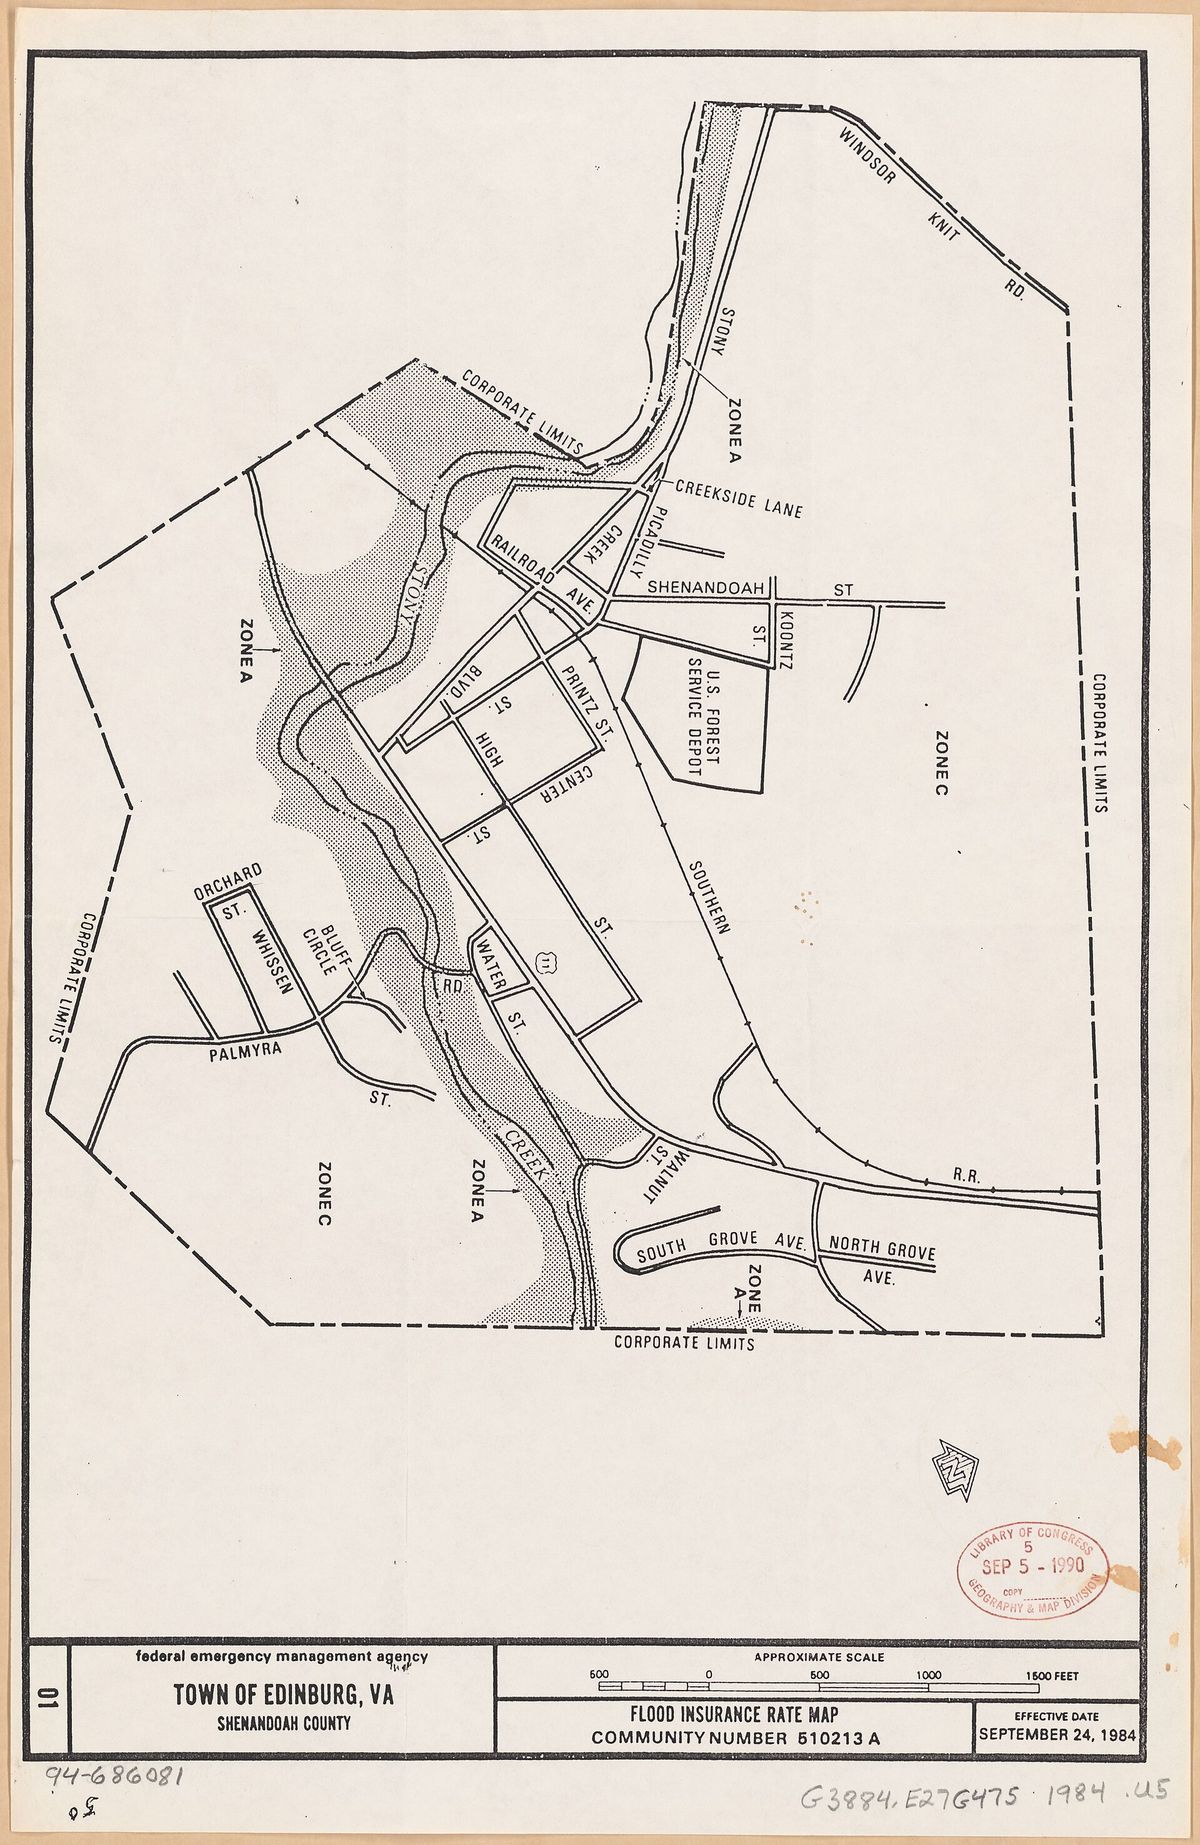
FEMA flood insurance rate map, Town of Edinburg, Virginia. Source: Federal Emergency Management Agency, public domain.
Historical Maps
20. Historical Maps
Historical maps show places as they were mapped in the past, or recreate past borders, battles and trade routes. They matter for research and teaching, and in practical work they help trace old shorelines, former industrial sites, buried streams and land claims.
The 1507 world map by Martin Waldseemuller is the first known map to use the name "America". The Library of Congress holds the only known surviving copy. For recent change, archive satellite imagery is the modern historical map: it shows the same site year by year, which is how teams date construction, check land clearing or settle disputes.
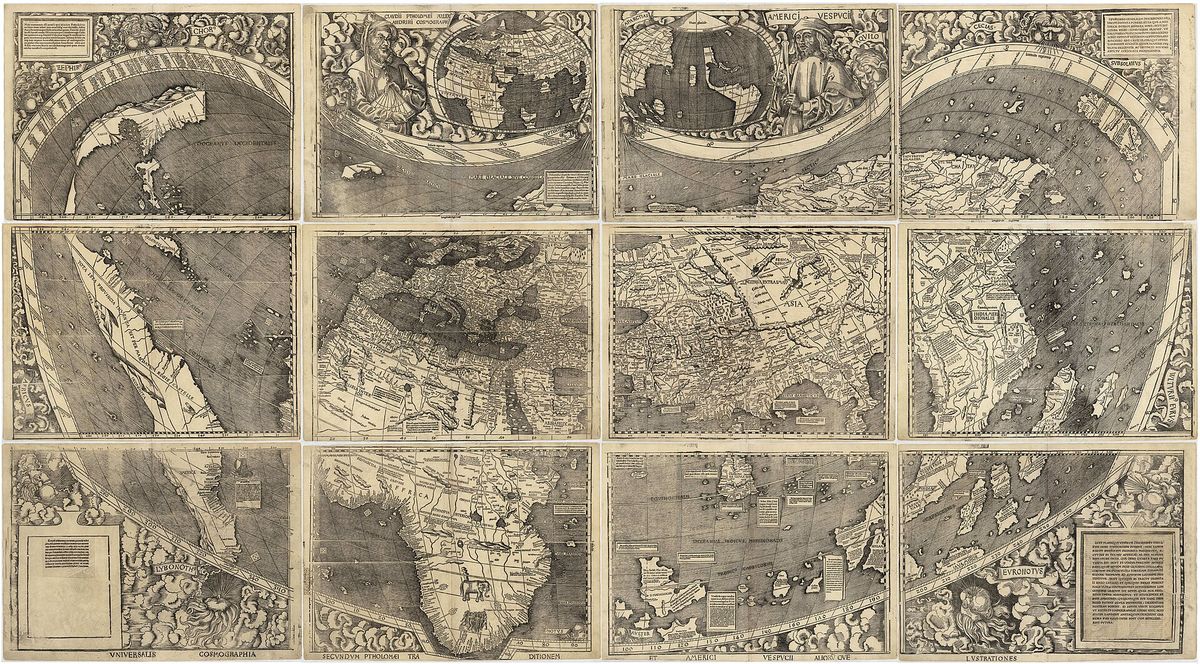
Waldseemuller world map, 1507, the first map to name America. Source: Martin Waldseemuller, Library of Congress, public domain.
Modern Map Types Built From Satellite and Sensor Data
21. Satellite Image Maps and Orthophotos
A satellite image map is a picture of the real ground surface, corrected so it lines up with map coordinates. When the image is orthorectified, terrain and sensor tilt are removed so distances and areas can be measured, and it becomes an orthophoto, a true map you can overlay with parcels, roads and plans in GIS.
Commercial optical satellites now capture detail down to 30 cm per pixel, enough to see cars, road markings and rooftop equipment. Resolution is only one of four kinds; spectral, temporal and radiometric resolution matter too, as we explain in the 4 types of satellite imagery resolution. Unlike map apps, a purchased image comes with a known capture date and a license for commercial use.
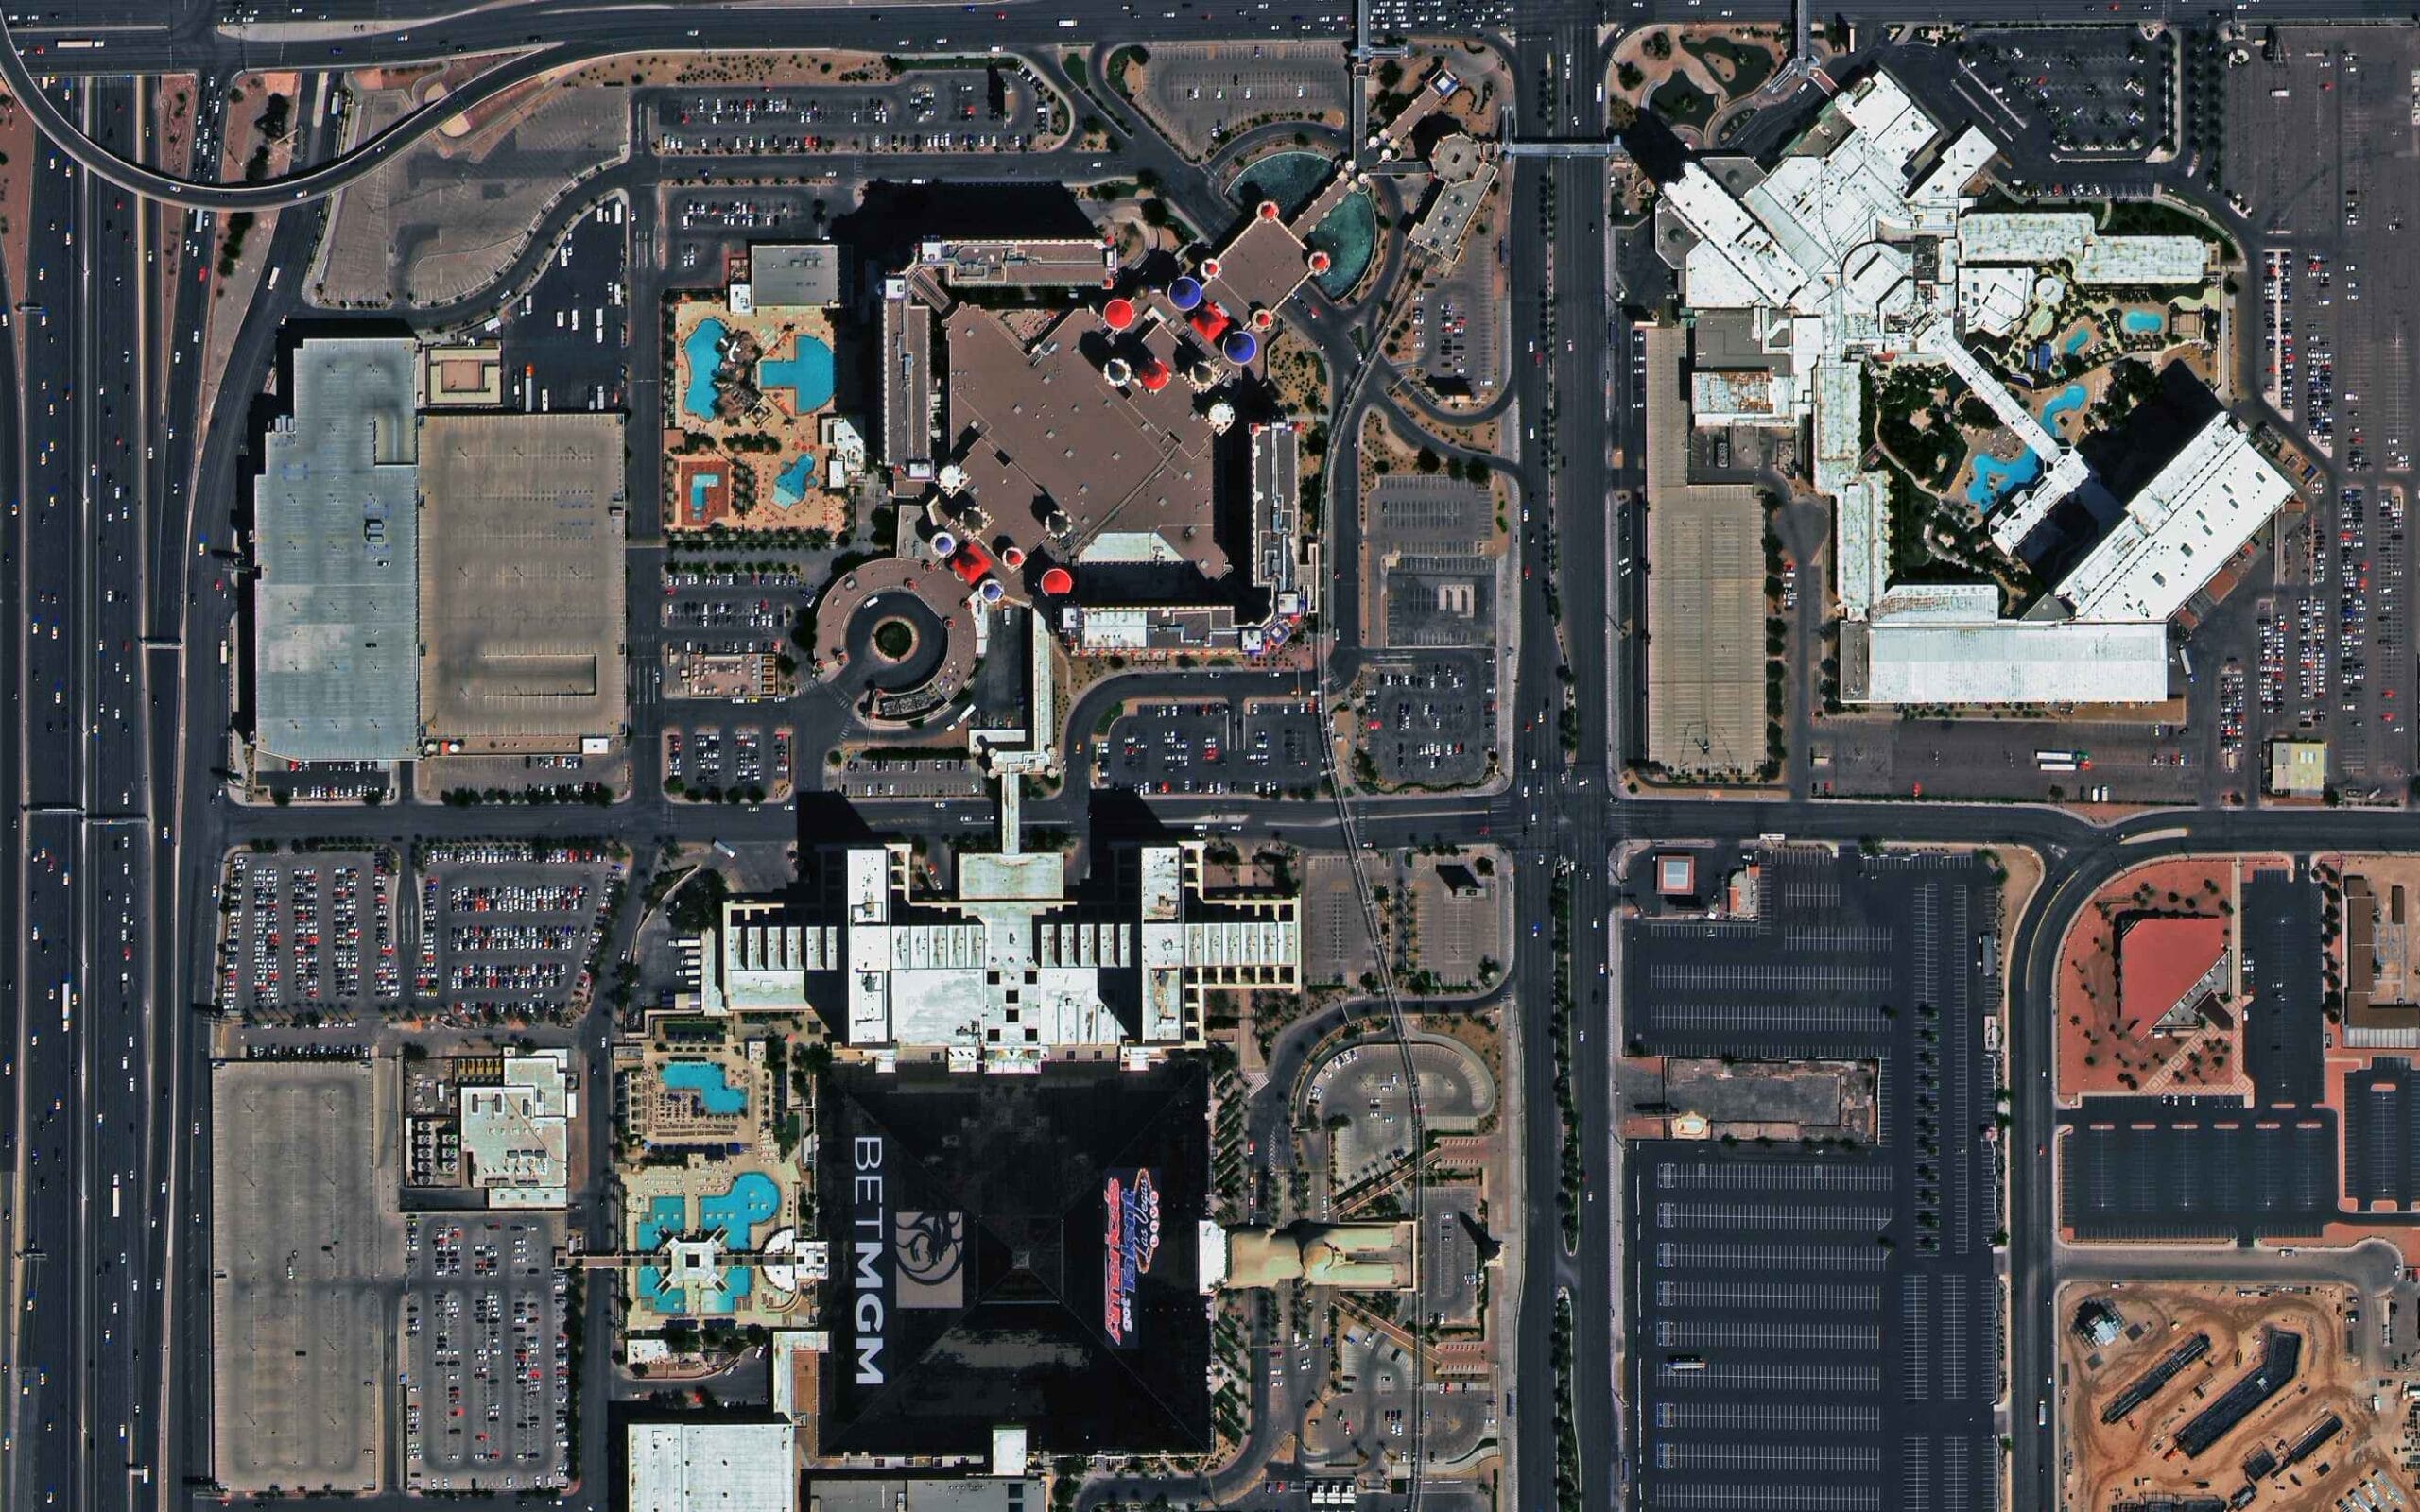
XRTech Group sample: 30 cm SuperView Neo-1 satellite image of the Las Vegas Strip.
Who buys satellite image maps: construction and engineering firms tracking progress, insurers checking claims, real estate and planning teams, mining and energy companies, governments and defense. You can buy high-resolution satellite imagery from XRTech Group from archive or order a new capture, from 30 cm to 2 m, delivered as GeoTIFF ready for GIS.
22. Elevation Models and 3D Maps
A digital elevation model is a grid of heights rather than a picture. A DTM shows the bare ground, and a DSM includes buildings and trees. From them you get slope, drainage, flood extent, volumes and line of sight, plus 3D views and contour maps generated on demand.
Elevation models come from stereo satellite imagery, lidar or radar. Learn the differences in DEM, DSM and DTM explained, or see our DEM services for project data.
23. Interactive Web Maps
An interactive web map stacks many map types in one place: a basemap (road, topographic or satellite), thematic layers you can switch on and off, search, and data you can click. Google Maps is the everyday version. GIS teams build their own with tools such as QGIS, ArcGIS or web libraries like Leaflet. Our GIS software guide compares the options.
XRTech Group publishes free interactive maps you can use now, no signup needed: the Florida cities and towns map, the Seattle ZIP code map, the UTM zone finder, the satellite area calculator, the KML and KMZ viewer and live satellite tracking.
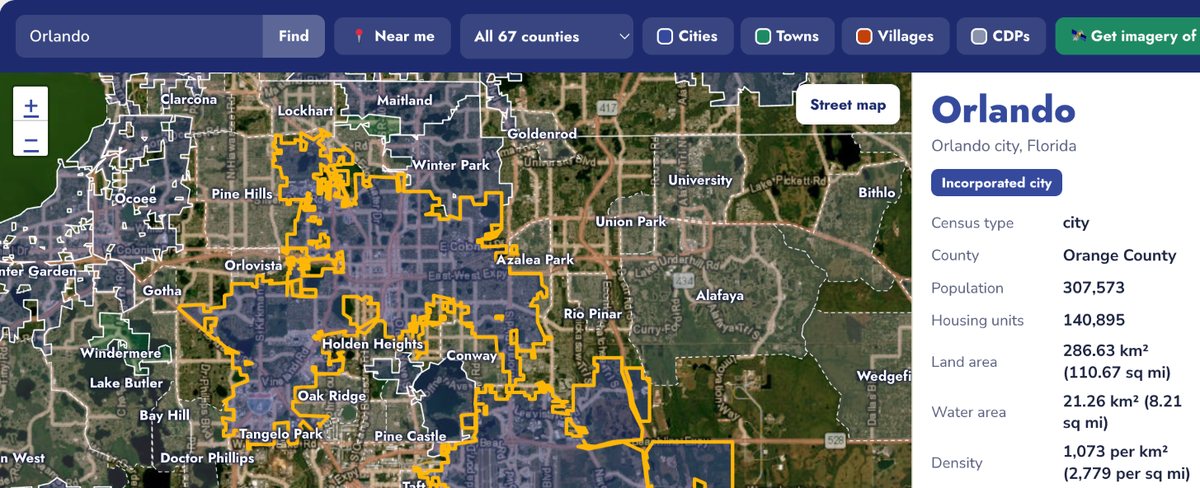
XRTech Group interactive Florida cities and towns map showing the Orlando city boundary with 2020 Census data.
Map Projections: Why Every Flat Map Is Wrong Somewhere
The Earth is round, and paper and screens are flat, so every map projection distorts something: area, shape, distance or direction. The type of map you need decides which distortion you can live with.
Projection
Keeps
Best for
Mercator and Web Mercator
Shape and direction locally
Navigation and web map apps; distorts area badly near the poles
Equal area (Albers, Mollweide)
Area
Choropleth and dot density maps, statistics
Transverse Mercator and UTM
Shape and distance within a narrow zone
Engineering, surveying, topographic maps
Lambert conformal conic
Shape over mid latitudes
Aeronautical charts, state plane coordinates
Plate carree (latitude and longitude)
Simple coordinates
Data exchange and quick global views
On a Mercator map Greenland looks about as big as Africa, yet Africa is roughly 14 times larger. For measurement work, use a projected system such as UTM. Our UTM guide explains zones and EPSG codes, and the UTM zone finder shows the zone for any place.
Map Scale: Large Scale vs Small Scale
Scale is the ratio between map distance and ground distance. The naming confuses many people: a large scale map, such as 1:5,000 or 1:24,000, shows a small area in great detail, while a small scale map, such as 1:1,000,000, shows a large area with little detail. A world wall map is small scale, and a city block plan is large scale.
For imagery, the equivalent is ground resolution. A 30 cm satellite image supports roughly the detail of a large scale city map, while 10 m to 30 m imagery suits regional land cover mapping.
How to Choose the Right Type of Map
If you need to show
Use this type of map
Who governs a place or where borders run
Political or administrative map
Terrain, slope and elevation
Topographic map or DEM
A rate or density by area
Choropleth map (normalized data)
Exact locations of many events
Dot density map or heat map
Totals at cities or sites
Proportional symbol map
Movement between places
Flow map
Long term conditions or zones
Climate map
Property boundaries
Cadastral map plus survey
Flood, fire or storm exposure
Hazard and risk map
What is on the ground right now
Current satellite image map
Change over months or years
Archive satellite imagery time series
Examples of a Map in Everyday Work
- Insurance: hazard maps price risk, and before and after satellite images verify claims. Satellite imagery for insurance.
- Urban planning: land use, zoning and choropleth maps of Census data, checked against current imagery of new development. Urban planning and monitoring.
- Construction: topographic maps and DEMs for design, satellite image maps for progress. Satellite imagery for construction.
- Real estate: cadastral maps for parcels, imagery to see the site and its surroundings. Satellite imagery for real estate.
- Agriculture: climate maps for crop choice, multispectral imagery for crop health. Agriculture mapping.
- Environment: land cover and change maps for wetlands, forests and coastlines. Environmental monitoring.
Need a Current Satellite Map of Your Site?
Reference maps tell you what should be there. Satellite imagery shows what is there today. XRTech Group delivers dated, licensed satellite imagery of your exact area from 30 cm resolution, from archive or a new capture, as GeoTIFF ready for your GIS. Search the portal or ask for a free quote.
What are the different types of maps?
The main types of maps are general reference maps (political, physical, topographic and road maps) and thematic maps (choropleth, dot density, proportional symbol, heat, isoline, flow and cartogram maps). Special purpose types include climate and weather maps, nautical and aeronautical charts, cadastral, land cover, geologic and hazard maps, historical maps, satellite image maps, elevation models and interactive web maps.
What are the 5 main types of maps?
Lists vary, but the five types most often taught are political maps, physical maps, topographic maps, climate maps and road maps. Many teachers also include thematic and resource maps. In professional GIS work, the more useful split is reference maps versus thematic maps.
What is an example of a map?
A USGS topographic quadrangle, a world political map, a NOAA weather map and a county parcel map are all examples of a map. Each shows locations at a set scale with a legend, but each serves a different purpose, from navigation to property records.
What are the main types of thematic maps?
The main thematic map types are choropleth maps (shaded areas), dot density maps (dots for counts), proportional symbol maps (sized symbols), heat maps (point density), isoline maps (lines of equal value), flow maps (movement) and cartograms (areas resized by a variable).
What is the difference between a physical map and a political map?
A physical map shows natural features such as mountains, rivers and deserts. A political map shows human boundaries such as countries, states and capitals. Many atlas maps combine both.
What type of map shows elevation?
Topographic maps show elevation with contour lines, physical maps show general relief with shading and color, and digital elevation models store exact heights as a grid that GIS software can analyze.
Is a satellite image a map?
A raw satellite image is a photograph. Once it is orthorectified and georeferenced, so every pixel has a real world coordinate and distances can be measured, it becomes an image map, often called an orthophoto, that can be used like any other map layer.
How many types of maps are there?
There is no fixed number, because maps can be grouped by purpose, data or method. This guide covers 23 types that cover almost every map used in education, government and business.
Which type of map is best for showing population?
Use a choropleth map of population density to compare areas, a dot density map to show where people actually live inside each area, or a proportional symbol map to compare city totals.
Where can I get free maps?
Government agencies publish many maps free of charge, including USGS topographic and geologic maps, NOAA nautical charts and weather maps, FAA aeronautical charts, FEMA flood maps and US Census Bureau boundary files. For current, high resolution imagery of a specific site, commercial satellite imagery is usually needed.
Image Credits and Sources
- Central Intelligence Agency: The World Factbook, political map of the world (public domain)
- Tom Patterson, US National Park Service: Physical map of the contiguous United States (public domain)
- US Geological Survey: Venice quadrangle topographic map; Arbuckle Mountain region geologic map; US Topo and 1:24,000 scale standards
- Interstate Highway System map, Wikimedia Commons (public domain)
- US Census Bureau: 2020 Census and TIGER/Line boundaries, used for the XRTech Group choropleth and proportional symbol maps
- John Snow: Map of cholera deaths in Soho, London, 1854 (public domain)
- Charles Minard: Map of Napoleon's Russian campaign, 1869 (public domain)
- US Department of Agriculture: Plant Hardiness Zone Map, 2012 edition (public domain), and the 2023 update announcement
- NOAA National Centers for Environmental Prediction: Surface weather analysis (public domain)
- NOAA Office of Coast Survey: Chart 18453 Tacoma Harbor (public domain) and the paper and raster chart sunset
- International Hydrographic Organization: S-100 and S-101 implementation status
- Federal Aviation Administration: Anchorage VFR sectional chart (public domain) and the 56 day visual chart cycle
- Salt Lake County Recorder: Great Salt Lake City Plat A, 1857 (public domain)
- Federal Emergency Management Agency: Flood insurance rate map, Town of Edinburg, Virginia (public domain)
- Multi-Resolution Land Characteristics Consortium: National Land Cover Database (public domain)
- Martin Waldseemuller: Universalis Cosmographia, 1507, Library of Congress (public domain)
- XRTech Group: SuperView Neo-1 30 cm sample image and interactive map screenshot