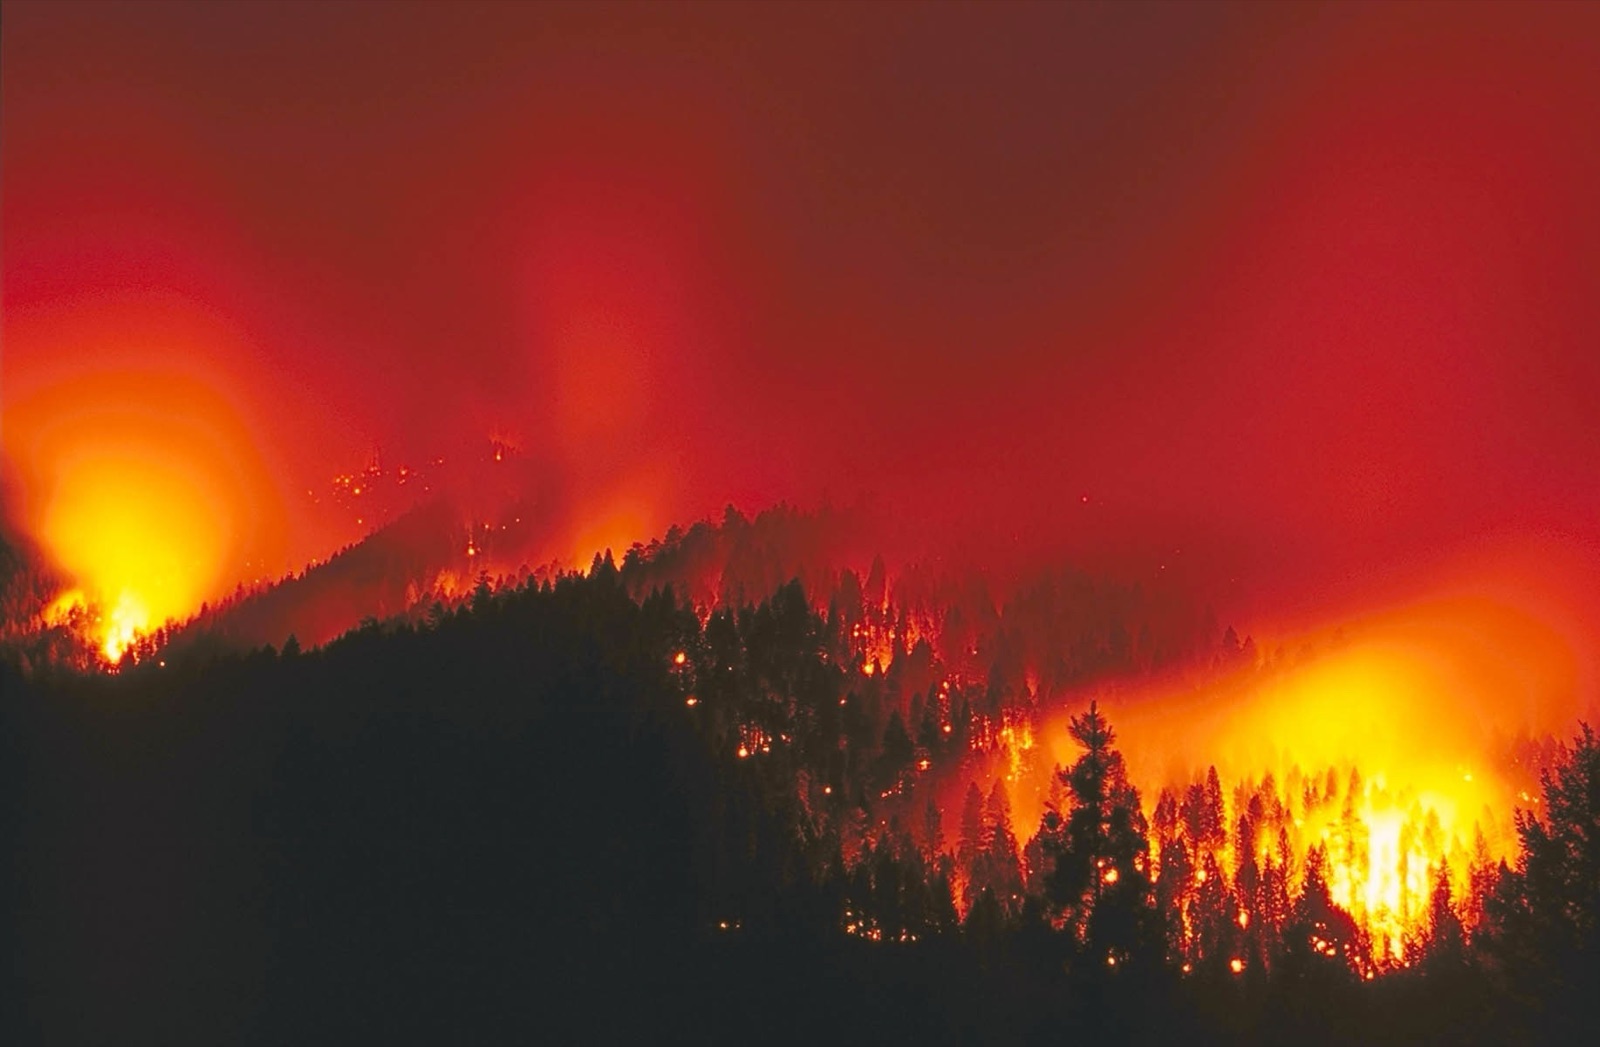
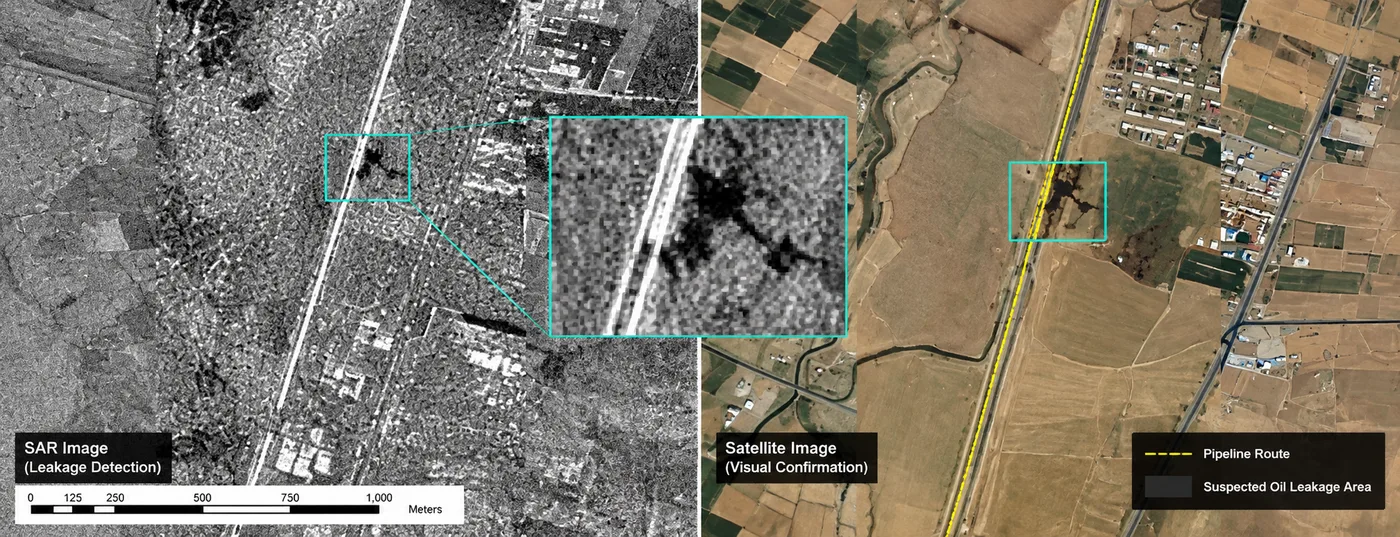
Quick answer: Satellites detect wildfires in two ways. Thermal infrared sensors find the heat of active flames, and optical and radar imagery confirms the fire and maps its perimeter and burned area. Geostationary satellites such as GF-4 (every 20 seconds) and GOES (every 5 to 10 minutes) can flag a fire within minutes; polar-orbiting MODIS and VIIRS add sharper detections a few times a day; sub-metre optical and SAR imagery then map the fire line. In a four-day emergency campaign over northern Algeria, 7 of our satellites captured 69 scenes and XRTech Group mapped six fire zones day by day with an AI model at about 90% accuracy against manual mapping. Thick cloud, small understory fires and gaps between passes are the real limits.
69 scenesSatellite images collected in 4 days7 satellitesOptical, hyperspectral and radar on one fire6 fire zonesBurned area mapped day by dayAbout 90%AI accuracy against manual mapping
Why Satellite Wildfire Detection Matters
Fire seasons are starting earlier and lasting longer in many regions, and about 4 million km² of land burns worldwide every year, most of it far from roads, towers or people. A fire that starts in a remote forest can burn for hours or days before anyone reports it, and by then it needs far more crews and aircraft to stop. Satellites watch the whole landscape at once, including places with no cameras, no mobile signal and no patrols.
Satellite images on their own are not a warning, though. Someone, or a trained model checked by analysts, has to separate a real fire from a hot roof or a gas flare, judge how fast it is growing and turn the result into a map that a fire chief can act on. That interpretation step is where most of the value is.
How Satellites Detect Wildfires: Thermal, Optical and Radar
Each sensor type sees a different part of the fire, so operational systems combine them instead of relying on one.
Method
Example satellites
What it sees
Best for
Thermal infrared
GF-4, GOES, Himawari, MODIS, VIIRS, GF-5B
Heat of active flames, even when the fire covers only part of a pixel
Early detection and fire intensity
Optical (near and short-wave infrared)
SuperView, GF-1, GF-6, Sentinel-2, Landsat
Smoke, the fire line, burn scars and burned vegetation
Confirming fires, perimeters and burned area
SAR radar
GF-3, LT-1, Sentinel-1
Ground surface and terrain through smoke, cloud and darkness
Perimeters under smoke and post-fire damage
Thermal detection works because burning vegetation glows strongly in the mid-wave infrared band near 3.5 to 4.1 µm. Algorithms compare each pixel with its surroundings and flag pixels that are far hotter than the background, so a fire much smaller than the pixel can still trigger an alert, often before the smoke is visible, as long as cloud and the viewing angle allow.
Optical mapping uses near-infrared and short-wave infrared bands. Healthy vegetation reflects near infrared strongly; burned land reflects less near infrared and more short-wave infrared. The Normalized Burn Ratio, NBR = (NIR − SWIR) / (NIR + SWIR), drops sharply after a fire, and comparing NBR before and after (dNBR) grades burn severity. See our guide to vegetation indices for NDVI, NDMI and others.
Radar does not see flames, but it images the ground through smoke and cloud, which keeps the perimeter and terrain visible when optical satellites see only smoke. More in can satellites see through clouds.
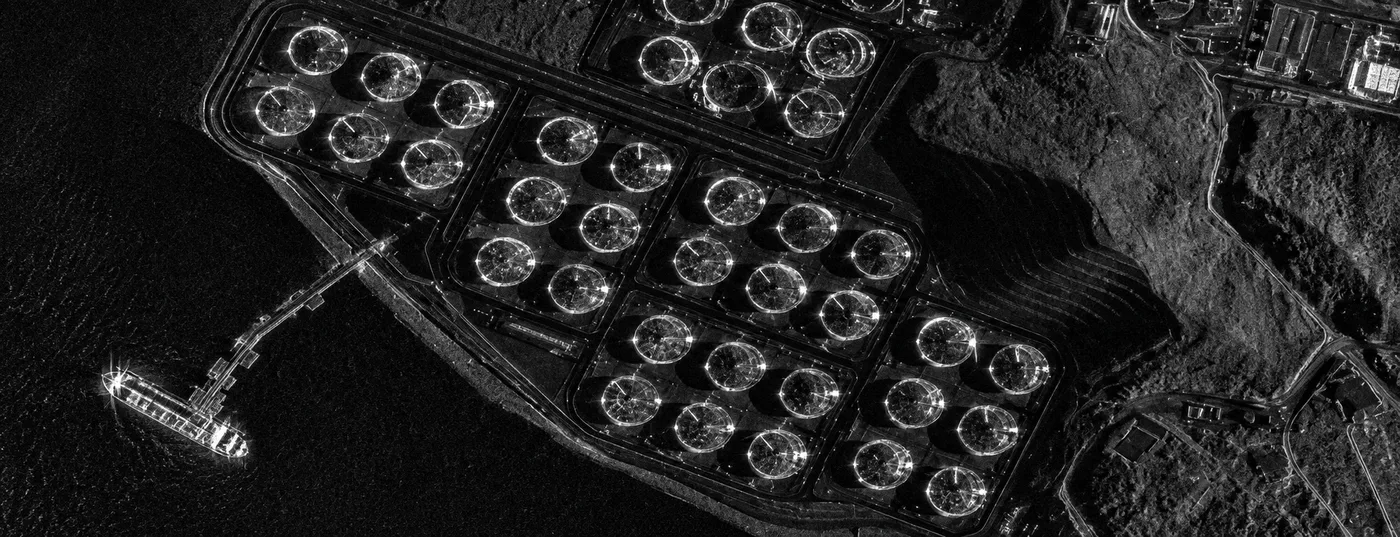
Radar (SAR) imagery is captured day or night and through cloud and smoke, so the fire area stays under watch when optical satellites cannot see.
How Fast Can a Satellite Detect a Wildfire?
It depends on the orbit. A geostationary satellite stares at the same region all the time and can flag a fire within minutes. A polar-orbiting satellite passes over a given spot only a few times a day. Free high-resolution satellites revisit every 5 to 8 days, which is too slow for detection but fine for burned area mapping.
Chart: how often each satellite type sees the same fire (shorter bar = faster detection, log scale)
GF-4 geostationary20 secondsGOES, Himawari5 to 10 minMODIS, VIIRSHoursCommercial taskingWithin 24 hSentinel-2About 5 daysLandsat 8 and 98 days
Satellite type
Examples
How often it sees the same fire
Detail
Geostationary, staring thermal
GF-4
Every 20 seconds
50m visible, 400m mid-wave infrared
Geostationary weather
GOES-18, GOES-19, Himawari-9
Every 5 to 10 minutes
About 2 km for fire detection
Polar-orbiting thermal
MODIS, VIIRS
A few passes a day
1 km (MODIS), 375m (VIIRS)
Free high-resolution optical
Sentinel-2, Landsat 8 and 9
About every 5 days (Sentinel-2), 8 days (Landsat)
10m to 30m
Commercial tasked optical and SAR
SuperView-1 and 2, GF-1, GF-6, HJ-2, GF-3, LT-1
On demand, several satellites per day; emergency imagery within 24 hours
0.5m to 16m
So the claim that satellites are "too slow" is only true for free polar and high-resolution satellites used alone. A staring geostationary sensor such as GF-4 closes the minute-scale gap, and a constellation of commercial satellites tasked together closes the gap between passes, as the Algeria campaign below shows.
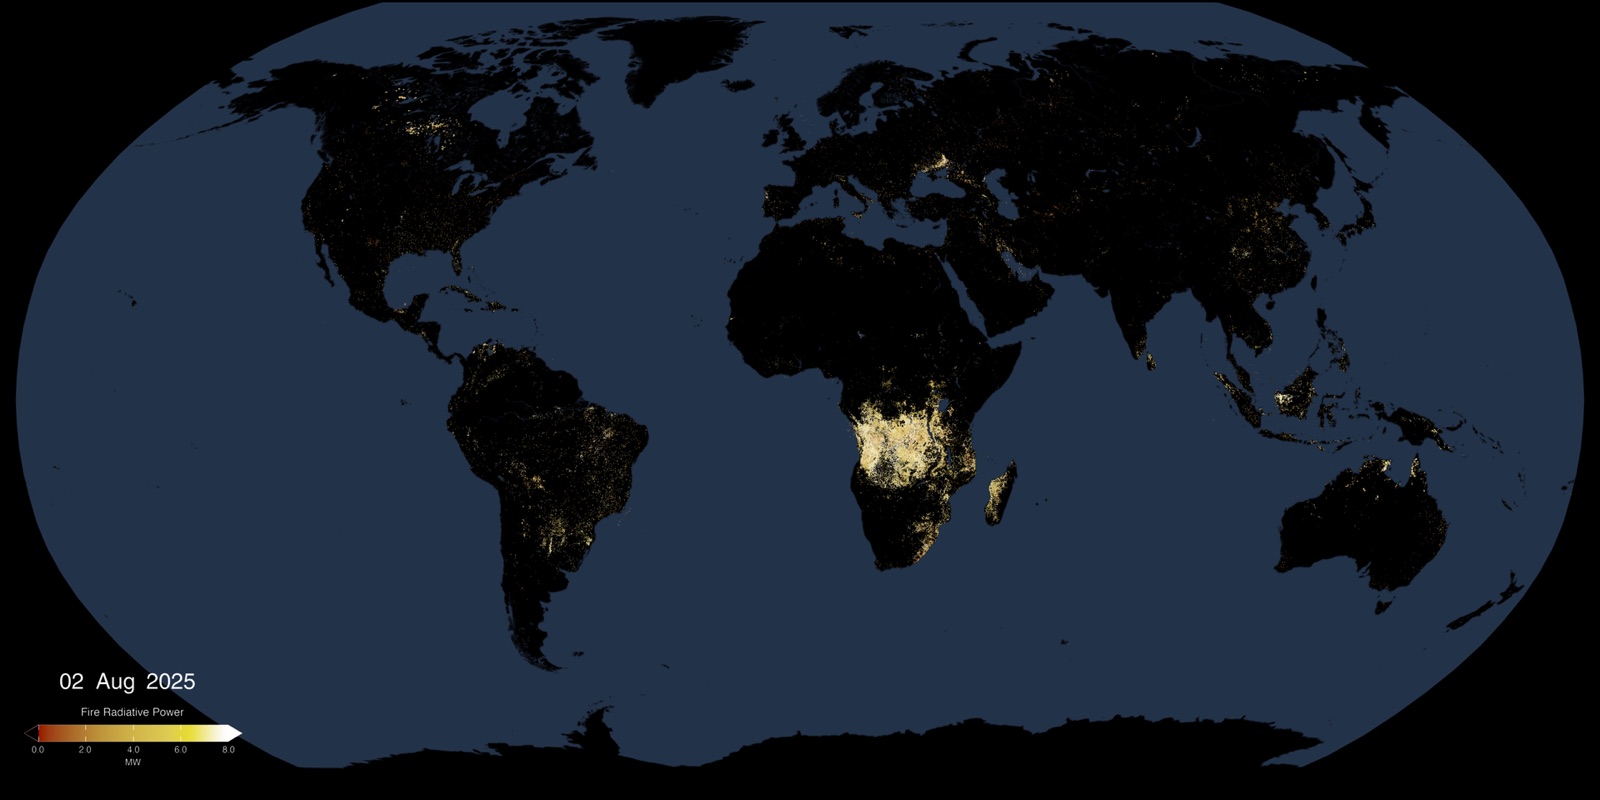
Active fires worldwide as seen by VIIRS, a polar-orbiting thermal sensor. Image: NASA, public domain.
Real-World Results: Algeria Wildfires Mapped Day by Day
Northern Algeria: 69 scenes, 7 satellites, 6 fire zones in 4 days
When forest fires broke out across several regions of northern Algeria, our optical, hyperspectral and radar satellites were tasked for emergency imaging: SuperView-1, SuperView-2, CB-04A, GF-1, GF-6, HJ-2A and HJ-2B, at sub-metre, 2m and 16m. From 27 to 30 July, 69 scenes were collected over six key fire zones: two in Béjaïa, two in Bouira, Collo and Khemis El Khechna. An AI fire-area extraction model traced the fire boundaries, with overall accuracy of about 90% against manual interpretation.
Burned area by zone (km²)
Fire zone
24 to 26 July
27 July
29 to 30 July
Béjaïa 1
118.09 to 123.67
132.81
No clear image
Béjaïa 2
21.32 to 26.68
27.32
27.60 (29 July)
Bouira 1
20.62 to 65.56
69.00
69.93 (30 July)
Bouira 2
4.02 to 21.60
24.33
No clear image
Collo
0.27 to 27.70
28.13
28.65 to 28.79
Khemis El Khechna
0.80 to 0.80
1.63
1.94 (29 July)
"No clear image" means no satellite pass that day or cloud too thick to read the fire boundary. Cloud was worst on 28 July, so no zone could be measured that day.
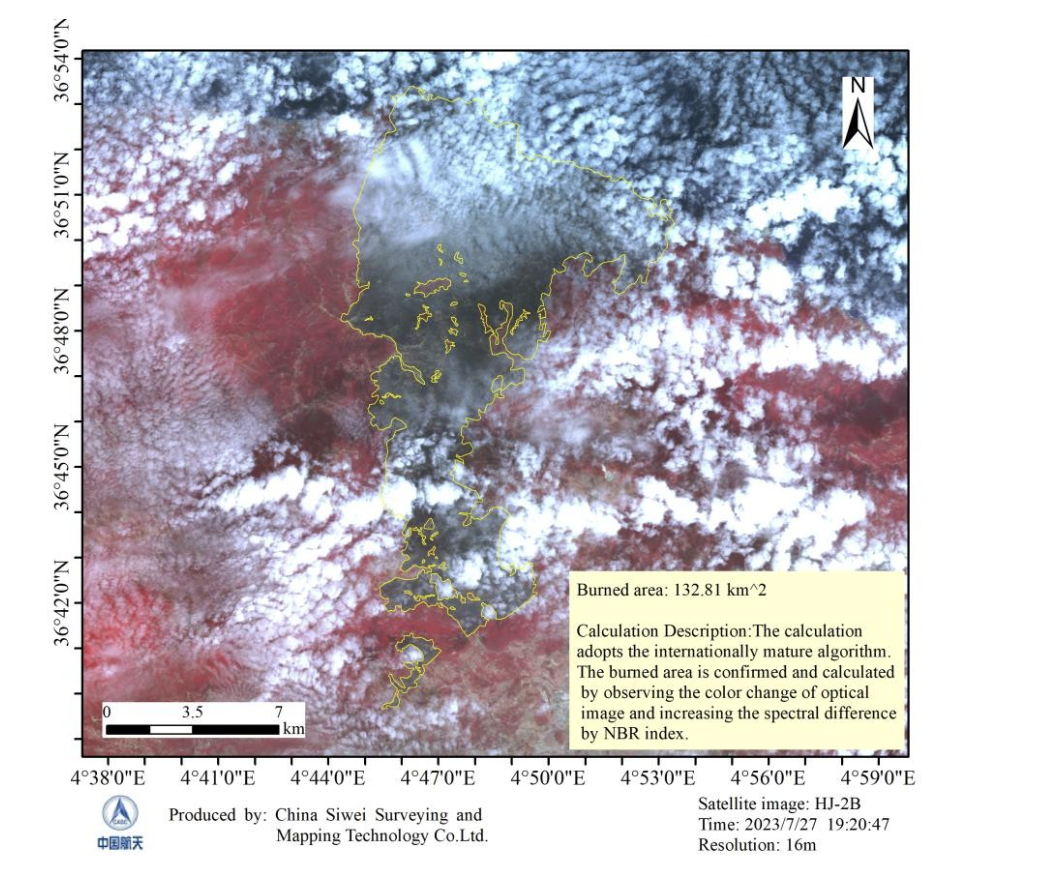
Béjaïa 1, 27 July: the largest zone, 132.81 km², covered in a single 16m HJ-2B view despite heavy cloud around the fire.
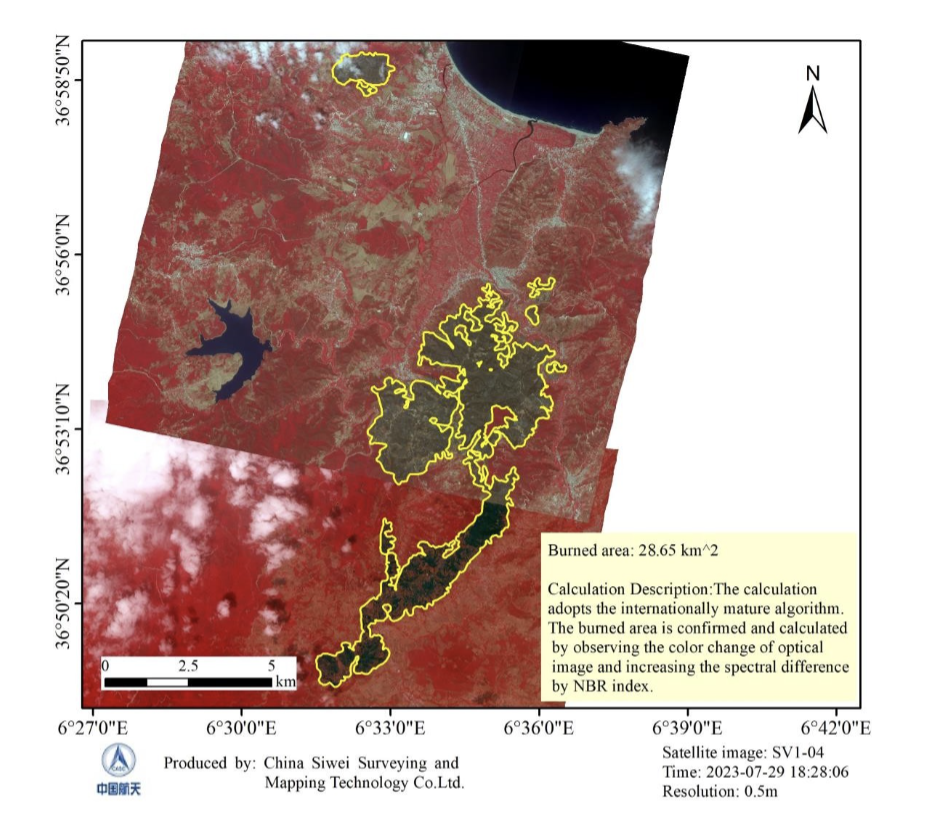
Collo, 29 July: burned area traced on 0.5m SuperView imagery, 28.65 km². The next day, 16m HJ-2B imagery measured 28.79 km².
Chart: Collo burned area by date (km²). The fire grew fast until 26 July, then almost stopped. 28 July: cloud, no measurement.
0.2724 Jul27.7026 Jul28.1327 JulCloud28 Jul28.6529 Jul28.7930 Jul
What the time series showed
- Fires brought under control: Béjaïa 2, Bouira 1, Collo and Khemis El Khechna each grew by less than 1 km² between 27 and 30 July.
- Collo slowed sharply: 27.43 km² burned between 24 and 26 July, then only 0.66 km² between 27 and 30 July.
- Bouira 1 the same: 44.94 km² between 24 and 26 July, then 0.93 km² between 27 and 30 July.
- One zone could not be judged: Béjaïa 1, the largest at 132.81 km², had too few clear images after 27 July to measure a trend.
Chart: burned area added in each period (km²). Dark bars 24 to 26 July, green bars 27 to 30 July.
Bouira 1, 24 to 26 Jul+44.94Bouira 1, 27 to 30 Jul+0.93Collo, 24 to 26 Jul+27.43Collo, 27 to 30 Jul+0.66Béjaïa 2, 24 to 26 Jul+5.36Béjaïa 2, 27 to 29 Jul+0.28Khemis El Khechna, 27 to 29 Jul+0.31
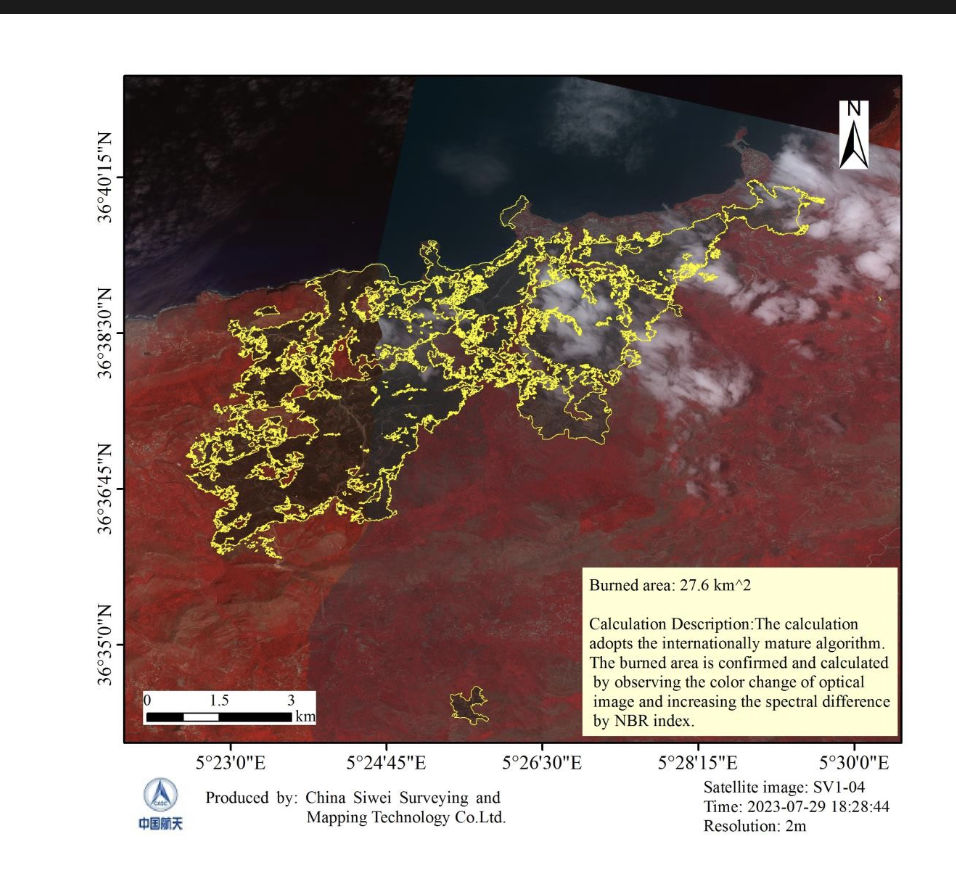
Béjaïa 2: 27.32 km² on 2m GF-1D imagery on 27 July, then 27.6 km² on 2m SuperView imagery on 29 July. Different satellites, one consistent time series.
What this campaign proves
- Many satellites beat one revisit cycle: 69 scenes in four days came from seven of our satellites, so a cloudy day or a missed pass did not stop the monitoring.
- Mixed resolution works: 16m HJ-2B covered the large Béjaïa 1 fire in one view, while 0.5m and 2m imagery traced detailed boundaries.
- AI makes it fast: automatic boundary extraction turned dozens of scenes into area figures within the monitoring window, at about 90% accuracy.
- Cloud is still the main gap: 28 July was lost to cloud, which is why radar and thermal sensors belong in the mix.
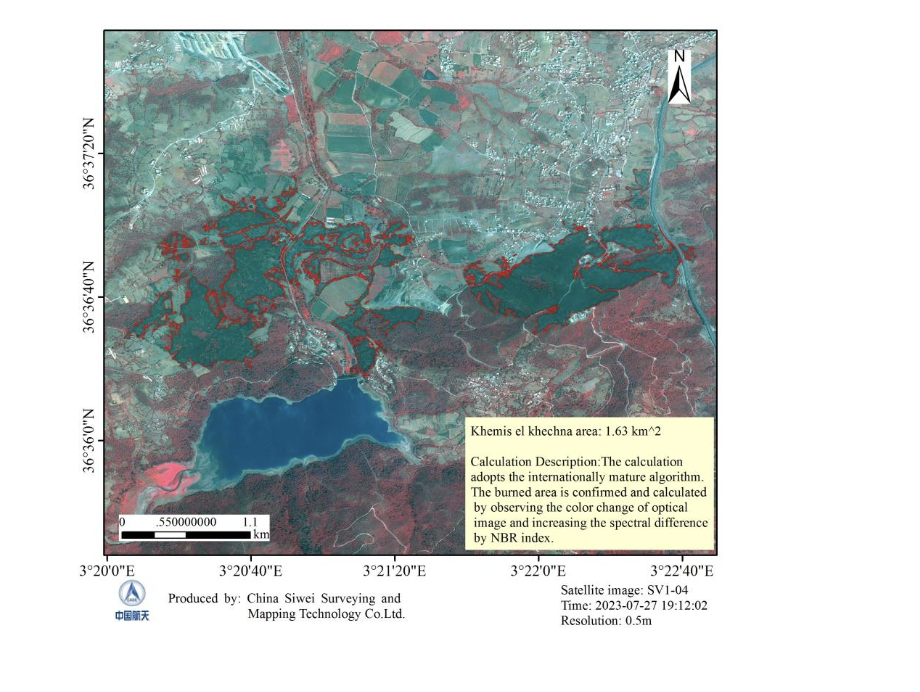
Khemis El Khechna, 27 July: small, scattered burn patches traced on 0.5m imagery, 1.63 km². Sub-metre detail separates burned forest from fields and villages.
Real-World Results: Every Large Fire Covered for a National Emergency Department
XRTech Group monitored 29 large forest and grassland fires for a national emergency management department, covering 100% of the large fires in the programme. Each fire followed the same chain: fire point alarm, verification with high-resolution imagery, continuous tracking, emergency imaging of the fire area, and a loss assessment with thematic maps after containment.
01Fire point alarmThermal hotspot flagged automatically02VerificationHigh-resolution image confirms a real fire03TrackingRepeat passes follow spread and smoke04Emergency imagingSub-metre to 16m, optical and SAR05Loss assessmentBurned area, severity and fire report
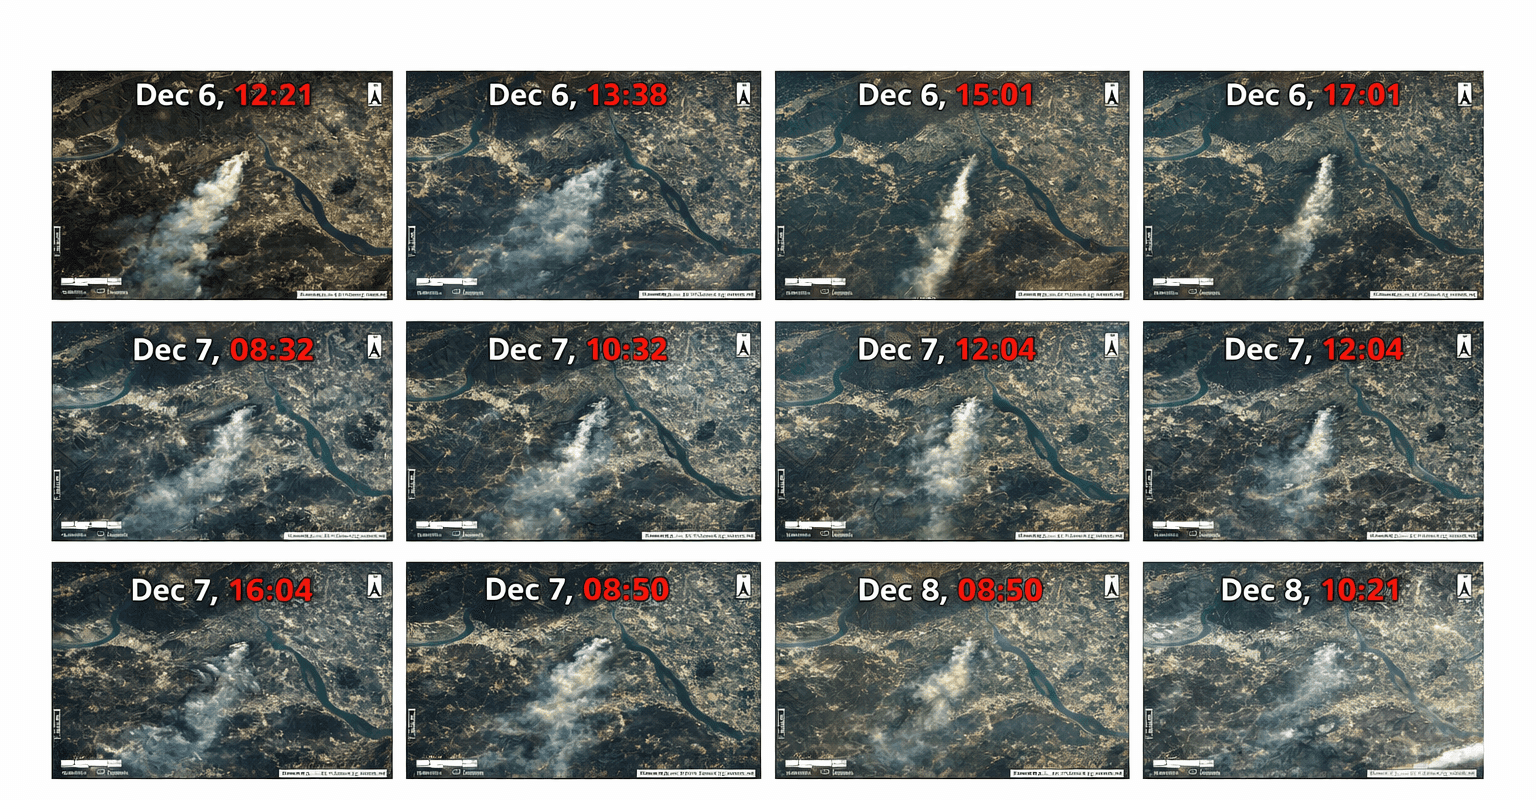
GF-4 time series: the geostationary satellite follows a fire and its smoke plume through the day, refreshing every 20 seconds.
Before, During and After a Fire: What Satellite Images Do at Each Stage
Stage
What satellite images show
Who uses it
Before the fire
Fire risk from vegetation density and dryness (NDVI, NDMI), soil moisture, topography and past burn scars; where to cut firebreaks and run prescribed burns
Forest agencies, planners, utilities
During the fire
Hotspot alerts, fire point checks, perimeter, and spread speed and direction from wind, humidity and terrain; smoke direction for evacuation and crew positioning
Fire departments, incident command, evacuation teams
After the fire
Burned area and burn severity (dNBR) within days, damaged buildings and assets, then regrowth and erosion risk
Recovery agencies, insurers, NGOs, restoration teams
Insurers use the after-fire layers to verify claims at property level; see satellite imagery for insurance. For the wider disaster cycle, see satellite imagery for disaster management.
Limitations of Wildfire Detection from Satellite Images
- Cloud and thick smoke block optical sensors and weaken thermal ones. Fix: add SAR, which images through both, and use the next clear pass from another satellite.
- Gaps between passes on free satellites are hours to days. Fix: geostationary thermal for minutes, plus several commercial satellites tasked together.
- Small and understory fires burning under the canopy, or far smaller than a thermal pixel, can stay hidden. Fix: ground reports, lookout cameras and patrols raise the first alert; satellites confirm and track the spread.
- False alarms from factories, gas flares or sun glint. Fix: confirm each hotspot with high-resolution imagery before sending crews.
- Coarse geostationary pixels (400m to 2 km) show that something is burning, not exactly where the fire line is. Fix: follow up with sub-metre to 2m imagery.
The strongest setup layers all of these: geostationary thermal for minute-scale alerts, polar thermal for sharper detections, tasked optical and SAR for the fire line and burned area, and ground sensors and weather data in one platform.
Satellites, Ground Sensors and Cameras: How the Layers Work Together
No single layer is fast, wide and detailed at the same time, so each one does what it is best at. Ground gas sensors can pick up a fire in the smouldering phase, before flames appear; cameras confirm it visually; satellites give the regional picture, track the spread and map the damage.
First minutesGround sensors and camerasGas sensors catch smouldering, cameras confirm flames, but only where they are installedMinutesGeostationary thermalGF-4 every 20 seconds, GOES every 5 to 10 minutes, whole regions at onceHoursPolar-orbiting thermalMODIS and VIIRS at 1 km and 375m confirm and locate hotspotsWithin 24 hoursTasked optical and SAR0.5m to 16m imagery maps the fire line, through smoke with radarContinuousAI and analystsVerify alerts, measure burned area and issue maps and fire reports
XRTech Group’s forest fire monitoring platform brings satellite, weather, vegetation and ground sensor feeds into one system, so an alert from any layer is checked against the others before crews are sent.
How Much Does Satellite Wildfire Detection Cost?
Free services such as NASA FIRMS, Copernicus EFFIS, Sentinel-2 and Landsat cover first alerts and risk mapping at no cost. Paid imagery is priced per km² by how fast you need it:
Tier
Speed
XRTech Group price per km²
Active fire emergency tasking
Tasked immediately, imagery within 24 hours
USD 80 at 30cm, USD 66 at 50cm
Priority tasking
Captured in 3 to 5 days
USD 45 at 30cm, USD 37 at 50cm
Post-fire mapping
Captured within 7 days
USD 30 at 30cm, USD 20 at 50cm
Pre-fire archive baseline
Delivered within 48 hours of approval
From USD 1 at 2m, USD 20 at 30cm
Example: emergency imagery of a 100 km² fire area at 50cm costs USD 6,600. New tasking starts at 100 km² and archive at 25 km². Thermal monitoring, SAR, burned area analysis and fire season programmes are quoted per event or per season.
What changes the cost: the size of the area, the resolution, how fast you need the data, the sensor mix (free, commercial optical, thermal or SAR), the analysis you need, and whether ground sensors and cameras are integrated. Free satellite data keeps risk mapping cheap; minute-level warnings need geostationary or ground layers on top.
The Bottom Line
Wildfire detection from satellite images works, and it is faster than most people think when geostationary thermal sensors and several commercial satellites are used together. It is not a single, flawless tool: cloud, small understory fires and coarse pixels still need other layers. The best results come from a multi-layered system, planned from the start, where satellites provide the wide-area view, the fire line and the burned area, and ground sensors and analysts fill the gaps.
How XRTech Group Helps With Wildfire Detection
XRTech Group is a satellite imagery and geospatial analytics provider with access to more than 130 optical, thermal, hyperspectral and SAR satellites. For wildfires it delivers:
- Minute-scale alerts: GF-4 geostationary thermal watch, refreshed every 20 seconds.
- Multi-satellite emergency tasking: our optical, hyperspectral and radar satellites tasked together over the fire area, with emergency satellite imagery within 24 hours.
- Fire through smoke: GF-3 C-band SAR at 1m and LT-1 L-band SAR at 3m.
- AI burned area mapping: boundaries and areas per zone and per day, about 90% accurate against manual mapping.
- Full fire cycle: risk maps before, tracking during, burn severity, loss and recovery after.
- One platform: satellite, weather, vegetation and ground sensor data with alerts, thematic maps and fire reports.
See all products, prices and buyer options on the wildfire detection and forest fire monitoring page.
Get Satellite Wildfire Monitoring for Your Area
Send the fire location or your forest boundary. XRTech Group replies with satellite passes, a tasking plan and a price per km², and active fires are answered first.
Frequently Asked Questions
Why is satellite wildfire detection important?
Fires in remote forests can burn for hours or days before anyone reports them, and fire seasons are getting longer. Satellites watch whole regions at once, including places with no roads, cameras or patrols, so fires are found earlier and mapped accurately for response, insurance and recovery.
How long does it take for a satellite to detect a wildfire?
Geostationary satellites detect fires within minutes: GF-4 refreshes every 20 seconds and GOES every 5 to 10 minutes. Polar-orbiting MODIS and VIIRS see a fire a few times a day, and free high-resolution satellites only every 5 to 8 days. XRTech Group combines geostationary alerts with tasked imagery delivered within 24 hours.
Can satellites detect wildfires through smoke and clouds?
Thermal sensors see active fire through thin smoke, but thick smoke and cloud block optical imagery. Radar (SAR) images the ground through both, so it keeps the fire perimeter and terrain visible, but it does not detect flames directly; its main uses are perimeters under smoke and post-fire damage. In the Algeria campaign, cloud on 28 July blocked optical mapping of every zone for that day.
Can a wildfire early warning system use only satellite images?
Satellites alone can cover huge areas and detect fires within minutes from geostationary orbit, but small or understory fires may stay hidden. The most reliable systems combine satellite alerts with ground reports, cameras and weather data, and use high-resolution imagery to confirm each fire.
What is the difference between thermal indices, NDVI and NBR?
Thermal bands detect the heat of active flames. NDVI measures vegetation greenness and fuel, used for fire risk. NBR compares near-infrared and short-wave infrared to map burned land, and the change in NBR before and after a fire (dNBR) grades burn severity.
How accurate is burned area mapping from satellite images?
XRTech Group’s AI fire-area extraction model reached about 90% overall accuracy against manual interpretation during the Algeria wildfires. Accuracy improves with clear, high-resolution imagery and repeat passes from several satellites.
Can satellites detect small or understory fires?
Thermal sensors can flag fires much smaller than a pixel when the flames are hot and exposed. Fires burning under a closed canopy or smouldering on the ground may not be visible until they grow, so ground reports and cameras remain important for the first minutes.
How much does satellite wildfire detection cost?
Free data from NASA FIRMS, Sentinel-2 and Landsat covers first alerts and risk mapping. XRTech Group emergency imagery costs USD 66 to 80 per km², priority tasking USD 37 to 45, post-fire mapping USD 20 to 30, and pre-fire archive from USD 1 per km² at 2m.
Who provides satellite wildfire detection and monitoring?
XRTech Group provides satellite wildfire detection and forest fire monitoring worldwide: geostationary thermal alerts, multi-satellite emergency tasking, SAR through smoke, AI burned area mapping, burn severity and loss assessment, with emergency imagery within 24 hours.
Related: wildfire detection and forest fire monitoring, emergency satellite imagery, SAR satellite imagery and vegetation indices guide.
Sources
- XRTech Group: wildfire monitoring report, northern Algeria, 24 to 30 July
- NASA: Fire Information for Resource Management System (FIRMS)
- NASA: MODIS and VIIRS active fire products
- NASA: MODIS global burned area product (MCD64A1)
- NOAA: GOES-R Advanced Baseline Imager fire detection
- Japan Meteorological Agency: Himawari-9
- European Space Agency: Sentinel-2 mission
- U.S. Geological Survey: Landsat 8 and 9, and Normalized Burn Ratio
- Copernicus: European Forest Fire Information System (EFFIS)